Having just completed the highly stimulating & inspiring Stanford’s Machine Learning course at Coursera, by the incomparable Professor Andrew Ng I wanted to give my newly acquired knowledge a try. As a start, I decided to try my hand at analyzing one of India’s fastest growing stars, namely Virat Kohli . For the data on Virat Kohli I used the ‘Statistics database’ at ESPN Cricinfo. To make matters more interesting, I also pulled data on the iconic Sachin Tendulkar and the Mr. Dependable, Rahul Dravid.
If you are passionate about cricket, and love analyzing cricket performances, then check out my 2 racy books on cricket! In my books, I perform detailed yet compact analysis of performances of both batsmen, bowlers besides evaluating team & match performances in Tests , ODIs, T20s & IPL. You can buy my books on cricket from Amazon at $12.99 for the paperback and $4.99/$6.99 respectively for the kindle versions. The books can be accessed at Cricket analytics with cricketr and Beaten by sheer pace-Cricket analytics with yorkr A must read for any cricket lover! Check it out!!
(Also do check out my R package cricketr Introducing cricketr! : An R package to analyze performances of cricketers and my interactive Shiny app implementation using my R package cricketr – Sixer – R package cricketr’s new Shiny avatar )
Based on the data of these batsmen I perform some predictions with the help of machine learning algorithms. That I have a proclivity for prediction, is not surprising, considering the fact that my Dad was an astrologer who had reasonable success at this esoteric art. While he would be concerned with planetary positions, about Rahu in the 7th house being in the malefic etc., I on the other hand focus my predictions on multivariate regression analysis and K-Means. The first part of my post gives the results of my analysis and some predictions for Kohli, Tendulkar and Dravid.
The second part of the post contains a brief outline of the implementation and not the actual details of implementation. This is ensure that I don’t violate Coursera’s Machine Learning’ Honor Code.
This code, data used and the output obtained can be accessed at GitHub at ml-cricket-analysis
Analysis and prediction of Kohli, Tendulkar and Dravid with Machine Learning As mentioned above, I pulled the data for the 3 cricketers Virat Kohli, Sachin Tendulkar and Rahul Dravid. The data taken from Cricinfo database for the 3 batsman is based on the following assumptions
- Only ‘Minutes at Crease’ and ‘Balls Faced’ were taken as features against the output variable ‘Runs scored’
- Only test matches were taken. This included both test ‘at home’ and ‘away tests’
- The data was cleaned to remove any DNB (did not bat) values
- No extra weightage was given to ‘not out’. So if Kohli made ‘28*’ 28 not out, this was taken to be 28 runs
Regression Analysis for Virat Kohli There are 51 data points for Virat Kohli regarding Tests played. The data for Kohli is displayed as a 3D scatter plot where x-axis is ‘minutes’ and y-axis is ‘balls faced’. The vertical z-axis is the ‘runs scored’. Multivariate regression analysis was performed to find the best fitting plane for the runs scored based on the selected features of ‘minutes’ and ‘balls faced’.
This is based on minimizing the cost function and then performing gradient descent for 400 iterations to check for convergence. This plane is shown as the 3-D plane that provides the best fit for the data points for Kohli. The diagram below shows the prediction plane of expected runs for a combination of ‘minutes at crease’ and ‘balls faced’. Here are 2 such plots for Virat Kohli.  Another view of the prediction plane
  Prediction for Kohli I have also computed the predicted runs that will be scored by Kohli for different combinations of ‘minutes at crease’ and ‘balls faced’. As an example, from the table below, we can see that the predicted runs for Kohli after being in the crease for 110 minutes and facing 135 balls is 54 runs.
  Regression analysis for Sachin Tendulkar There was a lot more data on Tendulkar and I was able to dump close to 329 data points. As before the ‘minutes at crease’, ‘balls faced’ vs ‘runs scored’ were plotted as a 3D scatter plot. The prediction plane is calculated using gradient descent and is shown as a plane in the diagram below
  Another view of this below
  Predicted runs for Tendulkar The table below gives the predicted runs for Tendulkar for a combination of time at crease and balls faced. Hence, Tendulkar will score 57 runs in 110 minutes after facing 135 deliveries
  Regression Analysis for Rahul Dravid The same was done for ‘the Wall’ Dravid. The prediction plane is below
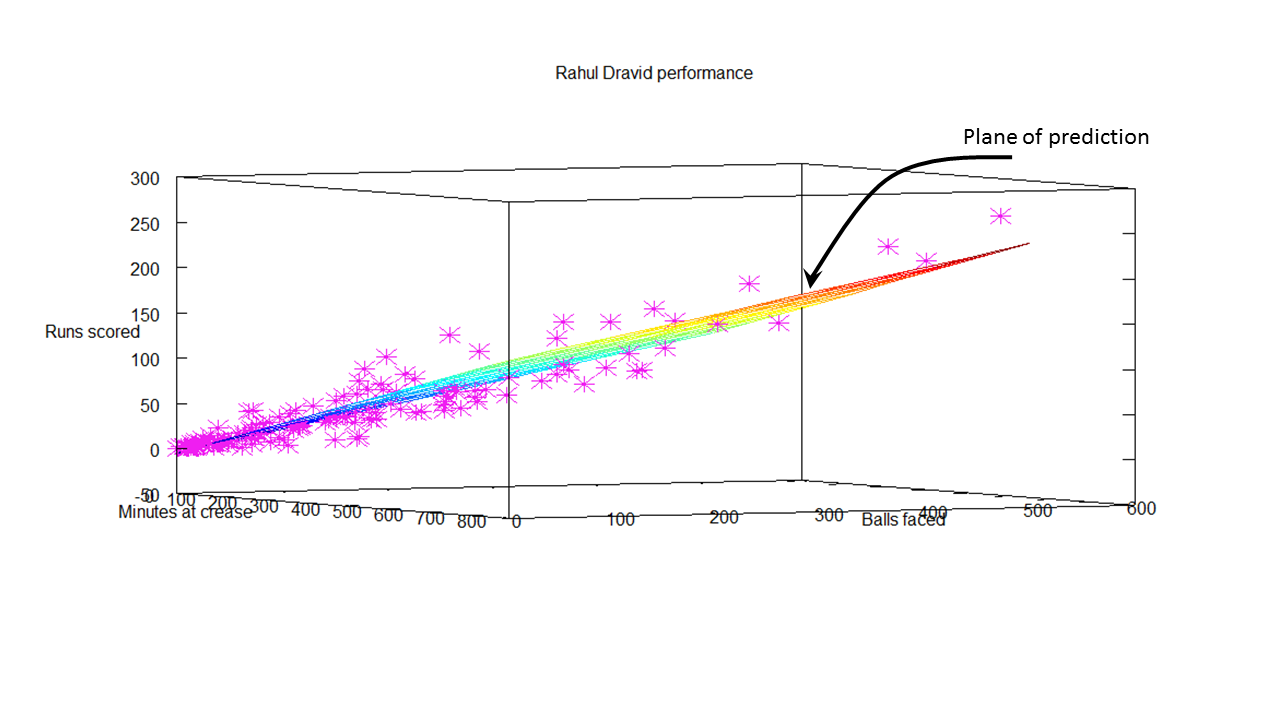 Predicted runs for Dravid The predicted runs for Dravid for combinations of batting time and balls faced is included below. The predicted runs for Dravid after facing 135 deliveries in 110 minutes is 44.
  Further analysis While the ‘prediction plane’ was useful, it somehow does not give a clear picture of how effective each batsman is. Clearly the 3D plots show at least 3 clusters for each batsman. For all batsmen, the clustering is densest near the origin, become less dense towards the middle and sparse on the other end. This is an indication during which session during their innings the batsman is most prone to get out. So I decided to perform K-Means clustering on the data for the 3 batsman. This gives the 3 general tendencies for each batsman. The output is included below
K-Means for Virat The K-Means for Virat Kohli indicate the follow
Centroids found 255.000000 104.478261 19.900000
Centroids found 194.000000 80.000000 15.650000
Centroids found 103.000000 38.739130 7.000000
Analysis of Virat Kohli’s batting tendency
Kohli has a 45.098 percent tendency to bat for 104 minutes, face 80 balls and score 38 runs
Kohli has a 39.216 percent tendency to bat for 19 minutes, face 15 balls and score 7 runs
Kohli has a 15.686 percent tendency to bat for 255 minutes, face 194 balls and score 103 runs
The computation of this included in the diagram below

K-means for Sachin Tendulkar
The K-Means for Sachin Tendulkar indicate the following
Centroids found 166.132530 353.092593 43.748691
Centroids found 121.421687 250.666667 30.486911
Centroids found 65.180723 138.740741 15.748691
Analysis of Sachin Tendulkar’s performance
Tendulkar has a 58.232 percent tendency to bat for 43 minutes, face 30 balls and score 15 runs
Tendulkar has a 25.305 percent tendency to bat for 166 minutes, face 121 balls and score 65 runs
Tendulkar has a 16.463 percent tendency to bat for 353 minutes, face 250 balls and score 138 runs
 K-Means for Rahul Dravid
Centroids found 191.836364 409.000000 50.506024
Centroids found 137.381818 290.692308 34.493976
Centroids found 56.945455 131.500000 13.445783
Analysis of Rahul Dravid’s performance
Dravid has a 50.610 percent tendency to bat for 50 minutes, face 34 balls and score 13 runs
Dravid has a 33.537 percent tendency to bat for 191 minutes, face 137 balls and score 56 runs
Dravid has a 15.854 percent tendency to bat for 409 minutes, face 290 balls and score 131 runs
 Some implementation details The entire analysis and coding was done with Octave 3.2.4. I have included the outline of the code for performing the multivariate regression. In essence the pseudo code for this
- Read the batsman data (Minutes, balls faced versus Runs scored)
- Calculate the cost
- Perform Gradient descent
The cost was plotted against the number of iterations to ensure convergence while performing gradient descent  Plot the 3-D plane that best fits the data
The outline of this code, data used and the output obtained can be accessed at GitHub at ml-cricket-analysis
Conclusion: Comparing the results from the K-Means Tendulkar has around 48% to make a score greater than 60
Tendulkar has a 25.305 percent tendency to bat for 166 minutes, face 121 balls and score 65 runs
Tendulkar has a 16.463 percent tendency to bat for 353 minutes, face 250 balls and score 138 runs
And Dravid has a similar 48% tendency to score greater than 56 runs
Dravid has a 33.537 percent tendency to bat for 191 minutes, face 137 balls and score 56 runs
Dravid has a 15.854 percent tendency to bat for 409 minutes, face 290 balls and score 131 runs
Kohli has around 45% to score greater than 38 runs
Kohli has a 45.098 percent tendency to bat for 104 minutes, face 80 balls and score 38 runs
Also Kohli has a lesser percentage to score lower runs as against the other two
Kohli has a 39.216 percent tendency to bat for 19 minutes, face 15 balls and score 7 runs
The results must be looked in proper perspective as Kohli is just starting his career while the other 2 are veterans. Kohli has a long way to go and I am certain that he will blaze a trail of glory in the years to come!
Watch this space!
Also see
1. My book ‘Practical Machine Learning with R and Python’ on Amazon
2.Introducing cricketr! : An R package to analyze performances of cricketers
3.Informed choices with Machine Learning 2 – Pitting together Kumble, Kapil and Chandra
4. Analyzing cricket’s batting legends – Through the mirage with R
5. What’s up Watson? Using IBM Watson’s QAAPI with Bluemix, NodeExpress – Part 1
6. Bend it like Bluemix, MongoDB with autoscaling – Part 1


Dang TV utterly fascinating to put to use something that you just learned. Very impressive. I’d love to see the same schema applied to say
manufacturing jobs across say TN, Maharashtra and Gujarat (tons of raw data available from Economic survey (NSSO and other sources) – happy to share sources and some reading 🙂
human development index, girl child or infant mortality rates across the same three states
Keep ’em coming!
LikeLiked by 1 person
SK,
Do point me to the sources. There is a lot that can be done. I am trying to work my way through, Would love to do the analysis on the topics you mention.
TV Ganesh
LikeLike
Ganesh, will send you some links. Switching to email.
LikeLike
Resp Sir, I’m a cric enthu and computer science student .Planning to implement similar project for my seminar.Can u please mail me some details regarding the language used,algo used on abhimsdadi@gmail.com. Thanking you
LikeLike
The language used is Octave. The link to the code for this post is included. Please check the link in Github provided in post.
LikeLike
Bravo, Tinniam! I too, just completed Professor Andrew Ng’s Machine Learning class. My only regret is that I did not take this course sooner. Carry on.
LikeLike
Great article written by the author. The author knows his audience very well, it shows the hardwork and dedication by the author. Hats off
LikeLike