Published in R-bloggers: Literacy in India – A deepR dive
You can do magic!
You can have anything,
That you desire
Magic…
You can do magic – song by America (1982)
That is exactly how I feel when I write code in R. A few lines of R, lo behold, hundreds of rows and columns are magically transformed into easily understandable graphs, regression curves or choropleth maps. (By the way, the song is a really cool! Listen to it if you have not heard it before). You really can do magic with R
In this post I do a deep dive into literacy in India The dataset is taken from Open Government Data (OGD) platform India was used for this purpose. This data is based on the 2001 census. Though the data is a little dated, it is extremely rich with literacy details across different age groups, and over all Indian States. The data includes the total number of persons/males/females who are in the primary, middle.matric, college,technical diploma, non-technical diploma and so on. In fact the data also includes the educational background of people in the districts in each state. I slice and dice the data across multiple parameters. I have created an interactive Shiny App which will provide very detailed visualization based on the parameters chosen
Do try out my interactive Shiny app : IndiaLiteracy
The entire code for this app is on GitHub. Feel free to download/clone/fork/modify or enhance the code – IndiaLiteracy
For analyzing such a rich data set as the Census data of 2001, I create 4 tabs
1) State Literacy
2) Educational Levels vs Age
3) India Literacy and
4) District Literacy
Here are the details of these 4 tabs in my Shiny app
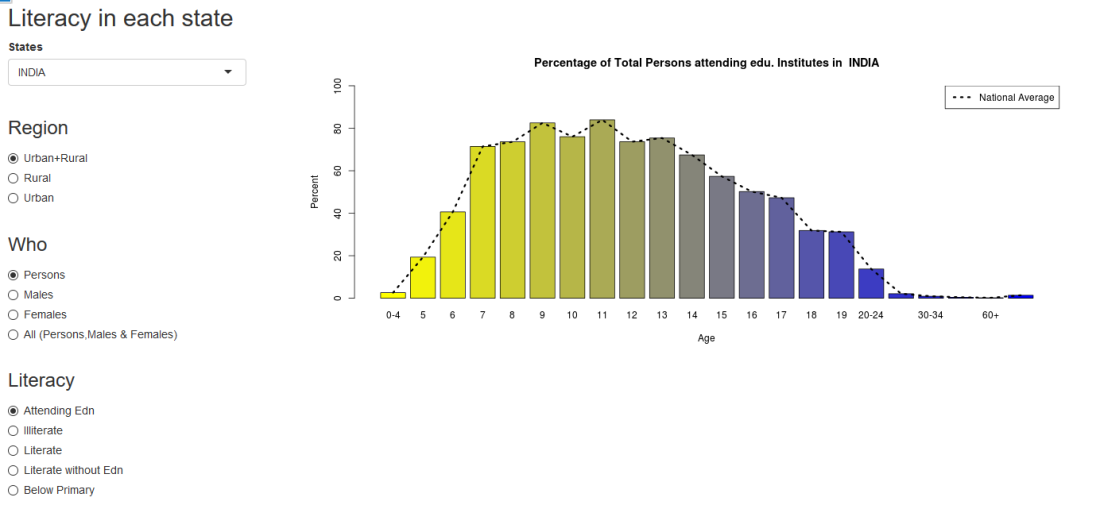
A) State Literacy
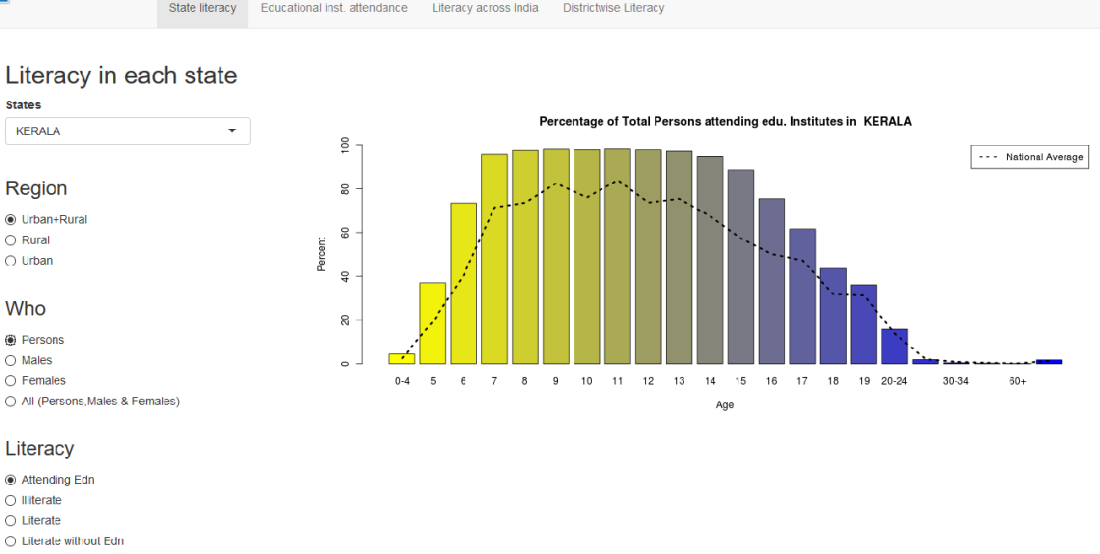
This tab provides the age wise distribution of people (Persons/Males/Females) who attend educational institutions. This is shown as a barplot. The plot also includes the national average. In the plot below which is for entire India we see that the national average
The distribution of females attending primary school in the state of Haryana is shown. Also included is the national average. As can be seen there are options for (Total/Urban/Rural) against (Persons/Males/Females) and whether these people attend educational institutions are illiterate of literate.

I also have another option under “Who’ which is “All” This will plot the age wise distribution of males/females/persons in urban/rural or entire state.
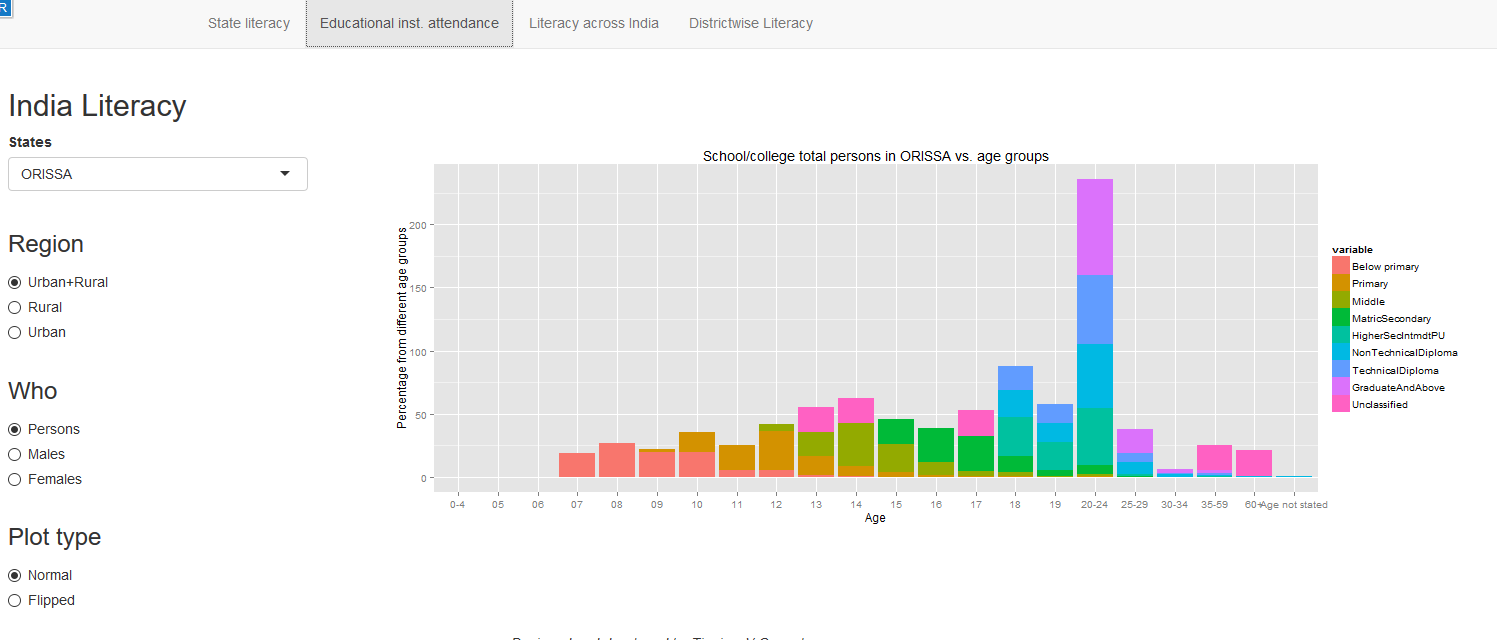
B. Educational Institutions vs Age plot
This plot displays the the educational institutions attended by people in a particular age group. So for example in the state of Orissa for the 18 year age group we can see that there persons who are in (Primary, Matric, Higher Secondary, Non-Technical Diploma and Technical Diploma). The bar length for each color is the percentage of the total persons at that level of education
C. Literacy across India
This tab plots a chorpleth map for a region(Urban+Rural, Urban, Rural), Who(Persons, Males, Females) and the literacy level (attending educational institutions, primary, higher secondary, Matric etc) across the whole of India.

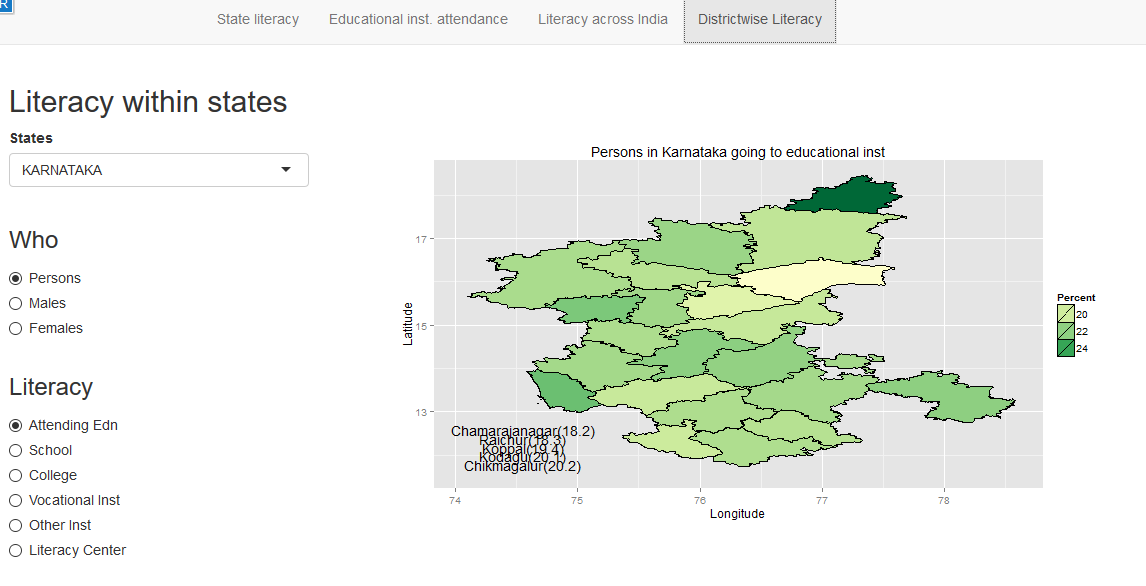
D. Literacy within a state
This tab plots a chorpleth map of literacy in the districts of a state. A sample plot for Karnataka is shown below
E. Key observations
There is a wealth of insights you can glean by looking at the various charts. Here a few insights from my initial observations
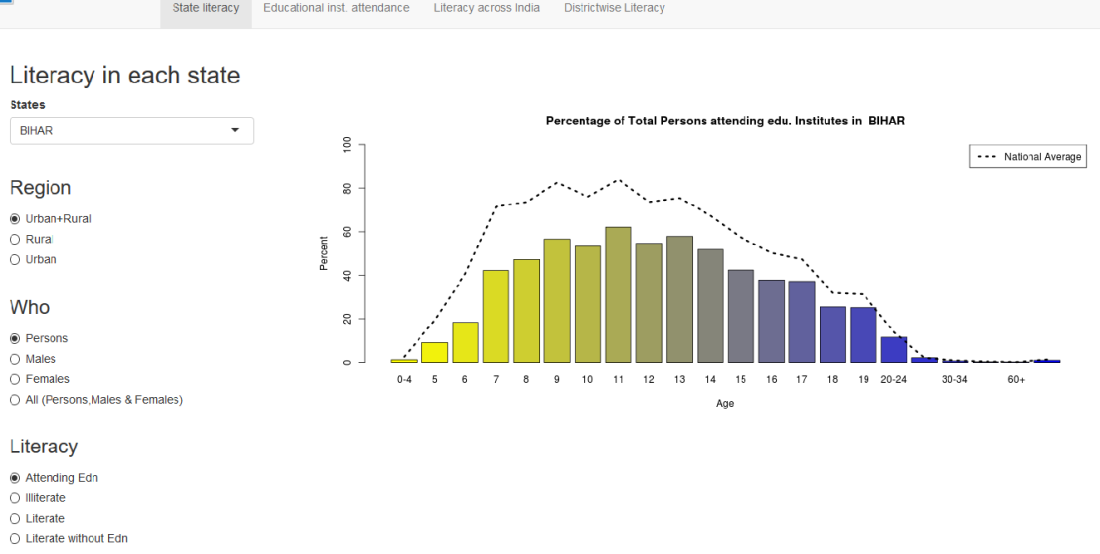
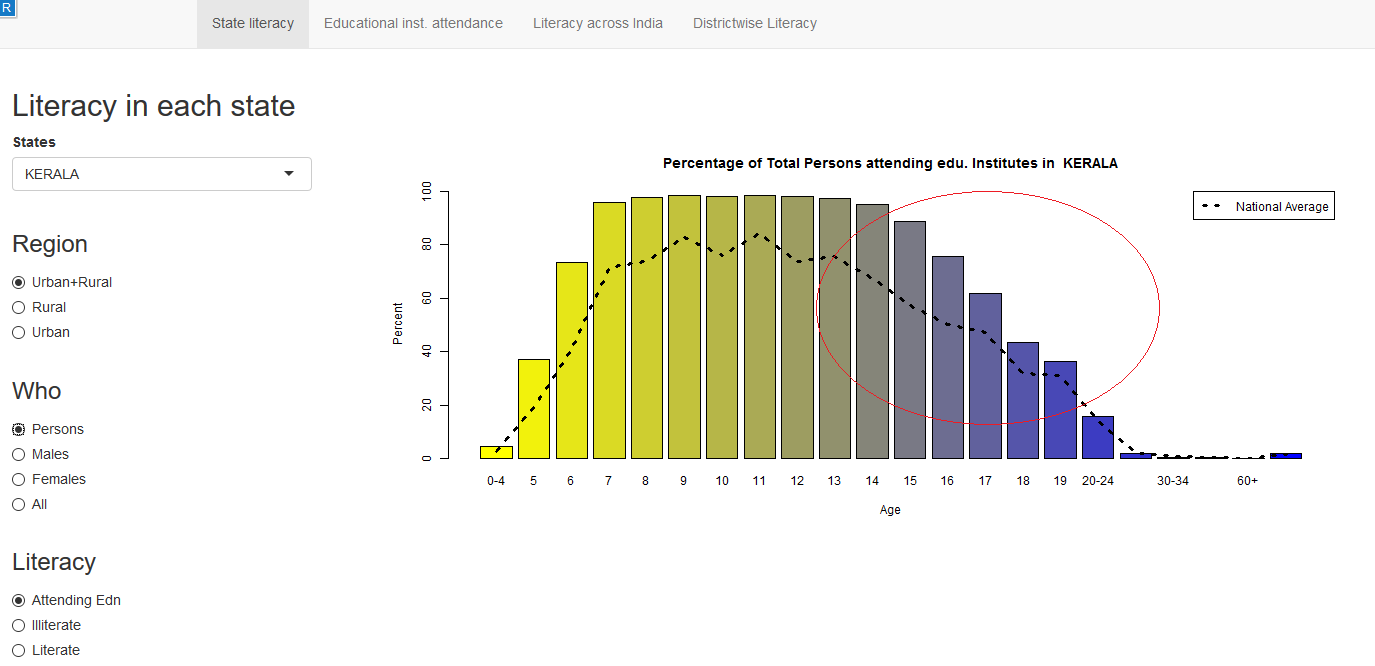
1) The literacy in Kerala across ages is higher than the national average while in Bihar it is less than the national average
a) Kerala
 b) Bihar
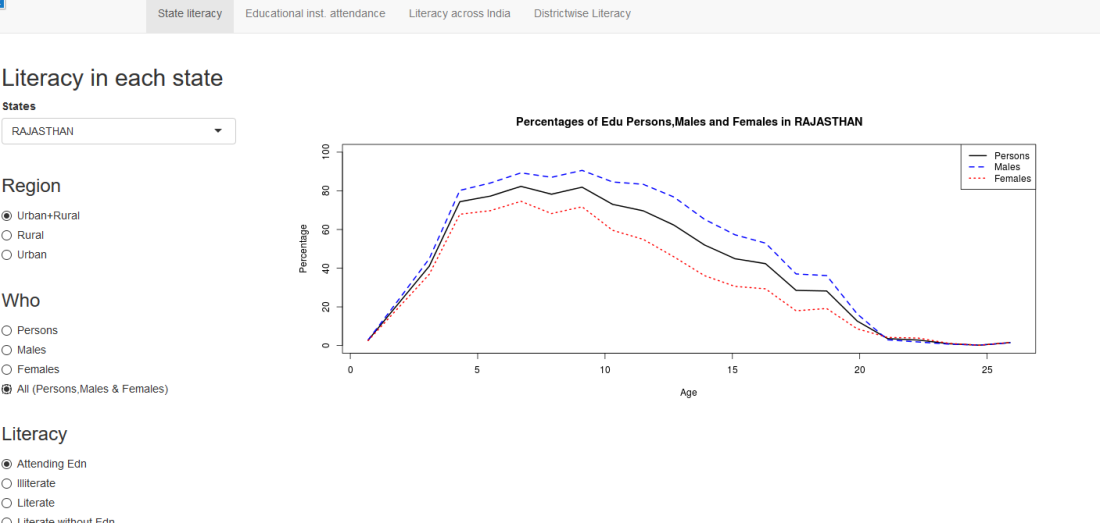
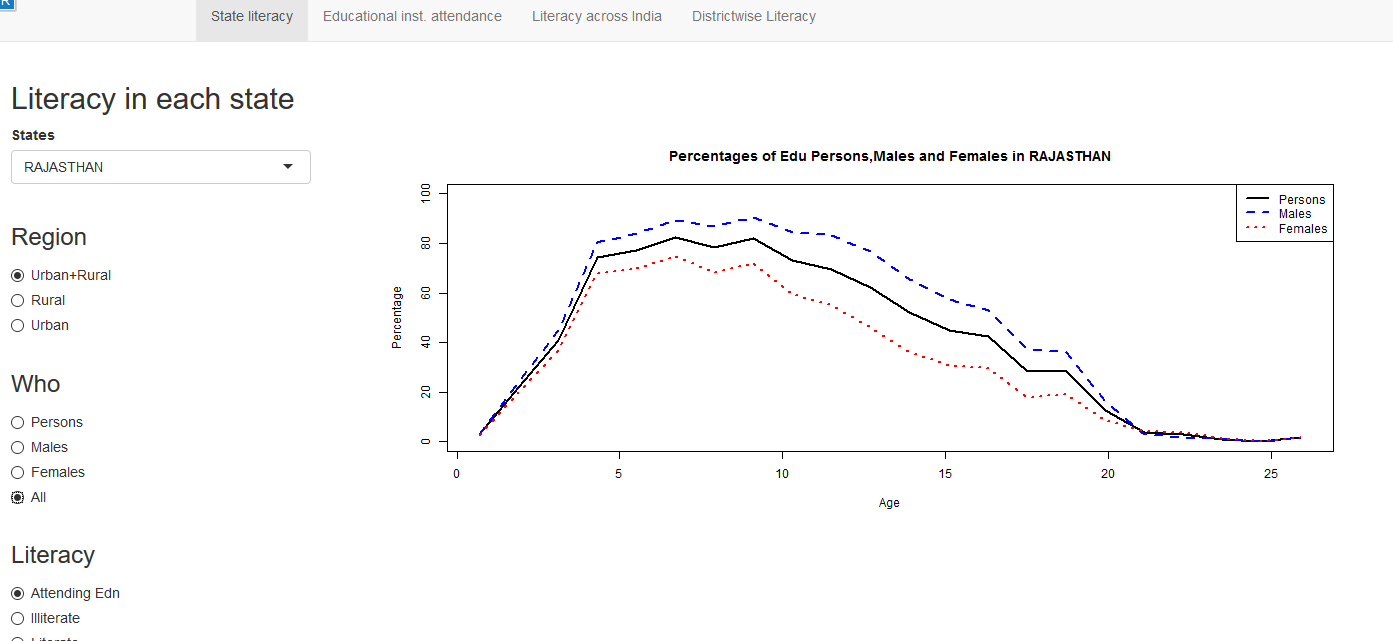
2) In Rajasthan The Males Attending education instituions is higher than the national average while for females it less than the national average. However the situation is reverse in Chandigarh where there are the percentage of females attending education instiuons is higher than the national average and the males
a) Rajasthan
 b) Chandigarh

3) When we look at the number of persons attending educational institution across India the north-eastern states lead with Manipur, Nagaland and Sikkim in the top 3.
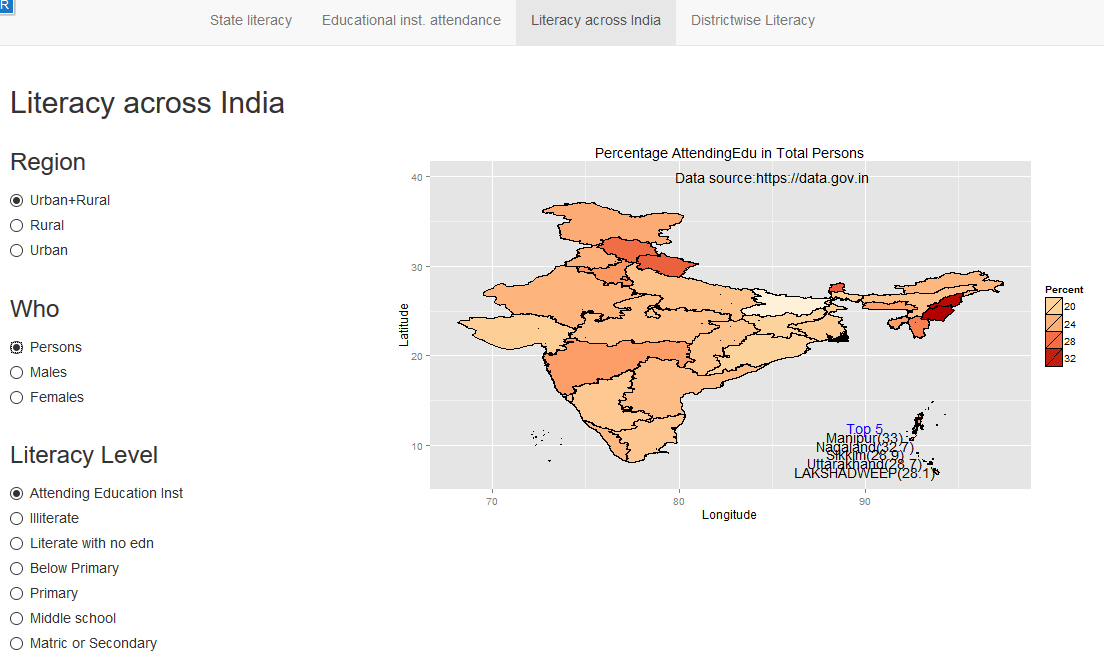
We have heard that Kerala is the most literate state. But it looks like Manipur, Nagaland, Sikkim actually edge Kerala out. If we look at the State literacy chart for Kerala and Manipur this becomes more clear
a) Kerala
b) Manipur
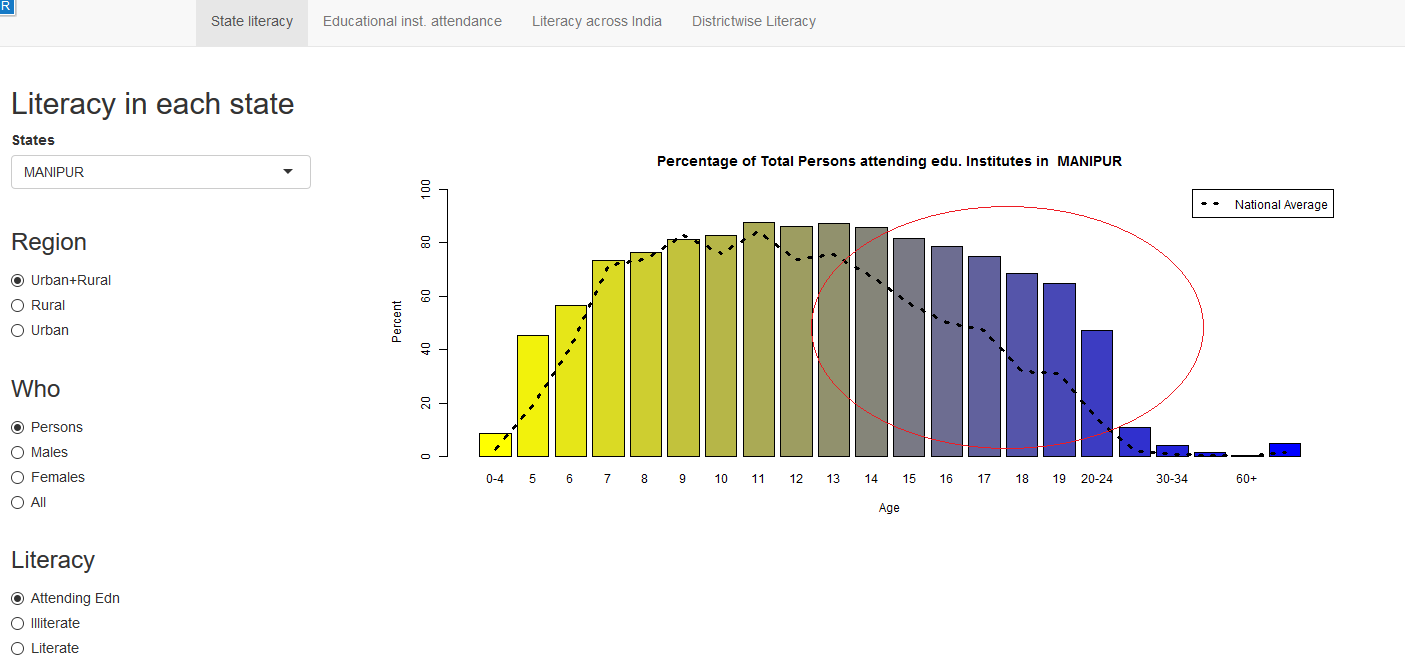
It can be seen that in Manipur the number of persons attending educational instition in the age range 13-24 years it is much higher than the national average and much higher than Kerala
4) If we take a look at the District wise literacy for the state of Bihar we see that the literacy is lower in the north eastern districts.,

5) Here is another interesting observation I made. The top 3 states which are most ‘literate with no education’ are i) Rajasthan ii) Madhya Pradesh iii) Chhattisgarh

While I have included several charts with accompanying explanation, this is largely unnecessary as most of the charts are self-explanatory.
Do try out the Shiny app and see for yourself the literacy in each state/district/age group educational level etc –IndiaLiteracy
Feel free to clone/fork my code and make your own enhancements –IndiaLiteracy
You may also like
1. Natural Language Processing: What would Shakespeare say?
2. Introducing cricketr! : An R package to analyze performances of cricketers
3. Revisiting crimes against women in India
4. Informed choices through Machine Learning : Analyzing Kohli, Tendulkar and Dravid
5. Re-working the Lucy-Richardson Algorithm in OpenCV
6. What’s up Watson? Using IBM Watson’s QAAPI with Bluemix, NodeExpress – Part 1
7. Bend it like Bluemix, MongoDB with autoscaling – Part 2
8. TWS-4: Gossip protocol: Epidemics and rumors to the rescue
9. Thinking Web Scale (TWS-3): Map-Reduce – Bring compute to data
10. Simulating an Edge Shape in Android


Hi! I was wondering if you have access to the 1991 Census data. I needed it for some research that i am doing on India. Thanks!
LikeLike
Take a look at data.gov.in or in http://censusindia.gov.in/2011-common/censusdataonline.html
LikeLike
I get a mapproj package is unavailable when I click on the Literacy across India OR the districtwise tab. Since this is a shiny viz, should I have to install the package on the local machine?
LikeLike
@Aakash – Thanks for pointing this out. This used to work. I think the mapproj R package has changed and I will have to build again. You will not have to install as Shiny is self contained. It may take me a few weeks before I get to fix. Check back after a while.
LikeLike
@Aakash – I have fixed this. Give it a try now. – Ganesh
LikeLike