In this post I make my first foray into data mining using the R language. As a start, I picked up the data from the Open Government Data (OGD Platform of India from the Ministry of Human Resources. There are many data sets under Education. To get started I picked the data set on Tamil Nadu which deals with the population attending educational institutions by age, sex and institution type. Similar data is available for all states.
I wanted to start off on a small scale, primarily to checkout some of the features of the R language. R is clearly the language of choice for processing large amounts of data. R has close to 4000+ packages that can do various things like statistical, regression analysis etc. However I found this is no easy task. There are a zillion ways in which you can take cross-sections of a large dataset. Some of them will provide useful insights while others will lead you nowhere.
Also see my post Literacy in India – A deepR dive!
Data science, which is predicted to be the technology of the future based on with the mountains of data being generated daily, will in my opinion, will be more of an art and less of a science. There will be wizards who will be able to spot remarkable truths in the mundane data while others will not be that successful.
Anyway back to my attempt to divine intelligence in the Tamil Nadu(TN) literacy data. The data downloaded was an Excel sheet with 1767 rows and 28 columns. The first 60 rows deal with the overall statistics of literacy in Tamil Nadu state as a whole. Further below are the statistics on the individual districts of Tamil nadu.
Each of this is further divided into urban and rural parts. The data covers persons from the age of 4 upto the age of 60 and whether they attended school, college, vocational institute etc. To make my initial attempt manageable I have just focused on the data for Tamil Nadu state as a whole including the breakup of the urban and rural data.
My analysis is included below. The code and the dataset for this implementation is in R language and can be cloned from GitHub at tamilnadu-literacy-analysis
Analysis of Tamil Nadu (total)
The total population of Tamil Nadu based on an age breakup is shown below
1) Total population Tamil Nadu

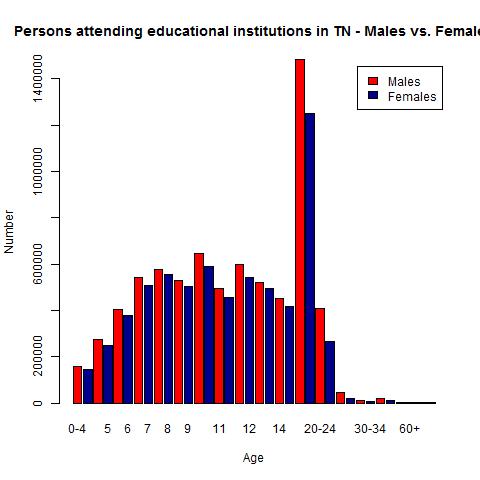
2) Males & Females attending education institutions in TN
 There are marginally more males attending educational institutions. Also the number of persons attending educational institutions seems to drop from 11 years of age. There is a spike around 20-24 years and people go to school and college at this age. See pie chart 8) below
3) Percentage of males attending educational institution of the total males
4) Percentage females attending educational institutions in TN
There is a very similar trend between males and females. The attendance peaks between 9 – 11 years of age and then falls to roughly 50% around 15-19 years and rapidly falls off
5) Boys and girls attending school in TN
For some reason there is a marked increase for boys and girls around 20-24. Possibly people repeat classes around this age
6) Persons attending college in TN
7) Educational institutions attended by persons between 15- 19 years
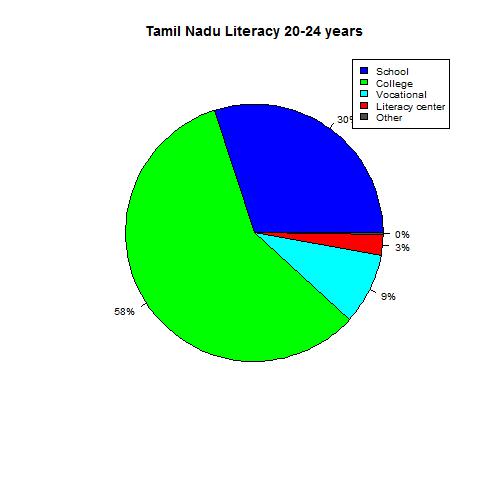
8) Educational institutions attended by persons between 20-24 
As can be seen there is a large percentage (30%) of people in the 20-24 age group who are in school. This is probably the reason for the spike in “Boys and girls attending school in TN” see 2) for the 20-24 years of age
Education in rural Tamil Nadu
1) Total rural population Tamil Nadu
2) Males & Females attending education institutions in rural TN 3) Percentage of rural males attending educational institution
4) Percentage females attending educational institutions in rural TN of total females
The persons attending education drops rapidly to 40% between 15-19 years of age for both males and females
5) Boys and girls attending school in rural TN
6) Persons attending college in rural TN
7) Educational institutions attended by persons between 15- 19 years in rural TN
8) Educational institutions attended by persons between 20-24 in rural TN
As can be seen there is a large percentage (39%) of rural people in the 20-24 age group who are in school
Education in urban Tamil Nadu
1) Total population in urban Tamil Nadu
2) Males & Females attending education institutions in urban TN 3) Percentage of males attending educational institution of the total males in urban TN
 4) Percentage females attending educational institutions in urban TN
5) Boys and girls attending school in urban TN
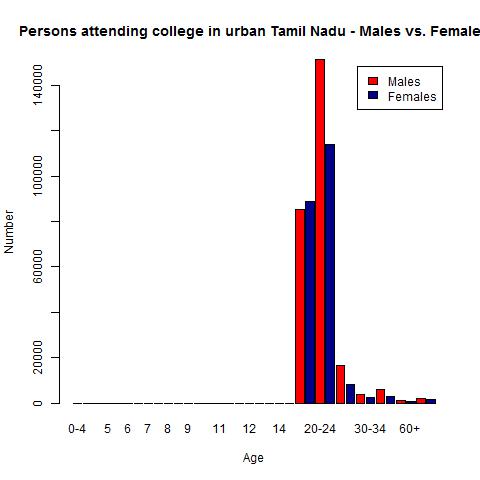
6) Persons attending college in urban TN
7) Educational institutions attended by persons between 15- 19 years in urban TN
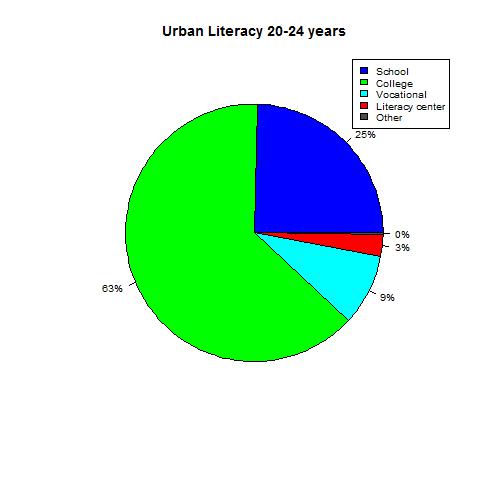
8) Educational institutions attended by persons between 20-24 in urban TN
As can be seen there is a large percentage (25%) of rural people in the 20-24 age group who are in school
The R implementation and the Tamil Nadu dataset can be cloned from my repository in GitHub at tamilnadu-literacy-analysis
The above analysis is just one of a million possible ways the data can be analyzed and visually represented. I hope to hone my skill as progress along in similar analysis.
Hasta la vista! I’ll be back.
Watch this space!


Thank you for sharing this article I will try to replicate these graphs with other states ,
LikeLike
Ankit,
Sure. Go ahead and clone the code from GitHub. Also take a look at my next article where I have done for other states though not all charts.
Please drop me a note (link) when you are done
Regards
Ganesh
LikeLike
This awesome. I will try doing this for other data sets.
LikeLike