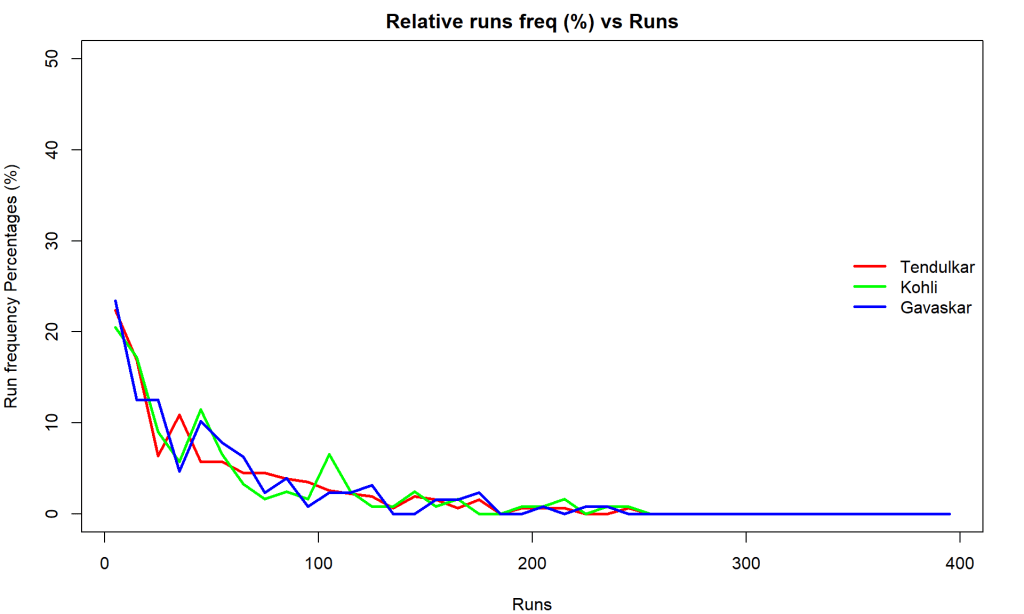
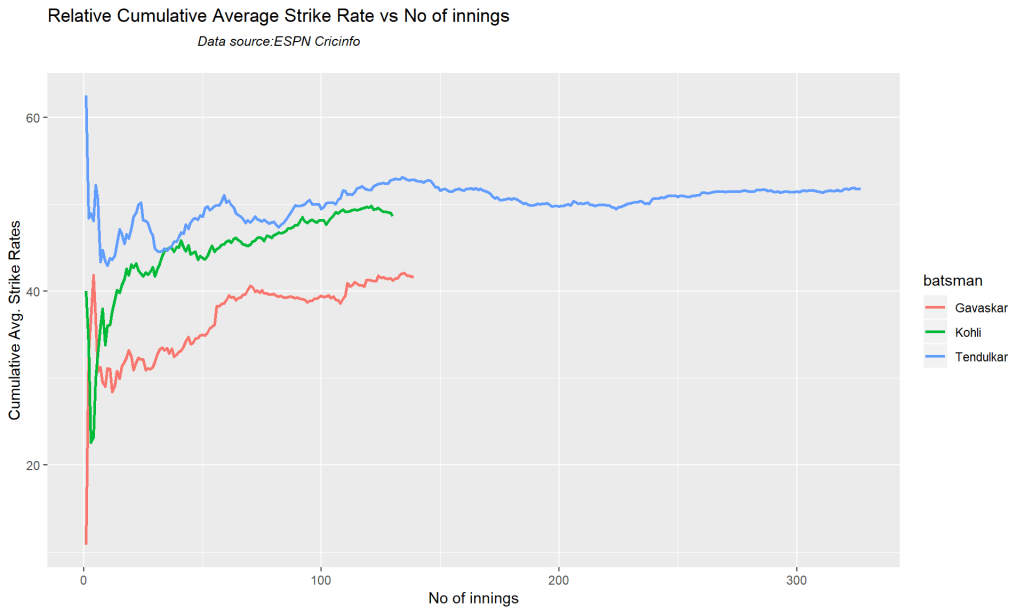
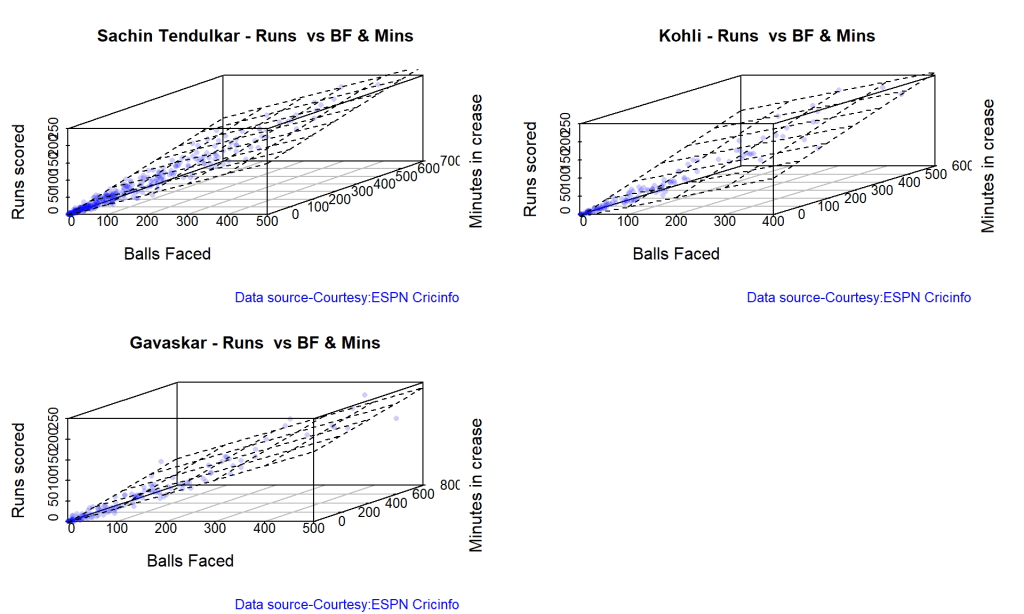
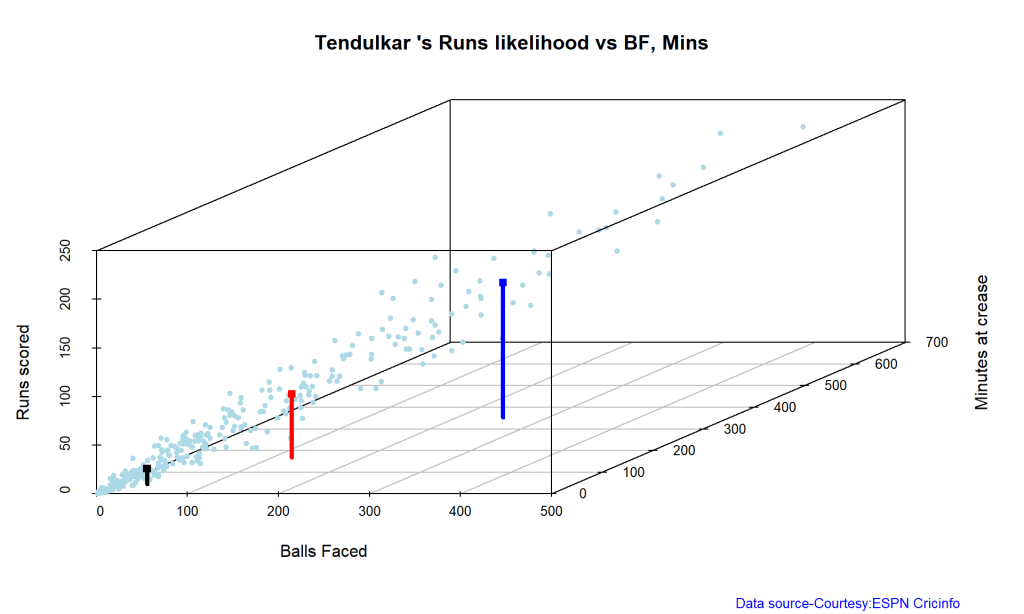
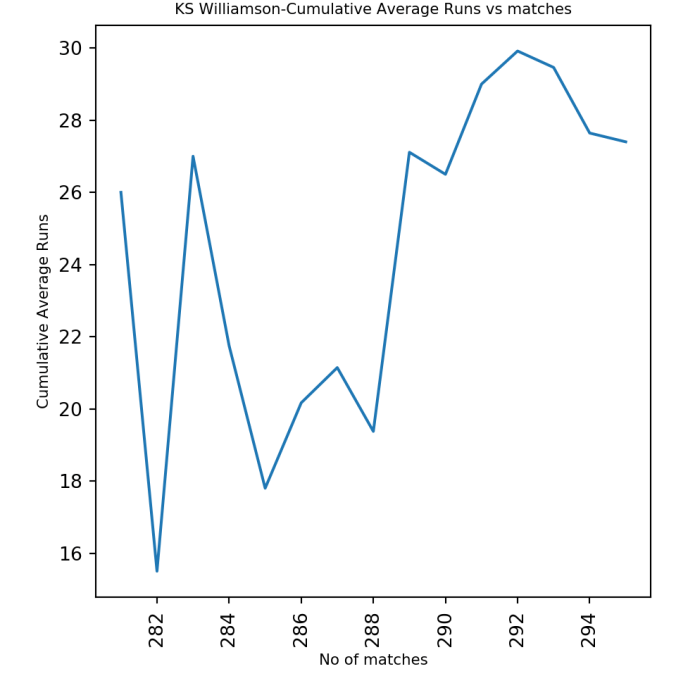
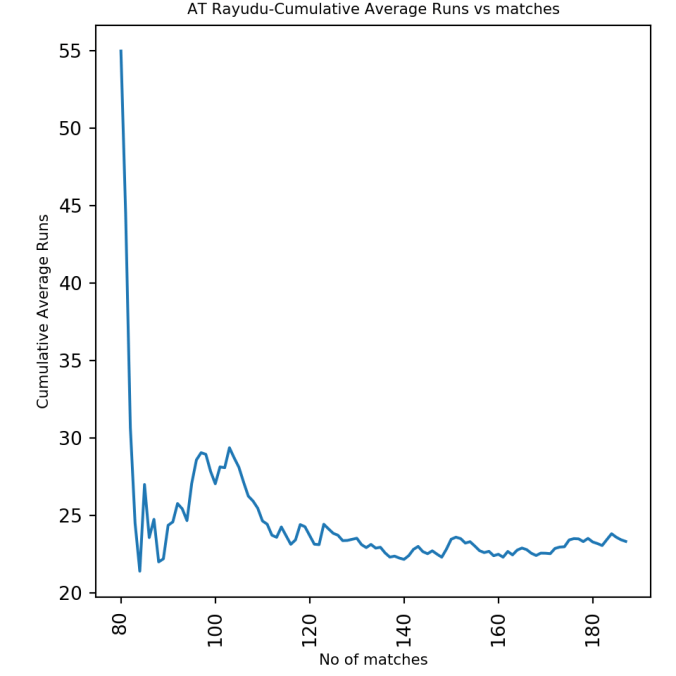
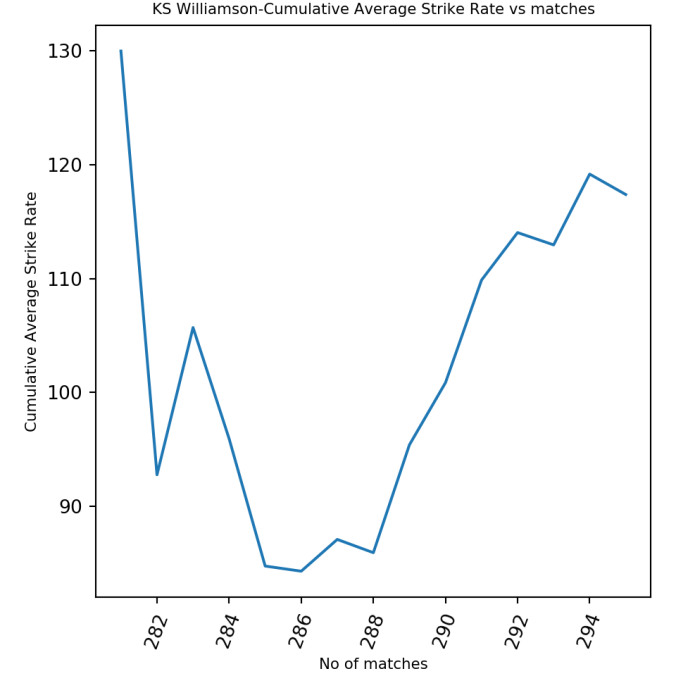
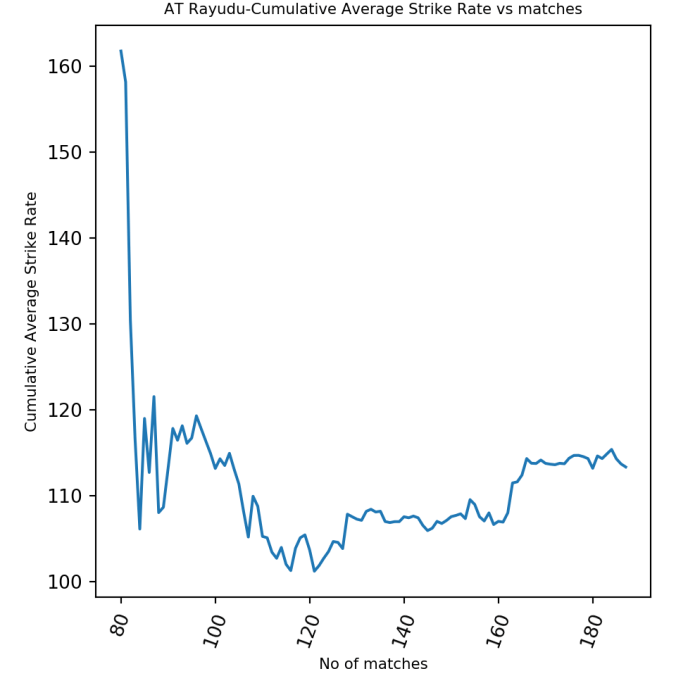
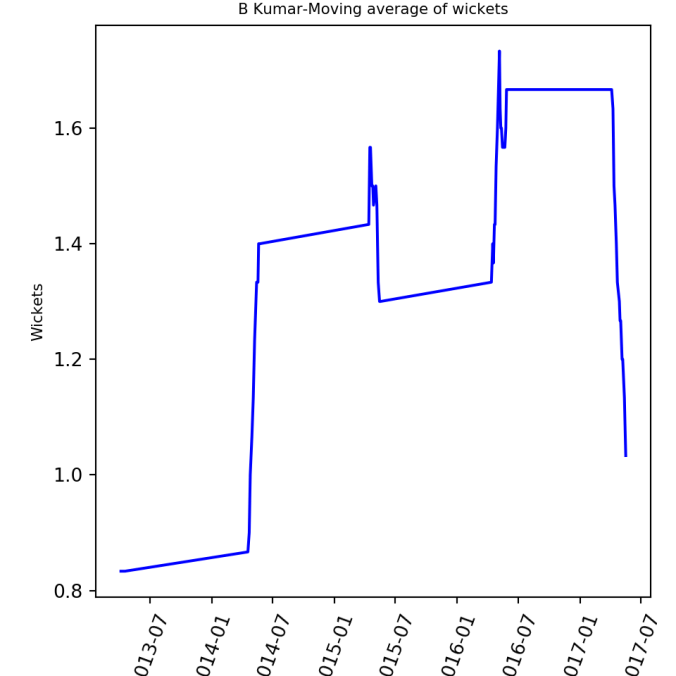
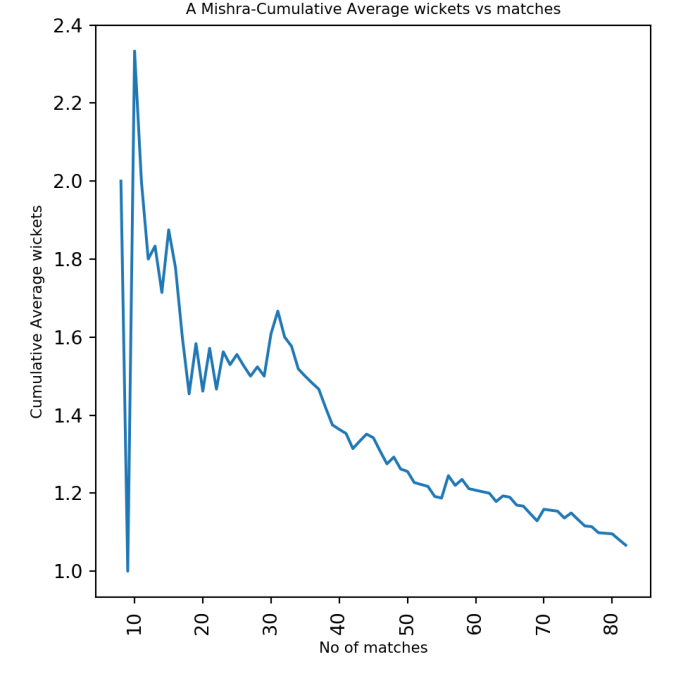
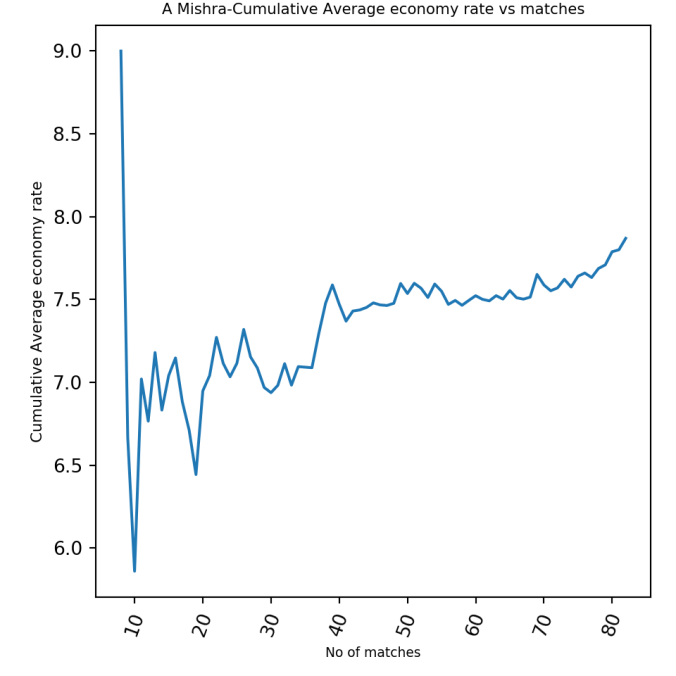
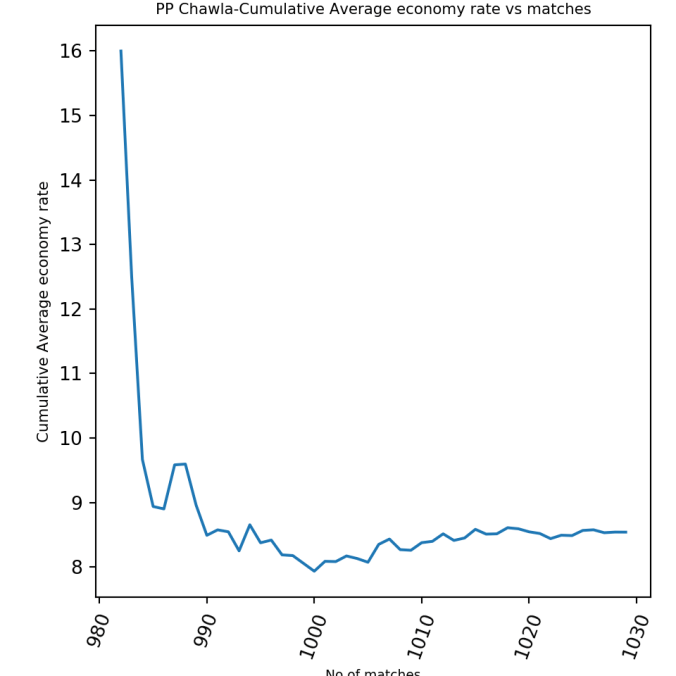
Cricketr analyzes Ind-Aus faceoff in WTC 2023!!

“The unexamined life is not worth living.” – Socrates

“There is no easy way from the earth to the stars.” – Seneca

“If you want to go fast, go alone. If you want to go far, go together.” – African Proverb

1. Introduction

In this post, I put my R package cricketr to analyze the Indian and Australia World Test Championship (WTC) final squad ahead of the World Test Championship 2023.My R package cricketr had its birth on Jul 4, 2015. Cricketr uses data from Cricinfo.

You can download the latest PDF version of the book  at  ‘Cricket analytics with cricketr and cricpy: Analytics harmony with R and Python-6th edition

Indian squad

Rohit Sharma (Captain), Shubman Gill, Cheteshwar Pujara, Virat Kohli, Ajinkya Rahane, Ravindra Jadeja, Shardul Thakur, Mohd. Shami, Mohd. Siraj, Ishan Kishan (wk).

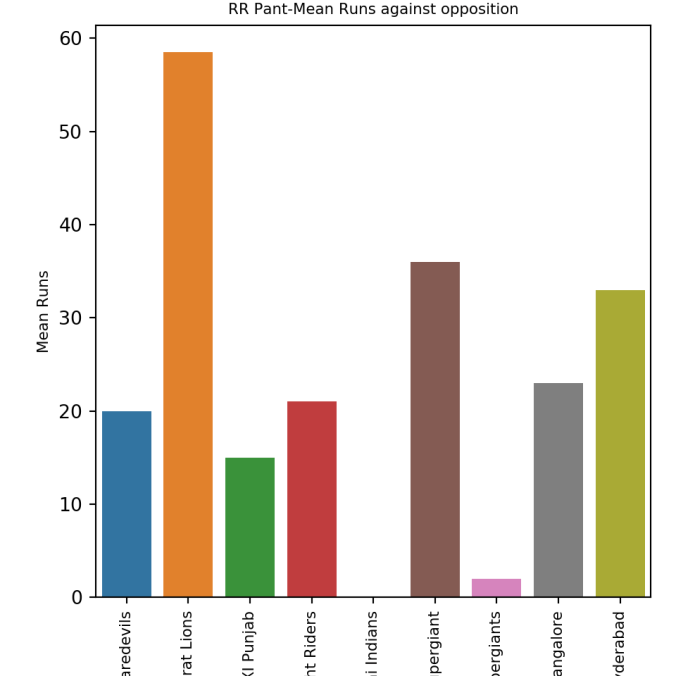
According to me, Ishan Kishan has more experience than KS Bharat, though Rishabh Pant would have been the ideal wicket keeper/left-handed batsman. I think Shardul Thakur would be handful in the English conditions. For a spinner it either Ashwin or Jadeja. Maybe the balance shifts in favor of Jadeja

Australian squad

Pat Cummins (capt), Alex Carey (wk), Cameron Green, Josh Hazlewood, Usman Khawaja, Marnus Labuschagne, Nathan Lyon, Todd Murphy, Steven Smith (vice-capt), Mitchell Starc, David Warner.

Not sure if Scott Boland would fill in, instead of Todd Murphy 1

Let me give you a lay-of-the-land (post) below

The post below is organized into the following parts

  1. Analysis of Indian WTC batsmen from Jan 2016 – May 2023
  2. Analysis of Indian WTC batsmen against Australia from Jan 2016 -May 2023
  3. Analysis of Australian WTC batsmen from Jan 2016 – May 2023
  4. Analysis of Australian WTC batsmen against India from Jan 2016 -May 2023
  5. Analysis of Indian WTC bowlers from Jan 2016 – May 2023
  6. Analysis of Indian WTC bowlers against Australia from Jan 2016 -May 2023
  7. Analysis of Australian WTC bowlers from Jan 2016 – May 2023
  8. Analysis of Australian WTC bowlers gainst India from Jan 2016 -May 2023
  9. Team analysis of India and Australia

All the above analysis use data from ESPN Statsguru and use my R pakage cricketr

The data for the different players have been obtained using calls such as the ones below.

# Get Shubman Gill's batting data
#shubman <-getPlayerData(1070173,dir=".",file="shubman.csv",type="batting",homeOrAway=c(1,2), result=c(1,2,4))
#shubmansp <- getPlayerDataSp(1070173,tdir=".",tfile="shubmansp.csv",ttype="batting")

#Get Shubman Gill's data from Jan 2016 - May 2023
#df <-getPlayerDataHA(1070173,tfile="shubman1.csv",type="batting", matchType="Test")
#df1=getPlayerDataOppnHA(infile="shubman1.csv",outfile="shubmanTestAus.csv",startDate="2016-01-01",endDate="2023-05-01")

#Get Shubman Gills data from Jan 2016 - May 2023, against Australia
#df <-getPlayerDataHA(1070173,tfile="shubman1.csv",type="batting", matchType="Test")
#df1=getPlayerDataOppnHA(infile="shubman1.csv",outfile="shubmanTestAus.csv",opposition="Australia",startDate="2016-01-01",endDate="2023-05-01")

Note: To get data for bowlers we need to use the corresponding profile no and use type =‘bowling’. Details in my posts below

To do similar analysis please go through the following posts

  1. Re-introducing cricketr! : An R package to analyze performances of cricketers
  2. Cricketr learns new tricks : Performs fine-grained analysis of players
  3. Cricketr adds team analytics to its repertoire!!!

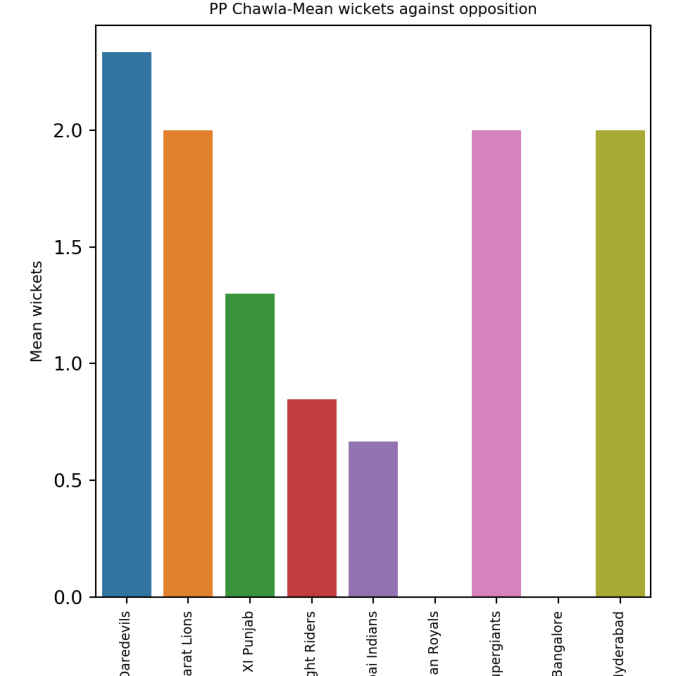
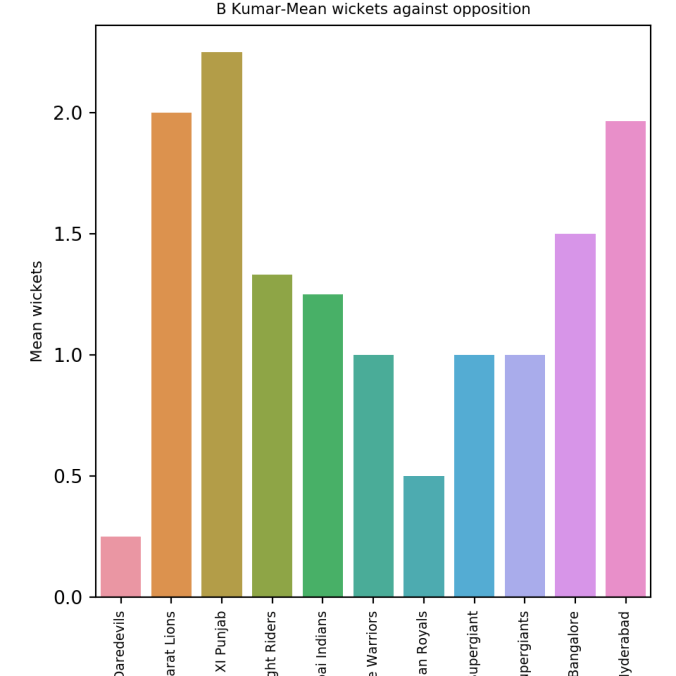
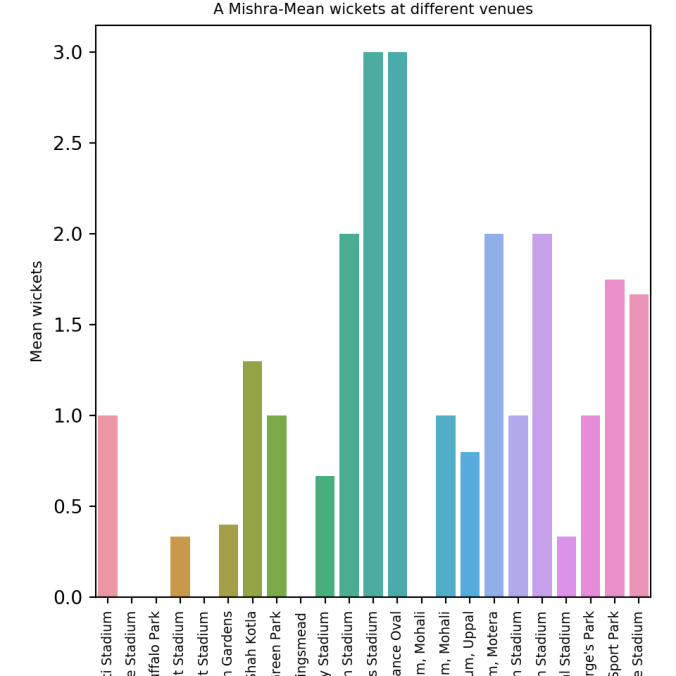
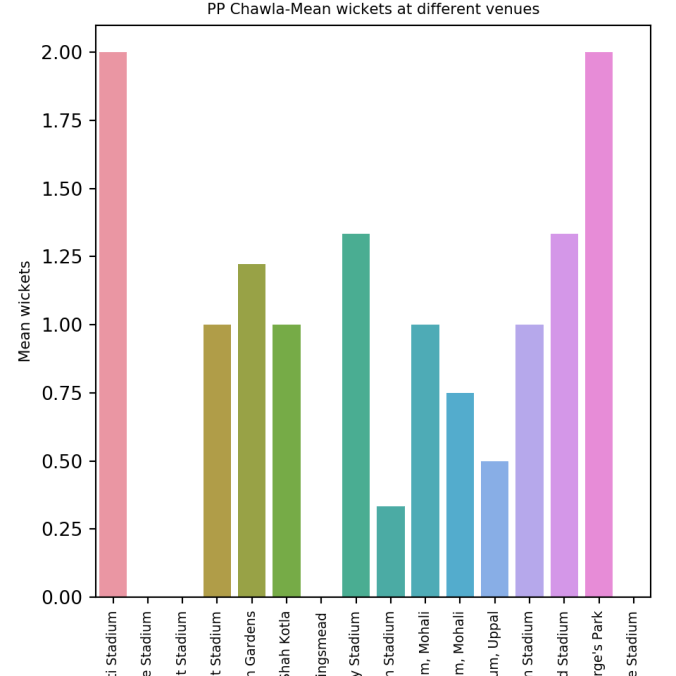
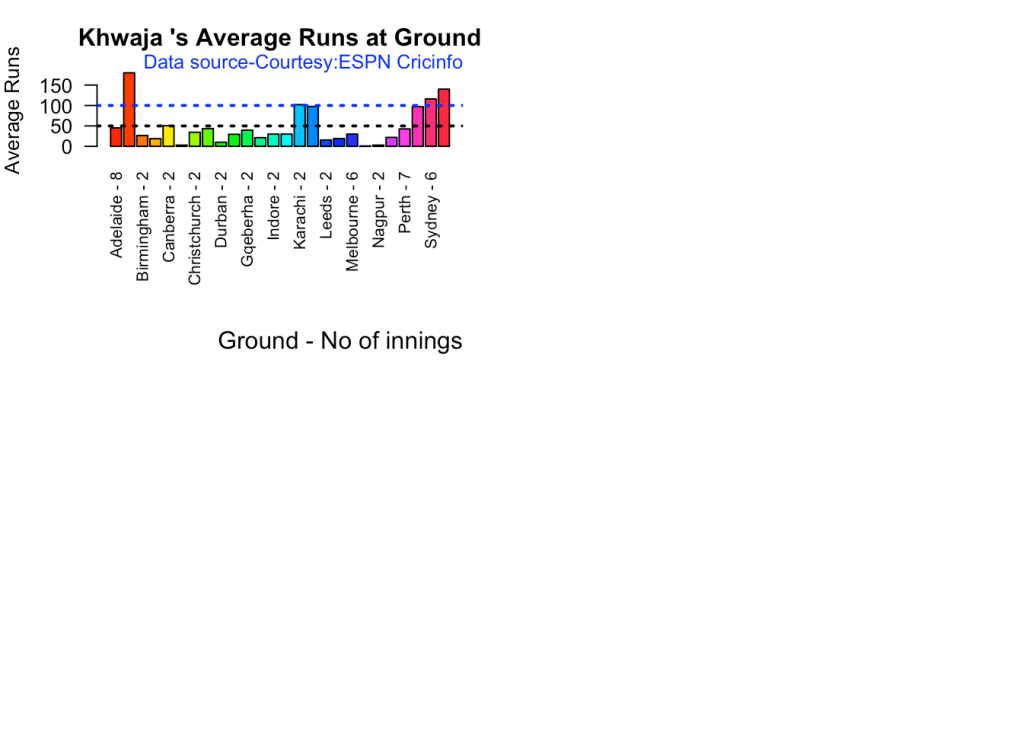
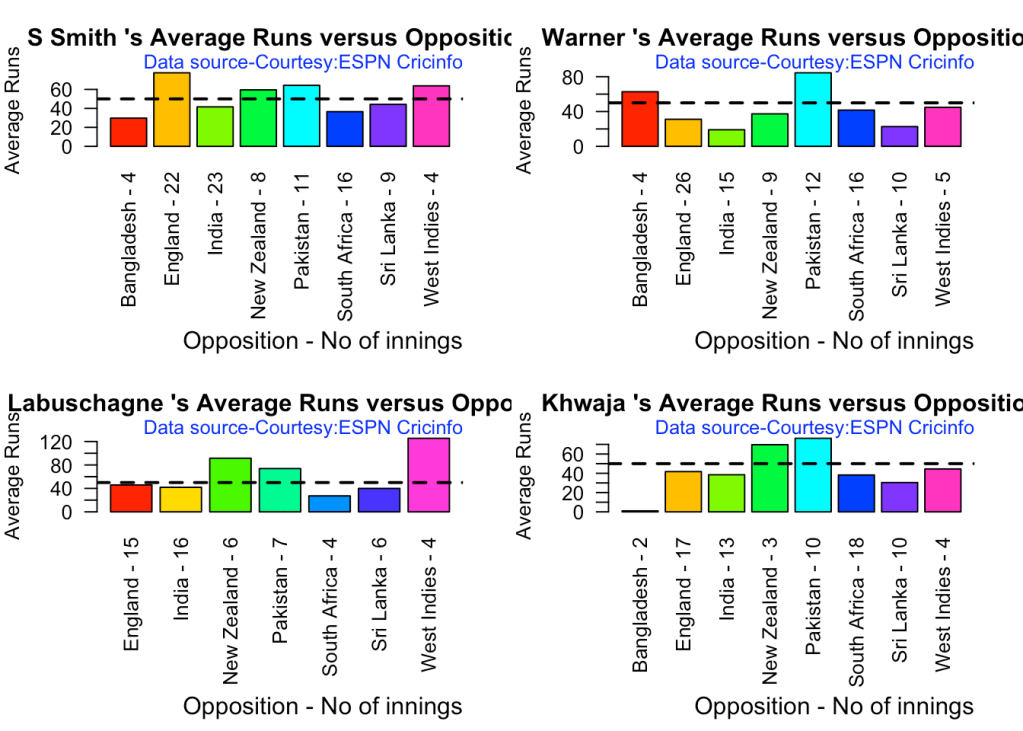
Note 1: I will not be analysing each and every chart as the charts are quite self-explanatory 

Note 2: I have had to tile charts together otherwise this will become a very, very long post. You are free to use my R package cricketr and check out for yourself ##3. Analysis of India WTC batsmen from Jan 2016 – May 2023

Findings

  1. Kohli has the best average of 48+. India has won when Rohit and Rahane played well
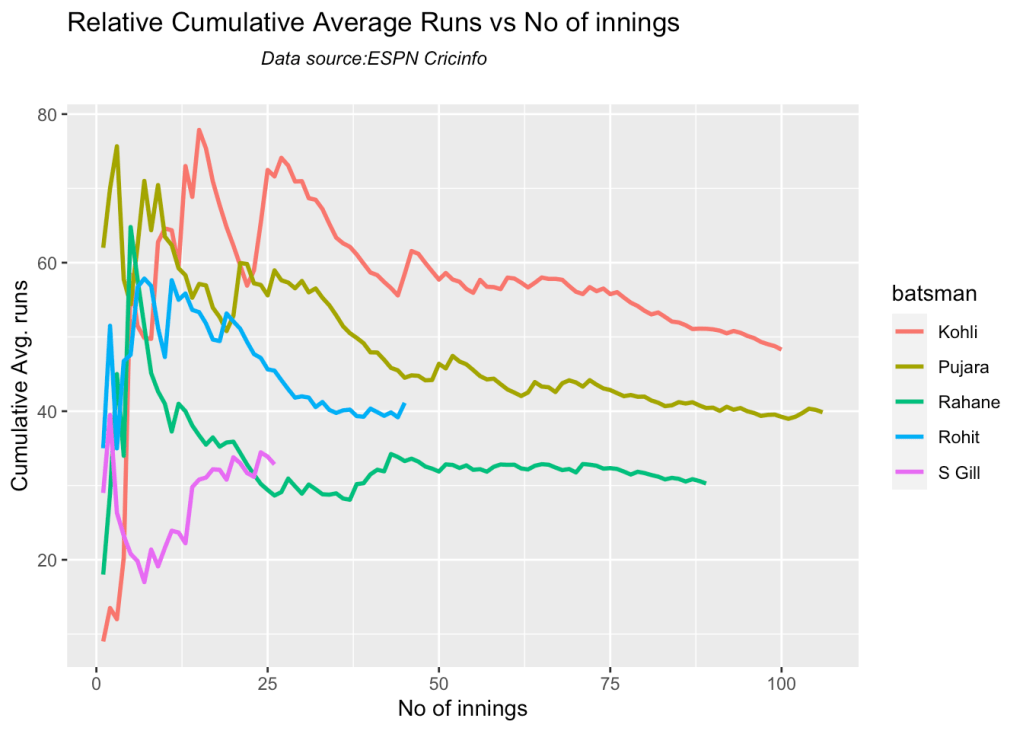
  2. Kohli’s tops the list in cumulative average runs, followed by Pujara and Rohit is 3rd. Gill is on the upswing.
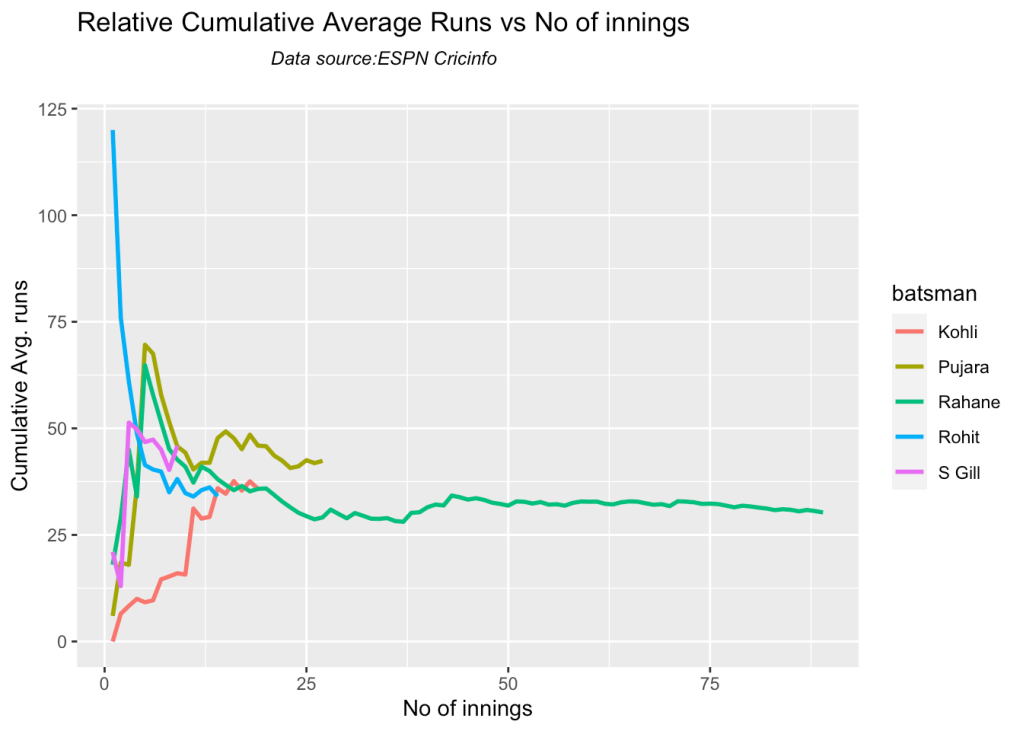
  3. Against Australia Pujara has the best cumulative average runs record followed by Rahane, with Gill in hot pursuit. In the strike rate department Gill tops followed by Rohit and Rahane
  4. Since 2016 Smith, Labuschagne has an average of 53+ since 2016!! Warner & Khwaja are at ~46
  5. Australia has won matches when Smith, Warner and Khwaja have played well.
  6. Labuschagne, Smith and C Green have good records against India. Indian bowlers will need to contain them
  7. Ashwin has the highest wickets followed by Jadeja against all teams. Ashwin’s performance has dropped over the years, while Siraj has been becoming better
  8. Jadeja has the best economy rate followed by Ashwin
  9. Against Australia specifically Jadeja has the best record followed by Ashwin. Jadeja has the best economy against Australia, followed by Siraj, then Ashwin
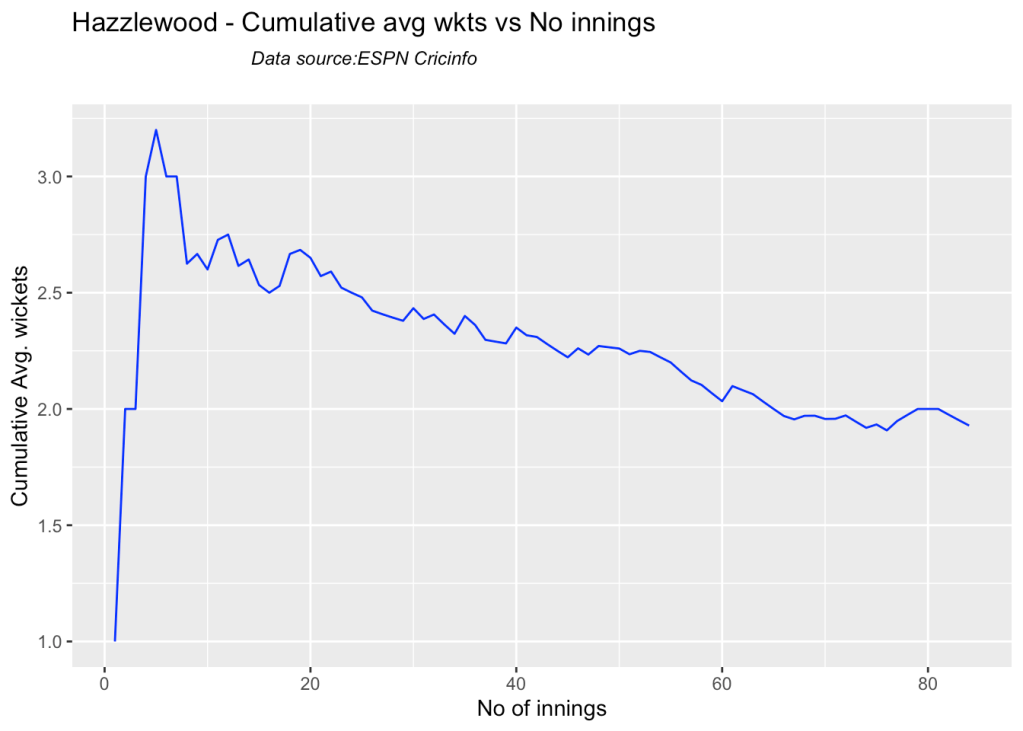
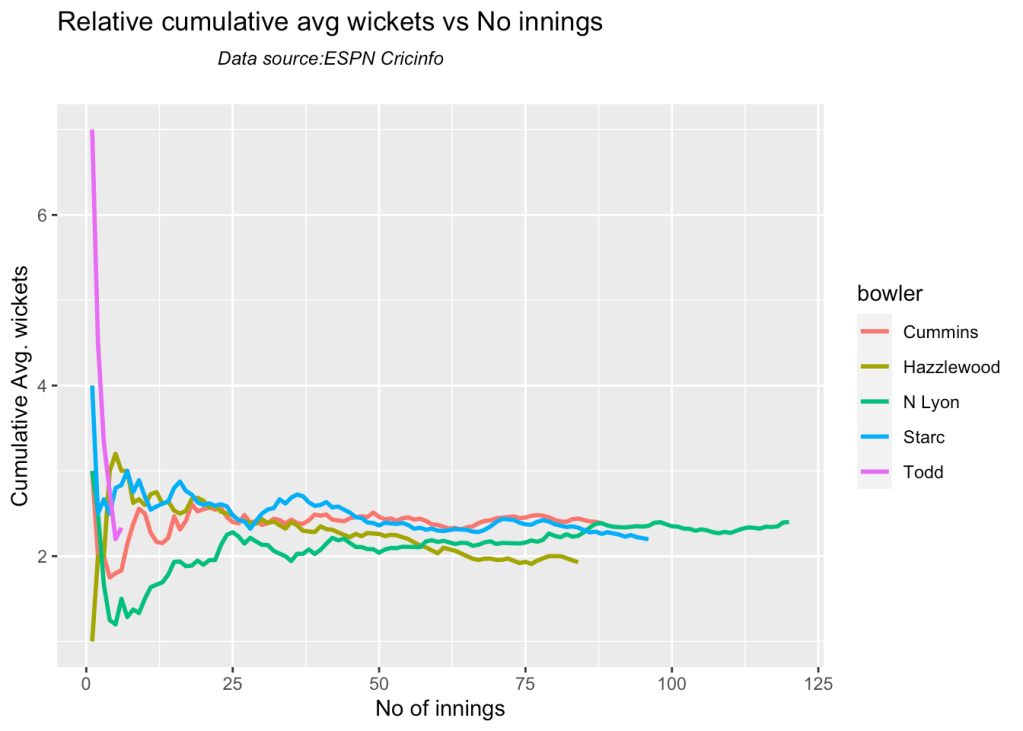
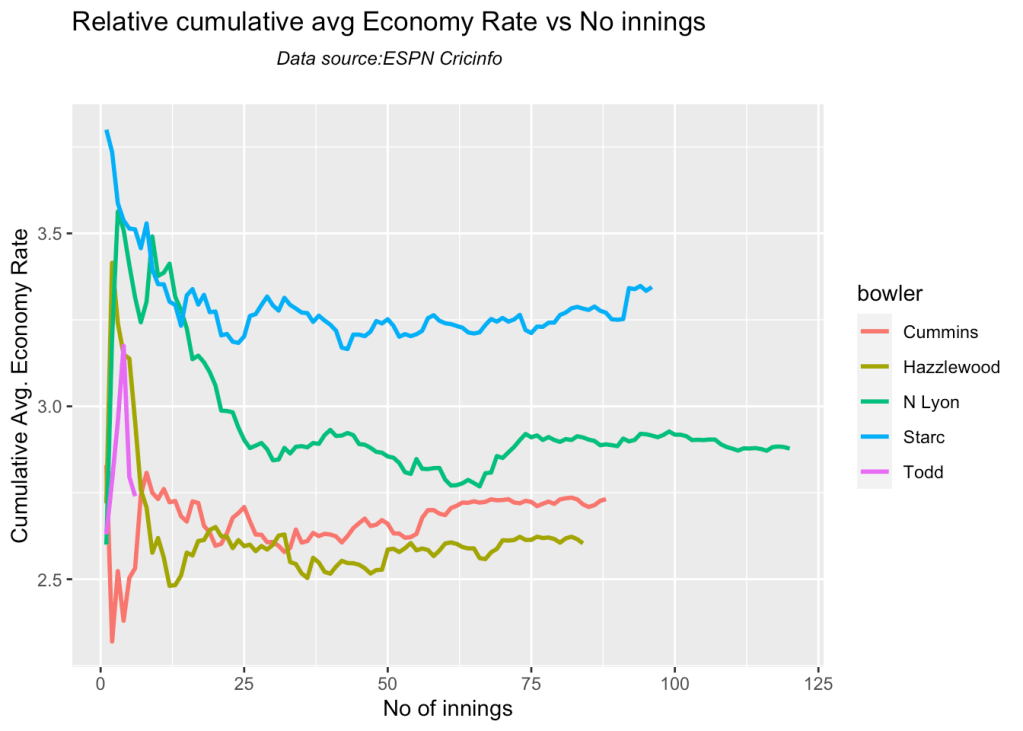
  10. Cummins, Starc and Lyons are the best performers for Australia. Hazzlewood, Cummins have the best economy against all opposition
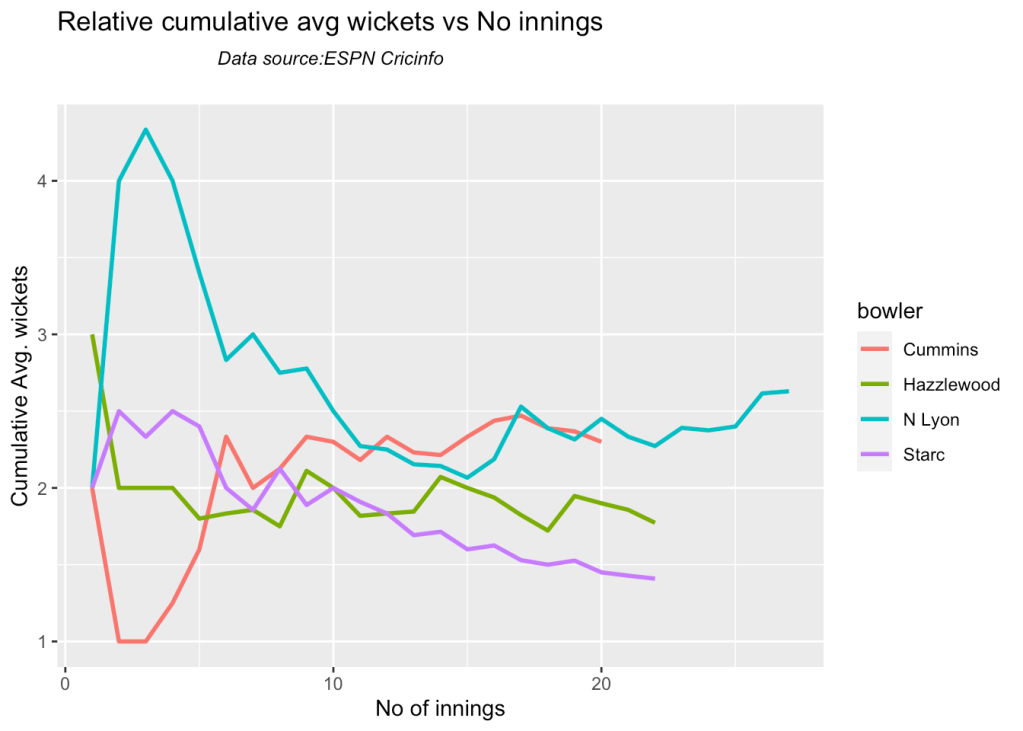
  11. Against India Lyon, Cummins and Hazzlewood have performed well
  12. Hazzlewood, Lyon have a good economy rate against India
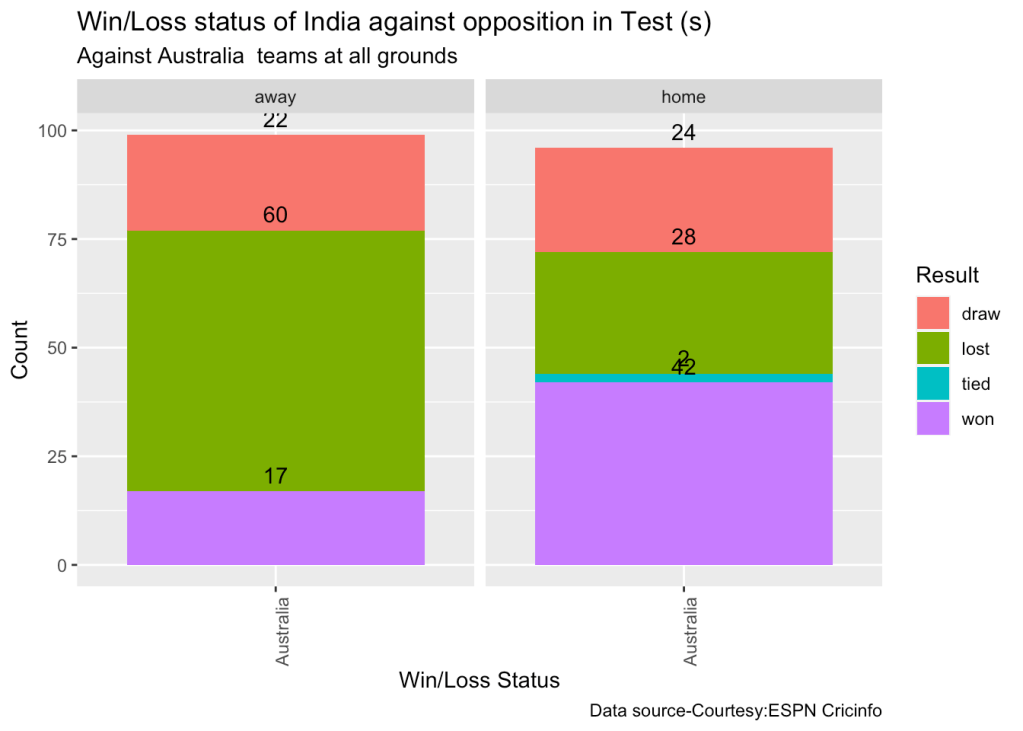
  13. Against Australia India has won 17 times, lost 60 and drawn 22 in Australia. At home India won 42, tied 2, lost 28 and drawn 24
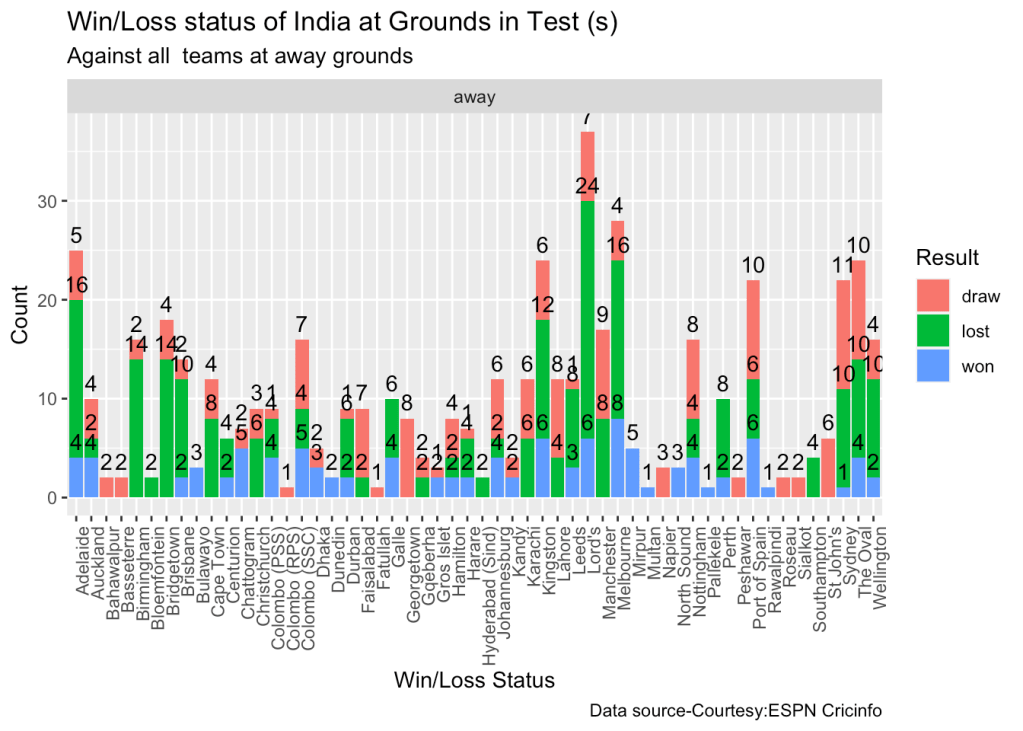
  14. At the Oval where the World Test Championship is going to be held India has won 4, lost 10 and drawn 10.

Note 3: You can also read this post at Rpubs at ind-aus-WTC!! The formatting will be nicer!

Note 4: You can download this post as PDF to read at your leisure ind-aus-WTC.pdf

2. Install the cricketr package

if (!require("cricketr")){
    install.packages("cricketr",lib = "c:/test")
}
library(cricketr)

3a. Basic analysis

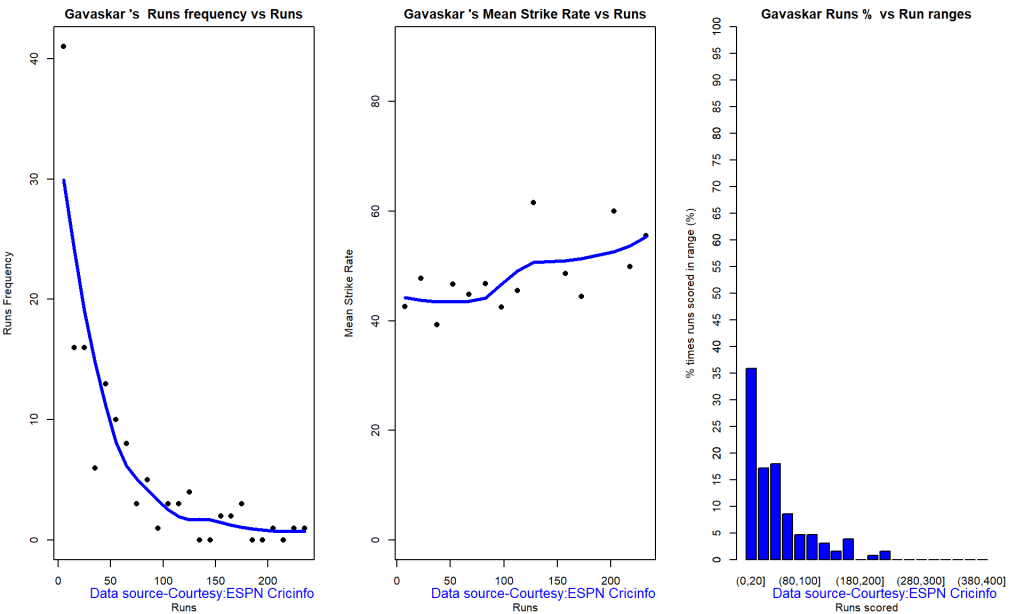
The analyses below include – Runs frequency plot – Mean strike rate – Run Ranges

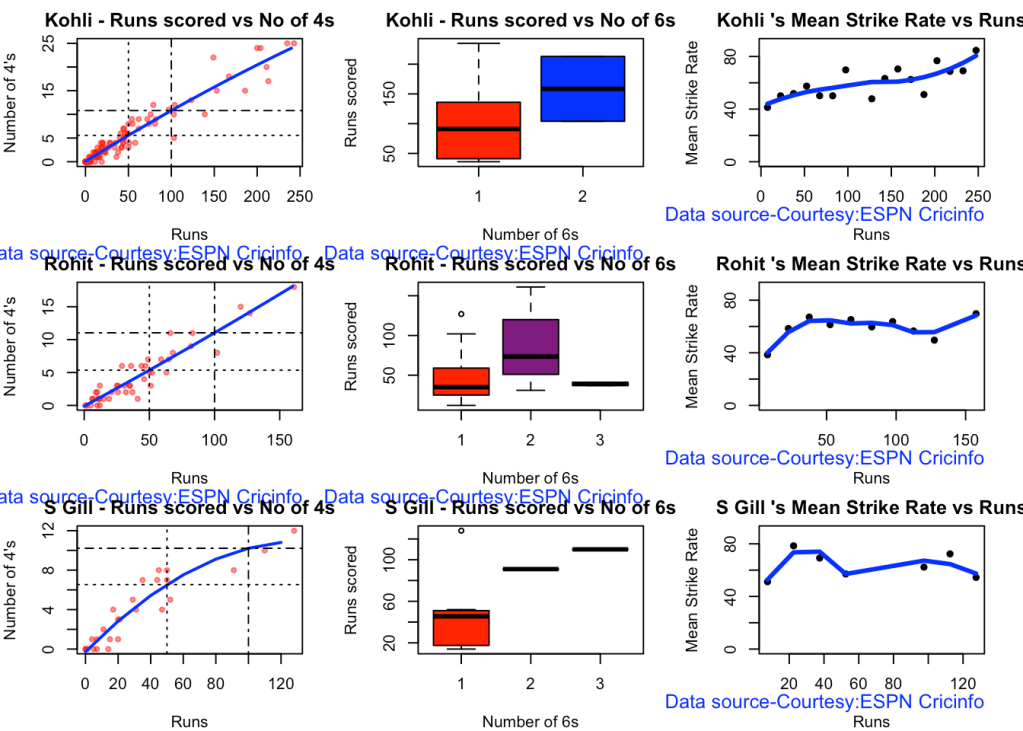
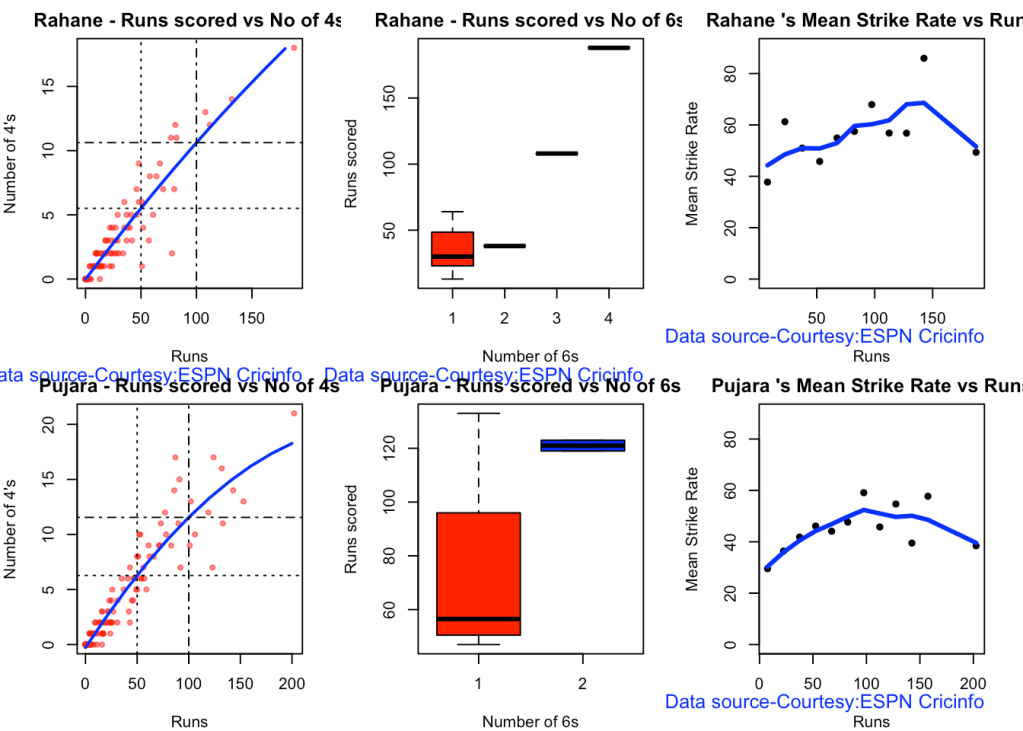
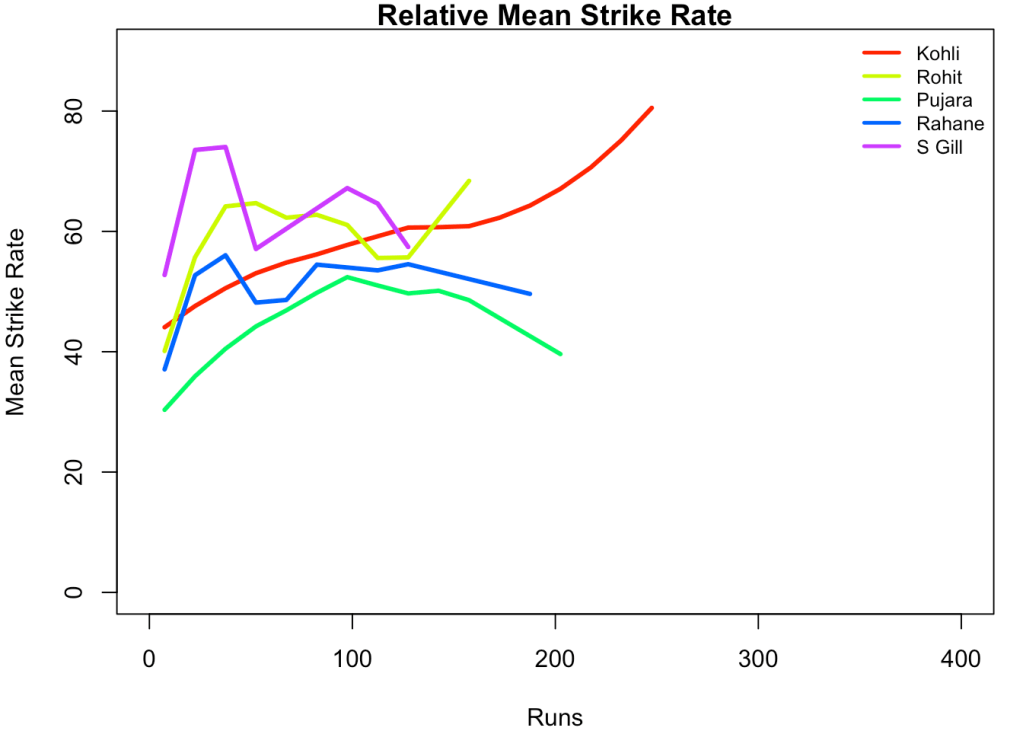
Kohli’s strike rate increases with increasing runs, while Gill’s seems to drop. So it is with Pujara & Rahane

par(mfrow=c(3,3))
par(mar=c(4,4,2,2))
batsmanRunsFreqPerf("kohliTest.csv","Kohli")
batsmanMeanStrikeRate("kohliTest.csv","Kohli")
batsmanRunsRanges("kohliTest.csv","Kohli")

batsmanRunsFreqPerf("rohitTest.csv","Rohit")
batsmanMeanStrikeRate("rohitTest.csv","Rohit")
batsmanRunsRanges("rohitTest.csv","Rohit")

batsmanRunsFreqPerf("shubmanTest.csv","S Gill")
batsmanMeanStrikeRate("shubmanTest.csv","S Gill")
batsmanRunsRanges("shubmanTest.csv","S Gill")
par(mfrow=c(2,3))
par(mar=c(4,4,2,2))
batsmanRunsFreqPerf("rahaneTest.csv","Rahane")
batsmanMeanStrikeRate("rahaneTest.csv","Rahane")
batsmanRunsRanges("rahaneTest.csv","Rahane")

batsmanRunsFreqPerf("pujaraTest.csv","Pujara")
batsmanMeanStrikeRate("pujaraTest.csv","Pujara")
batsmanRunsRanges("pujaraTest.csv","Pujara")

3b. More analyses

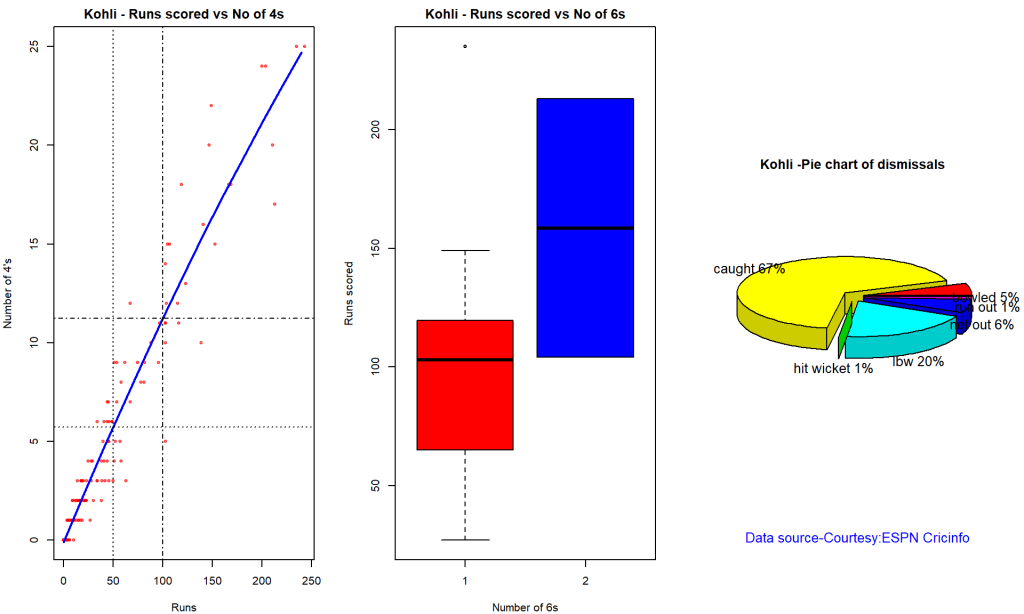
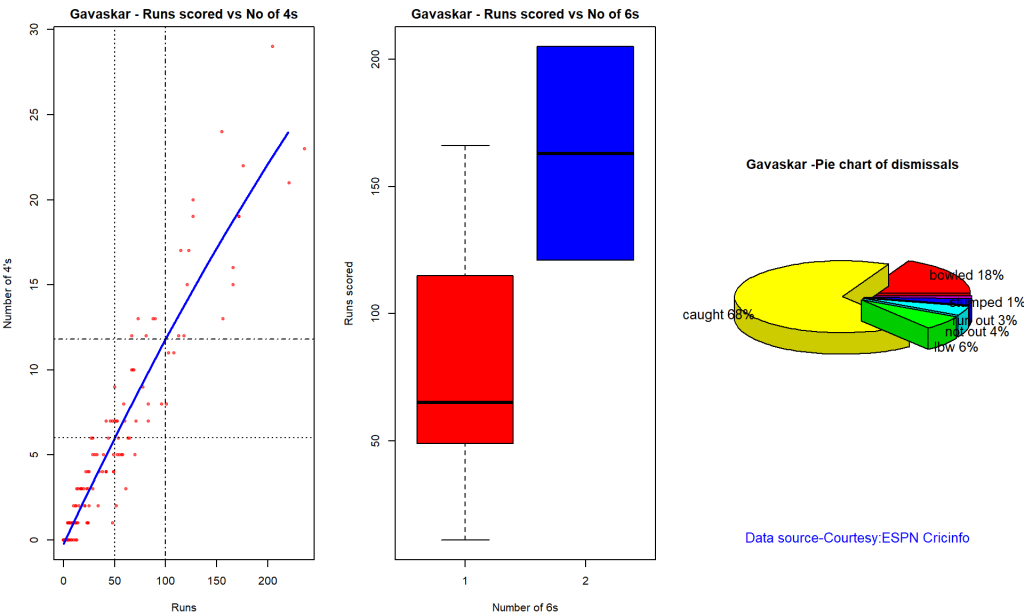
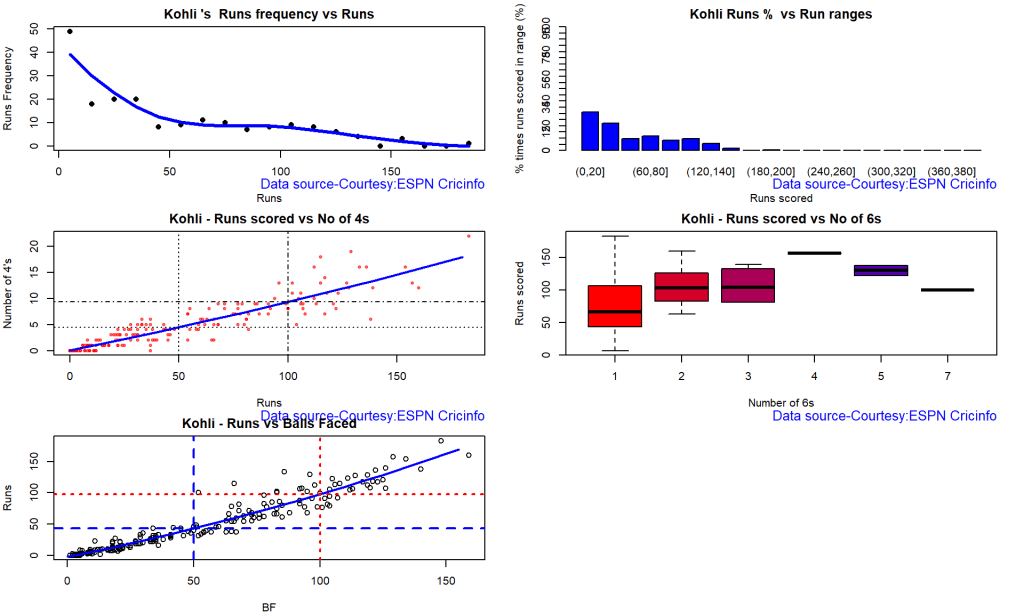
Kohli hits roughly 5 4s in his 50 versus Gill,Pujara who is able to smash 6 4s.

par(mfrow=c(3,3))
par(mar=c(4,4,2,2))

batsman4s("kohliTest.csv","Kohli")
batsman6s("kohliTest.csv","Kohli")
batsmanMeanStrikeRate("kohliTest.csv","Kohli")

batsman4s("rohitTest.csv","Rohit")
batsman6s("rohitTest.csv","Rohit")
batsmanMeanStrikeRate("rohitTest.csv","Rohit")

batsman4s("shubmanTest.csv","S Gill")
batsman6s("shubmanTest.csv","S Gill")
batsmanMeanStrikeRate("shubmanTest.csv","S Gill")
par(mfrow=c(2,3))
par(mar=c(4,4,2,2))

batsman4s("rahaneTest.csv","Rahane")
batsman6s("rahaneTest.csv","Rahane")
batsmanMeanStrikeRate("rahane.csv","Rahane")

batsman4s("pujaraTest.csv","Pujara")
batsman6s("pujaraTest.csv","Pujara")
batsmanMeanStrikeRate("pujaraTest.csv","Pujara")
3c.Boxplot histogram plot

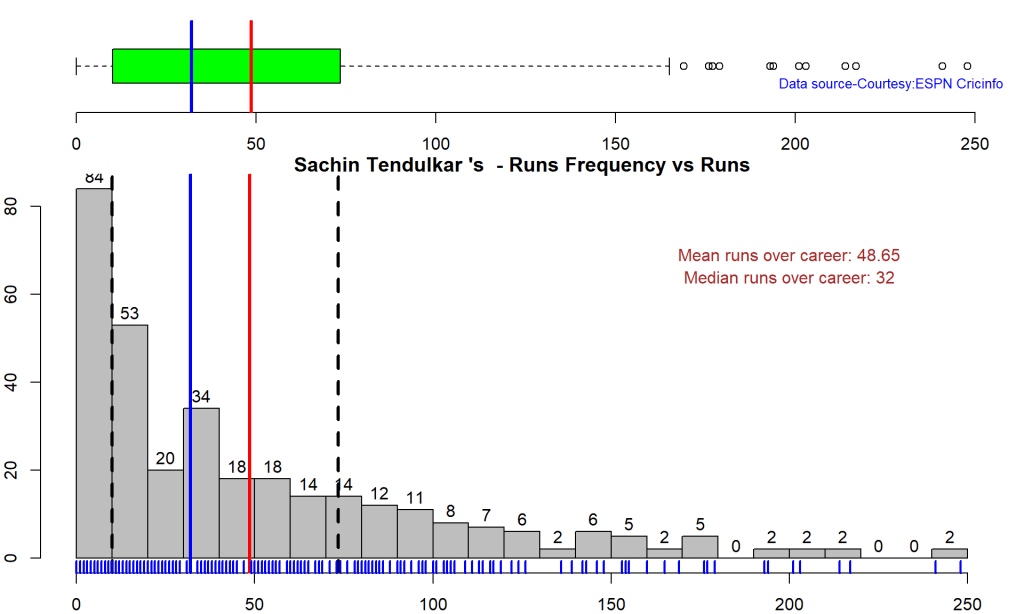
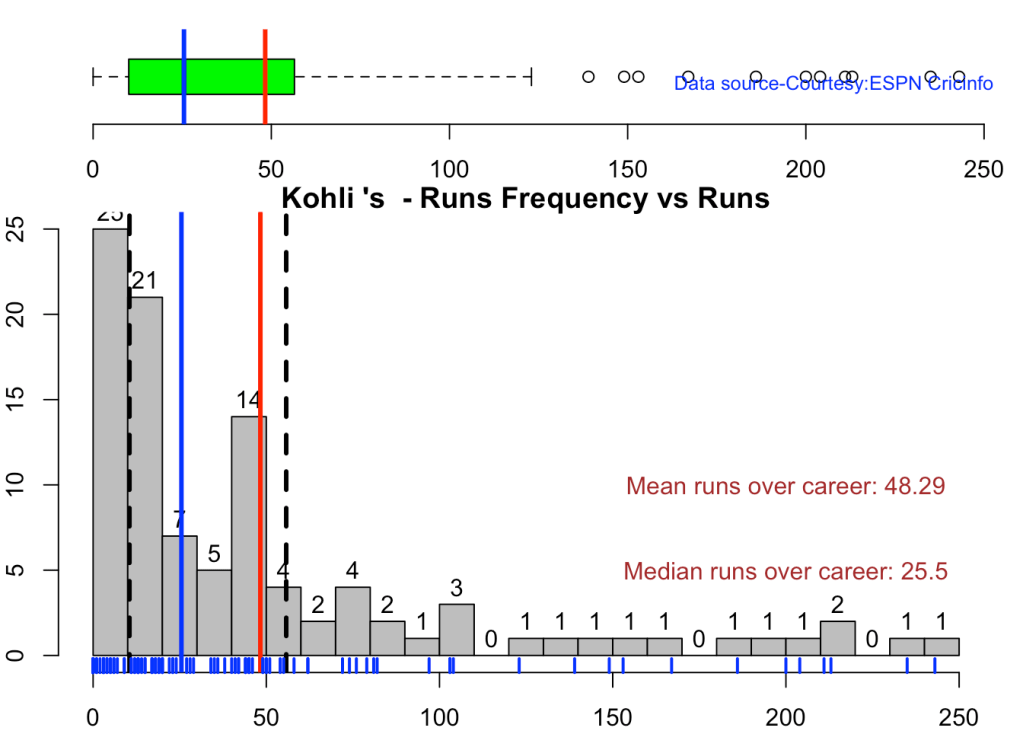
This plot shows a combined boxplot of the Runs ranges and a histog2ram of the Runs Frequency Kohli’s average is 48, while Rohit,Pujara is 40 with Rahane and Gill around 33.

batsmanPerfBoxHist("kohliTest.csv","Kohli")
batsmanPerfBoxHist("rohitTest.csv","Rohit")
batsmanPerfBoxHist("shubmanTest.csv","S Gill")
batsmanPerfBoxHist("rahaneTest.csv","Rahane")
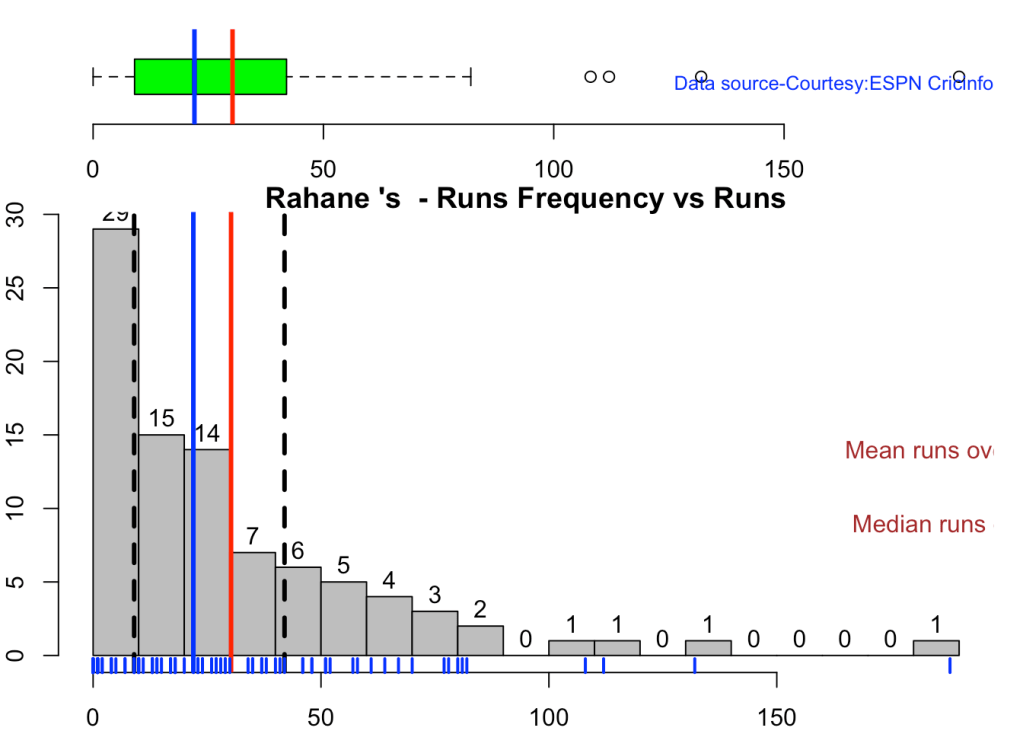
batsmanPerfBoxHist("pujaraTest.csv","Pujara")

3d. Contribution to won and lost matches

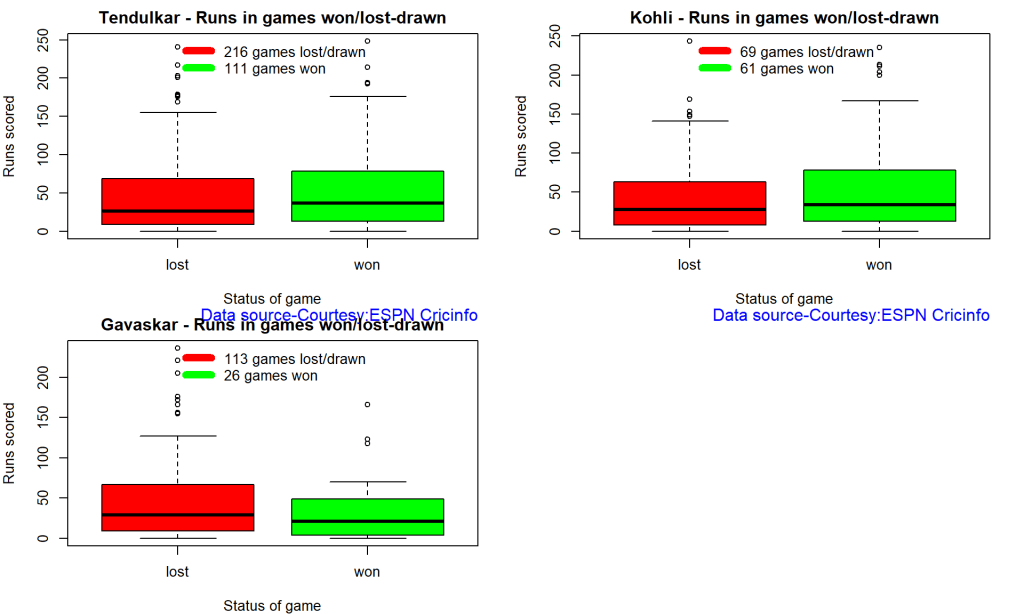
For the functions below you will have to use the getPlayerDataSp() function. When Rohit Sharma and Pujara have played well India have tended to win more often

par(mfrow=c(2,2))
par(mar=c(4,4,2,2))

batsmanContributionWonLost("kohlisp.csv","Kohli")
batsmanContributionWonLost("rohitsp.csv","Rohit")
batsmanContributionWonLost("rahanesp.csv","Rahane")
batsmanContributionWonLost("pujarasp.csv","Pujara")

3e. Performance at home and overseas

This function also requires the use of getPlayerDataSp() as shown above. This can only be used for Test matches

par(mfrow=c(2,2))
par(mar=c(4,4,2,2))

batsmanPerfHomeAway("kohlisp.csv","Kohli")
batsmanPerfHomeAway("rohitsp.csv","Rohit")
batsmanPerfHomeAway("rahanesp.csv","Rahane")
batsmanPerfHomeAway("pujarasp.csv","Pujara")

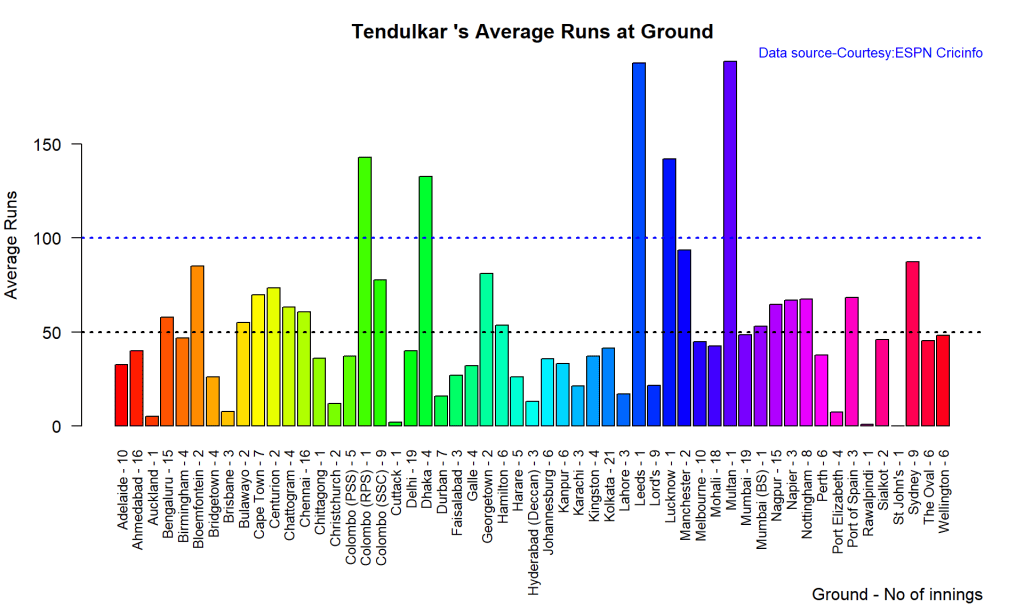
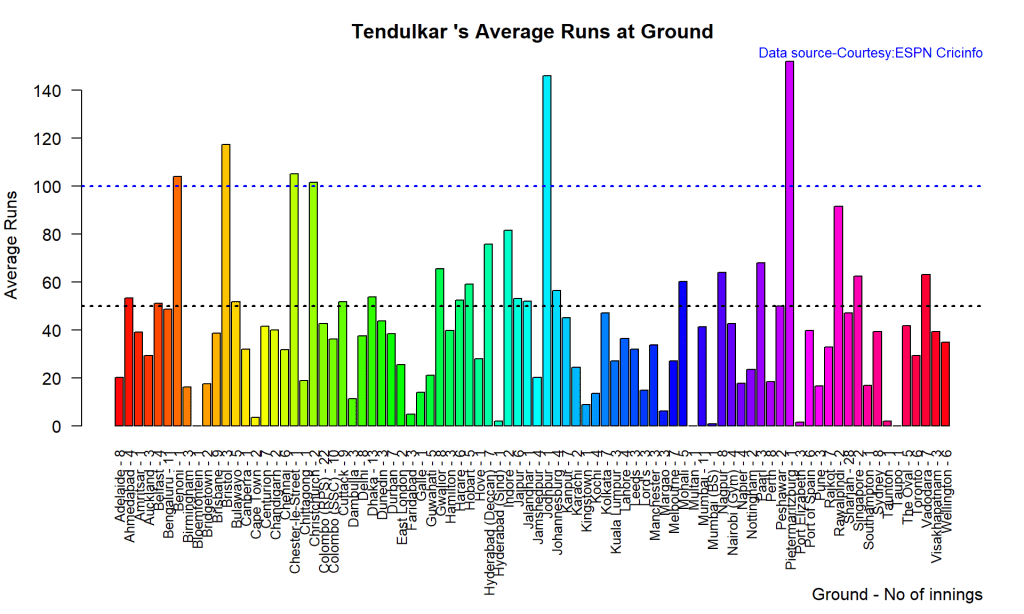
3f. Batsman average at different venues

par(mfrow=c(2,2))
par(mar=c(4,4,2,2))
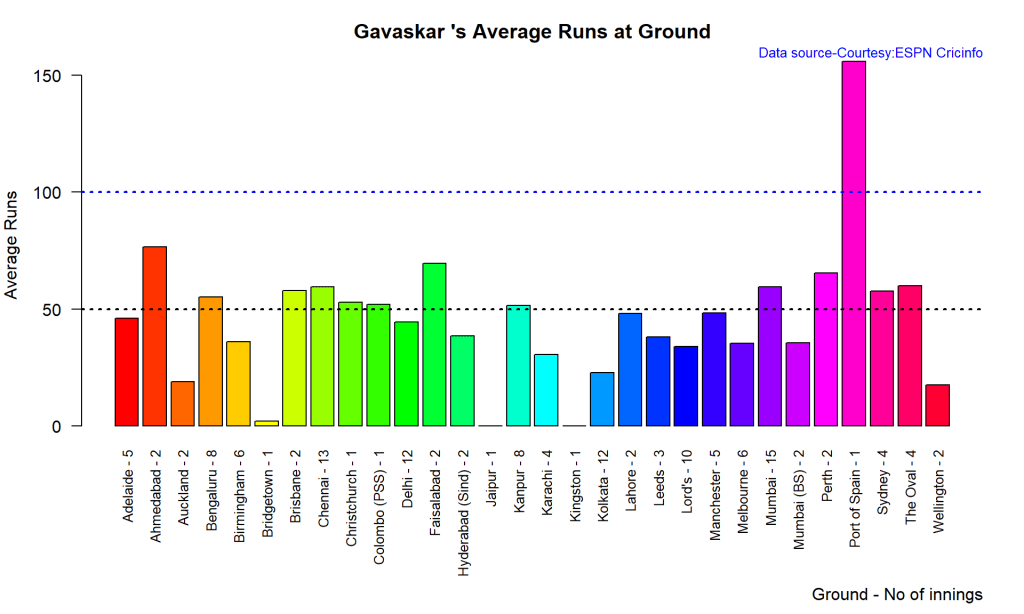
batsmanAvgRunsGround("kohliTest.csv","Kohli")
batsmanAvgRunsGround("rohitTest.csv","Rohit")
batsmanAvgRunsGround("rahaneTest.csv","Rahane")
batsmanAvgRunsGround("pujaraTest.csv","Pujara")

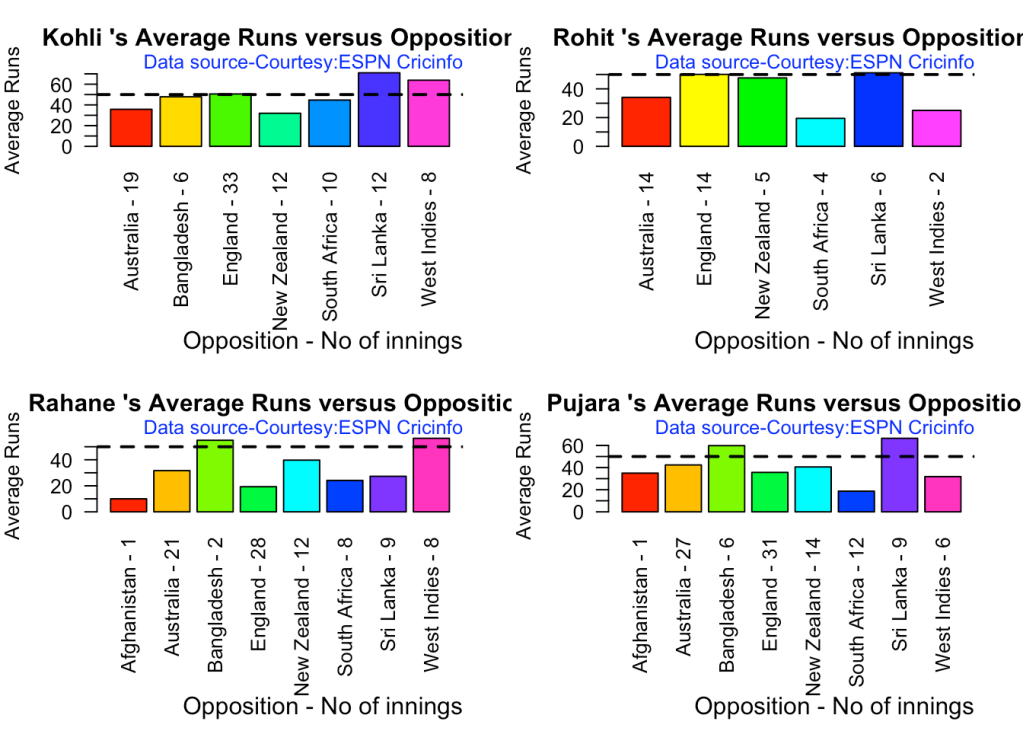
3g. Batsman average against different opposition

par(mfrow=c(2,2))
par(mar=c(4,4,2,2))
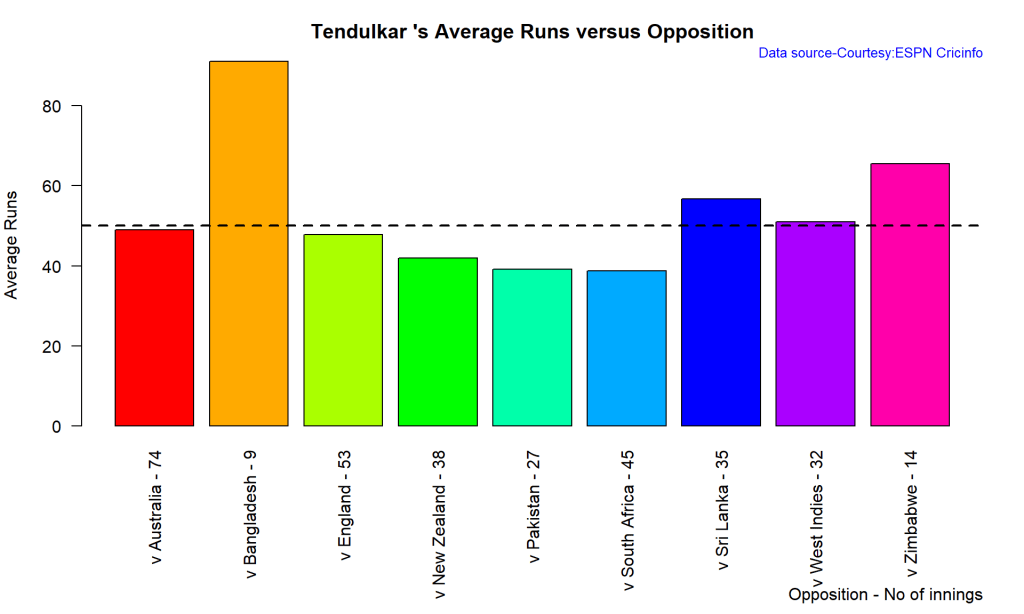
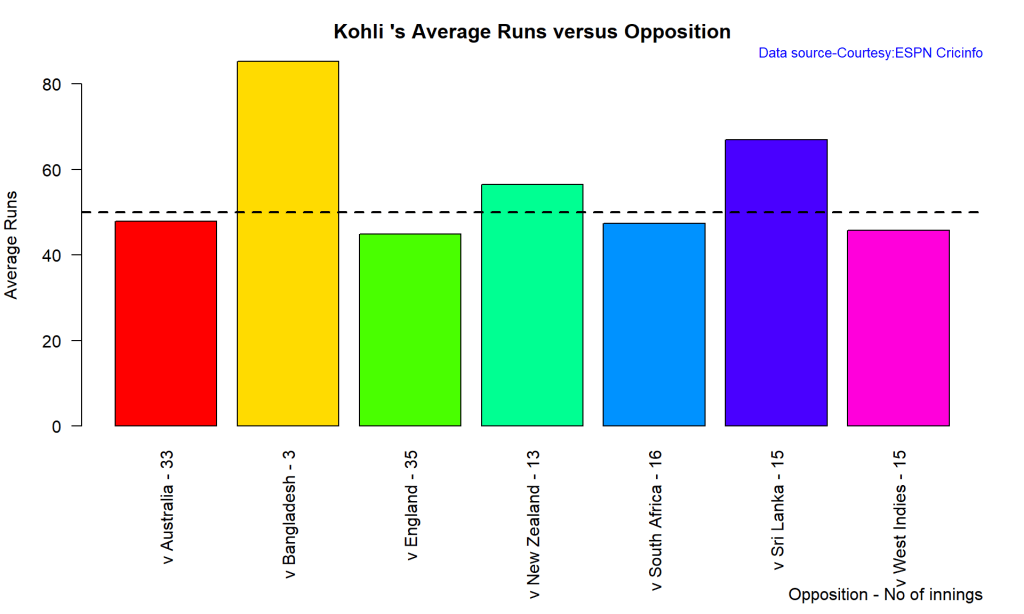
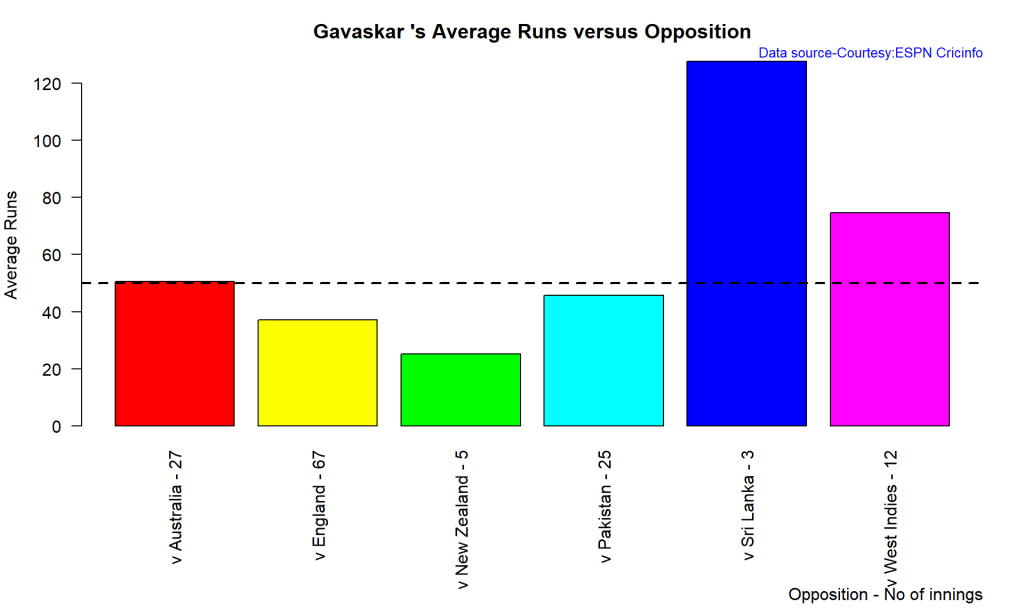
batsmanAvgRunsOpposition("kohliTest.csv","Kohli")
batsmanAvgRunsOpposition("rohitTest.csv","Rohit")
batsmanAvgRunsOpposition("rahaneTest.csv","Rahane")
batsmanAvgRunsOpposition("pujaraTest.csv","Pujara")
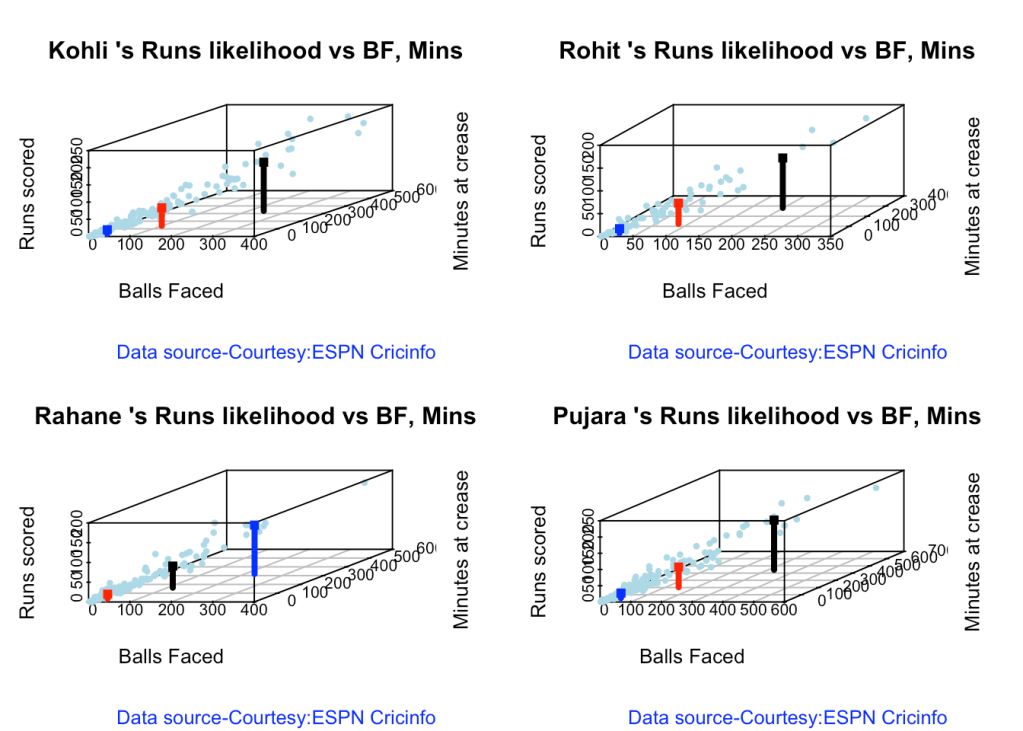
3h. Runs Likelihood of batsman

par(mfrow=c(2,2))
par(mar=c(4,4,2,2))
batsmanRunsLikelihood("kohli.csv","Kohli")
## Summary of  Kohli 's runs scoring likelihood
## **************************************************
## 
## There is a 52.91 % likelihood that Kohli  will make  12 Runs in  26 balls over 35  Minutes 
## There is a 30.81 % likelihood that Kohli  will make  52 Runs in  100 balls over  139  Minutes 
## There is a 16.28 % likelihood that Kohli  will make  142 Runs in  237 balls over 335  Minutes
batsmanRunsLikelihood("rohit.csv","Rohit")
## Summary of  Rohit 's runs scoring likelihood
## **************************************************
## 
## There is a 43.24 % likelihood that Rohit  will make  10 Runs in  21 balls over 32  Minutes 
## There is a 45.95 % likelihood that Rohit  will make  46 Runs in  85 balls over  124  Minutes 
## There is a 10.81 % likelihood that Rohit  will make  110 Runs in  199 balls over 282  Minutes
batsmanRunsLikelihood("rahane.csv","Rahane")
## Summary of  Rahane 's runs scoring likelihood
## **************************************************
## 
## There is a 7.75 % likelihood that Rahane  will make  124 Runs in  224 balls over 318  Minutes 
## There is a 62.02 % likelihood that Rahane  will make  12 Runs in  26 balls over  37  Minutes 
## There is a 30.23 % likelihood that Rahane  will make  55 Runs in  113 balls over 162  Minutes
batsmanRunsLikelihood("pujara.csv","Pujara")
## Summary of  Pujara 's runs scoring likelihood
## **************************************************
## 
## There is a 60.49 % likelihood that Pujara  will make  15 Runs in  38 balls over 55  Minutes 
## There is a 31.48 % likelihood that Pujara  will make  62 Runs in  142 balls over  204  Minutes 
## There is a 8.02 % likelihood that Pujara  will make  153 Runs in  319 balls over 445  Minutes
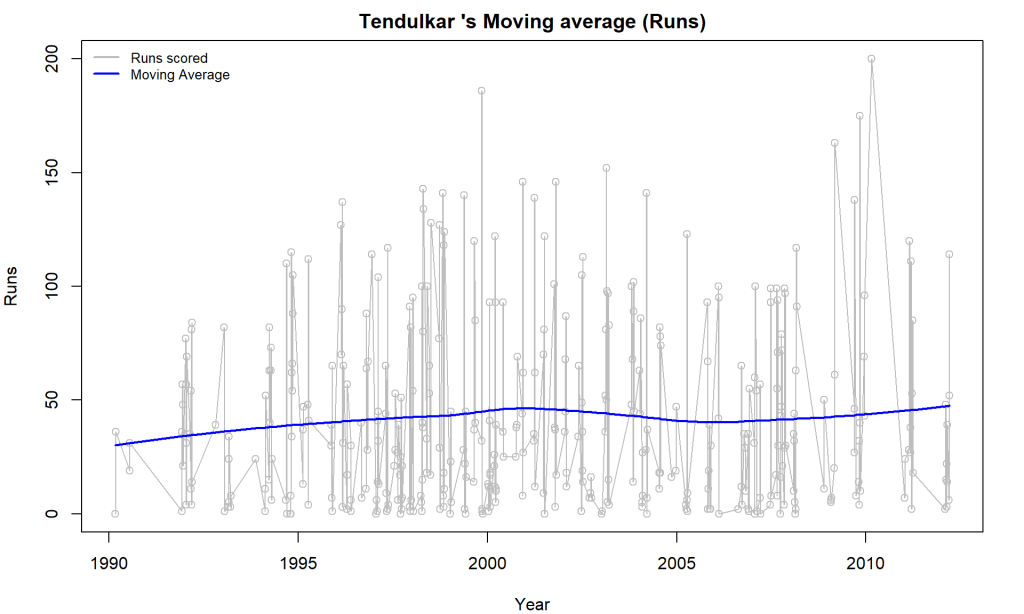
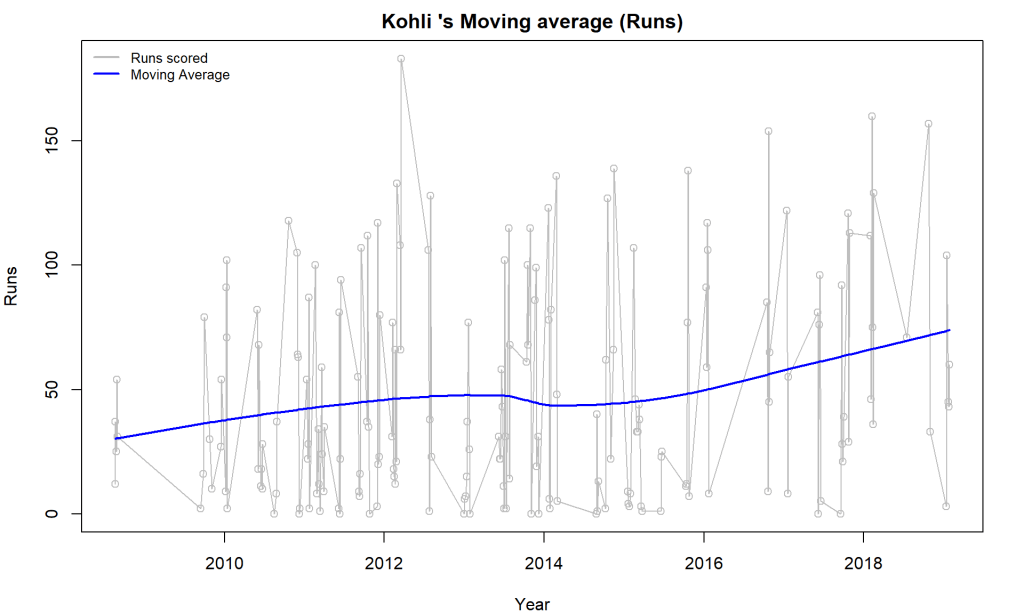
3h1. Moving average of batsman

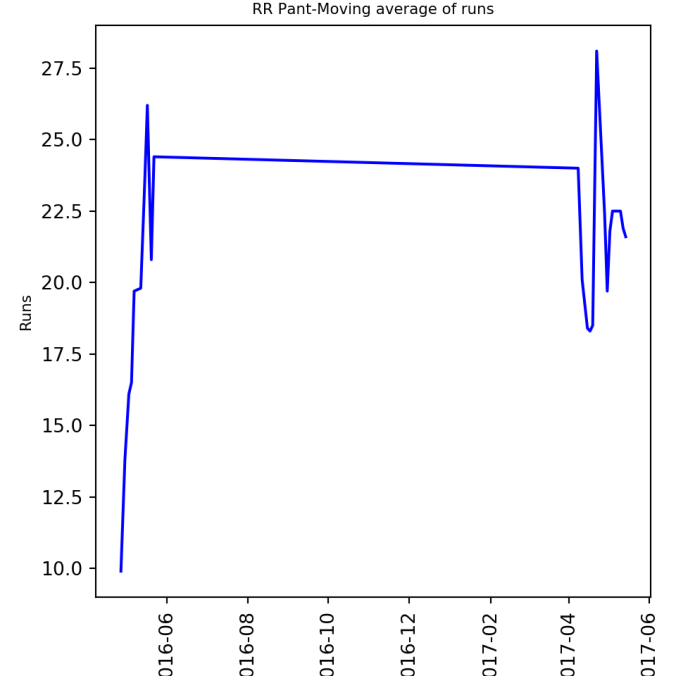
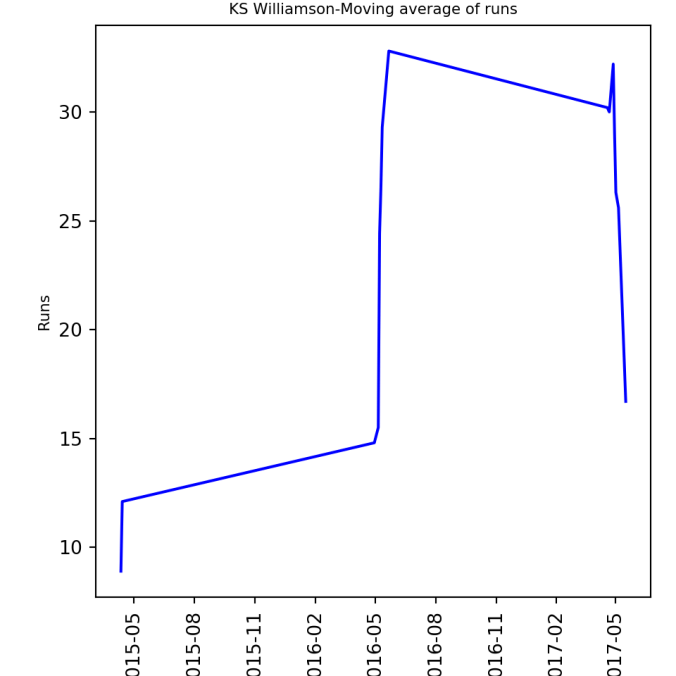
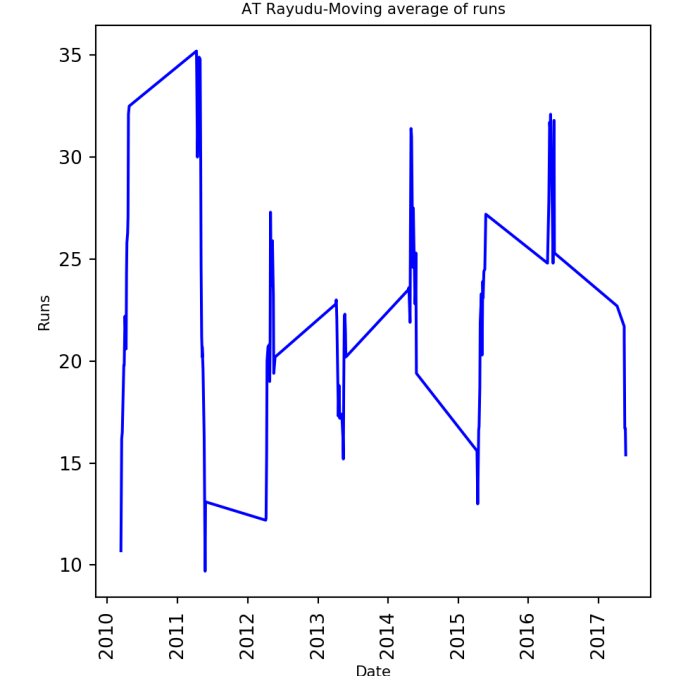
Kohli’s moving average in tests seem to havw dropped after a peak in 2017, 2018. So it is with Rahane

par(mfrow=c(2,2))
par(mar=c(4,4,2,2))
batsmanMovingAverage("kohli.csv","Kohli")
batsmanMovingAverage("rohit.csv","Rohit")
batsmanMovingAverage("rahane.csv","Rahane")
batsmanMovingAverage("pujara.csv","Pujara")

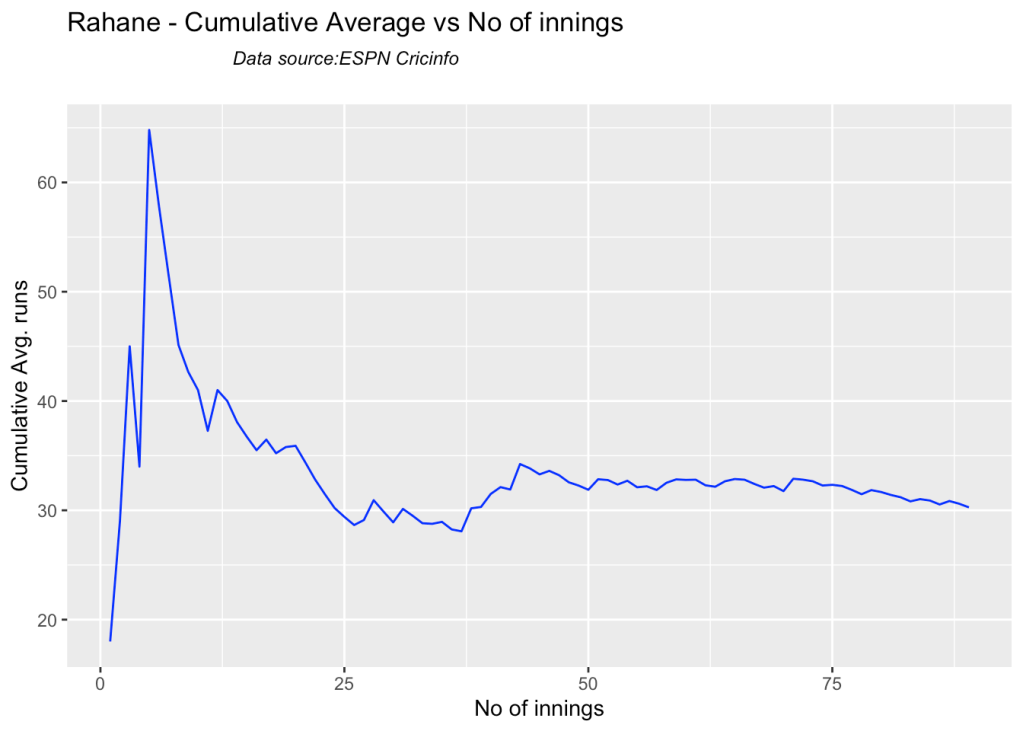
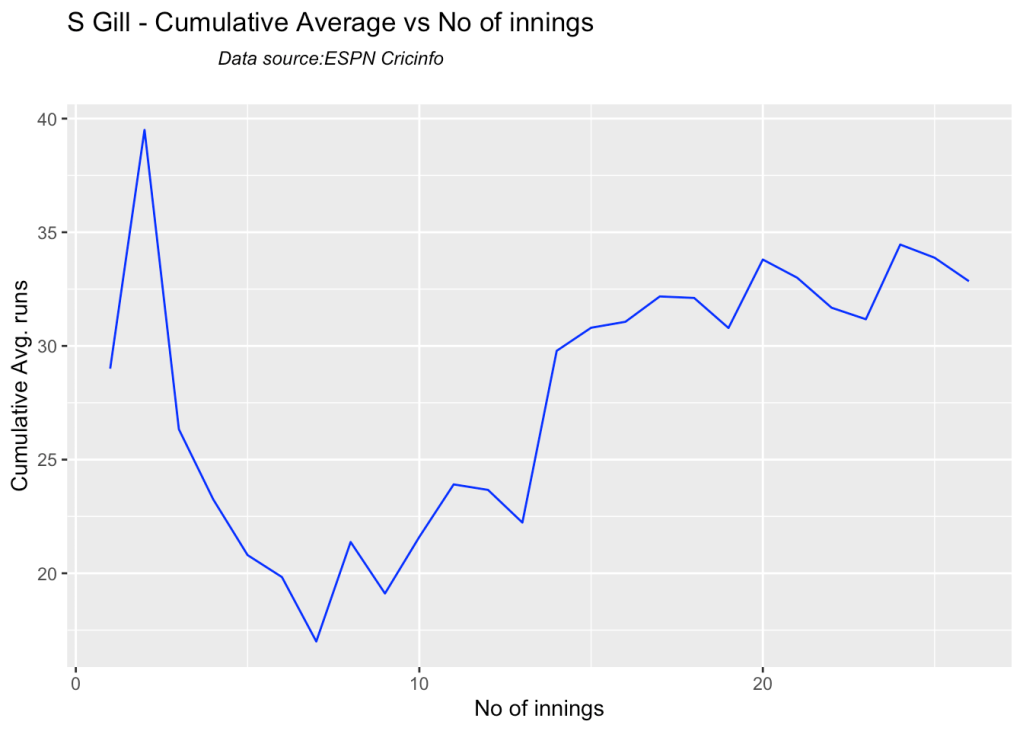
3i. Cumulative Average runs of batsman in career

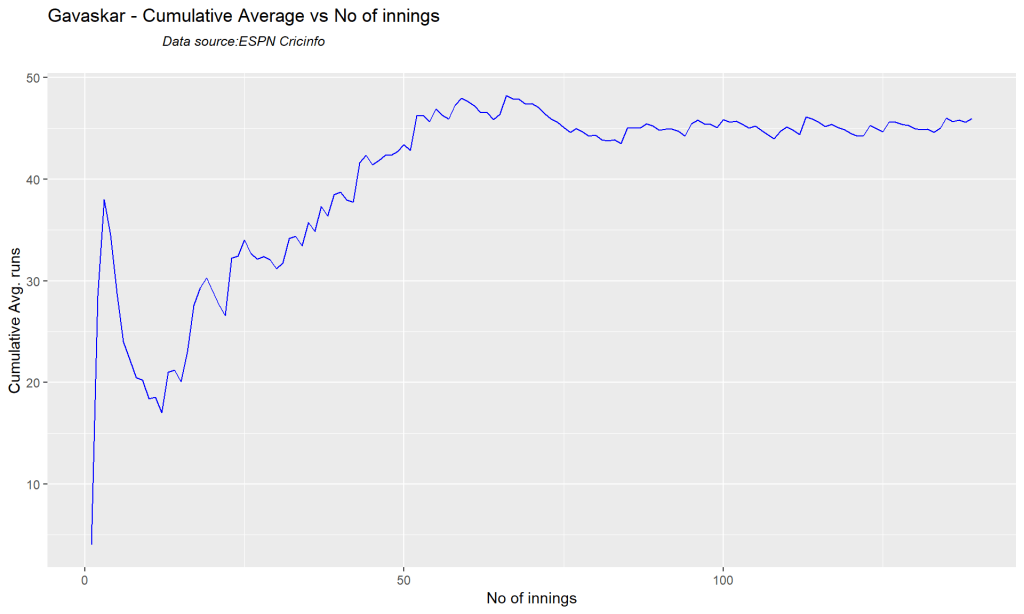
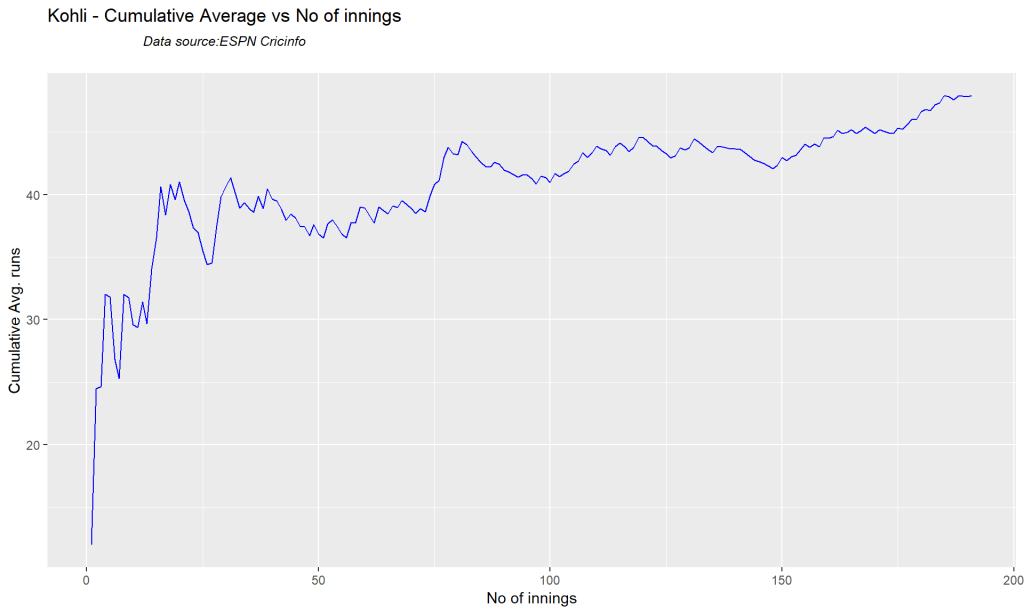
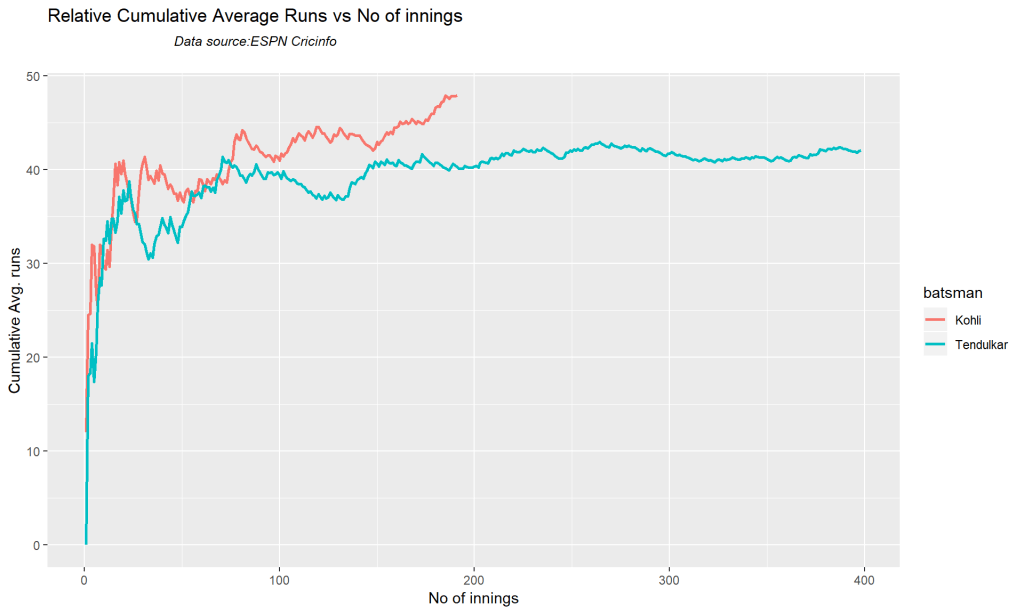
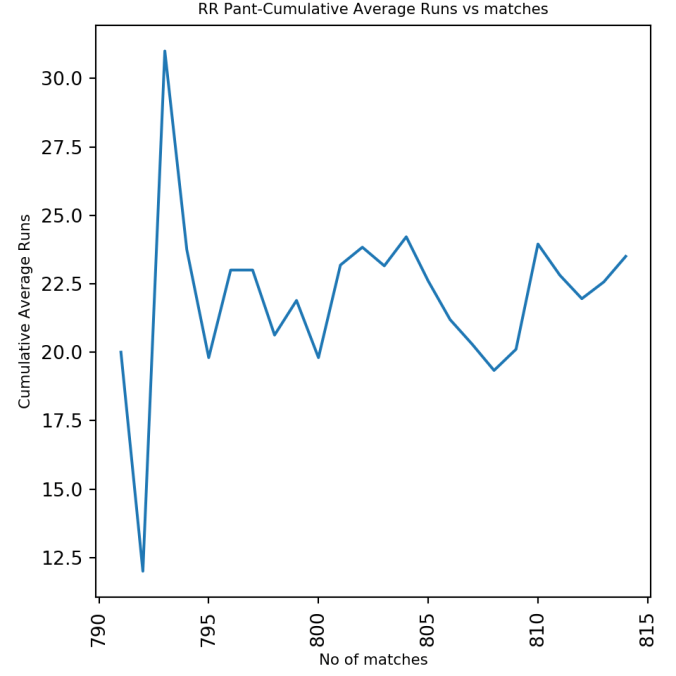
Kohli’s cumulative average averages to ~48. Shubman Gill’s cumulative average is on the rise.

par(mfrow=c(2,2))
par(mar=c(4,4,2,2))
batsmanCumulativeAverageRuns("kohliTest.csv","Kohli")
batsmanCumulativeAverageRuns("rohitTest.csv","Rohit")
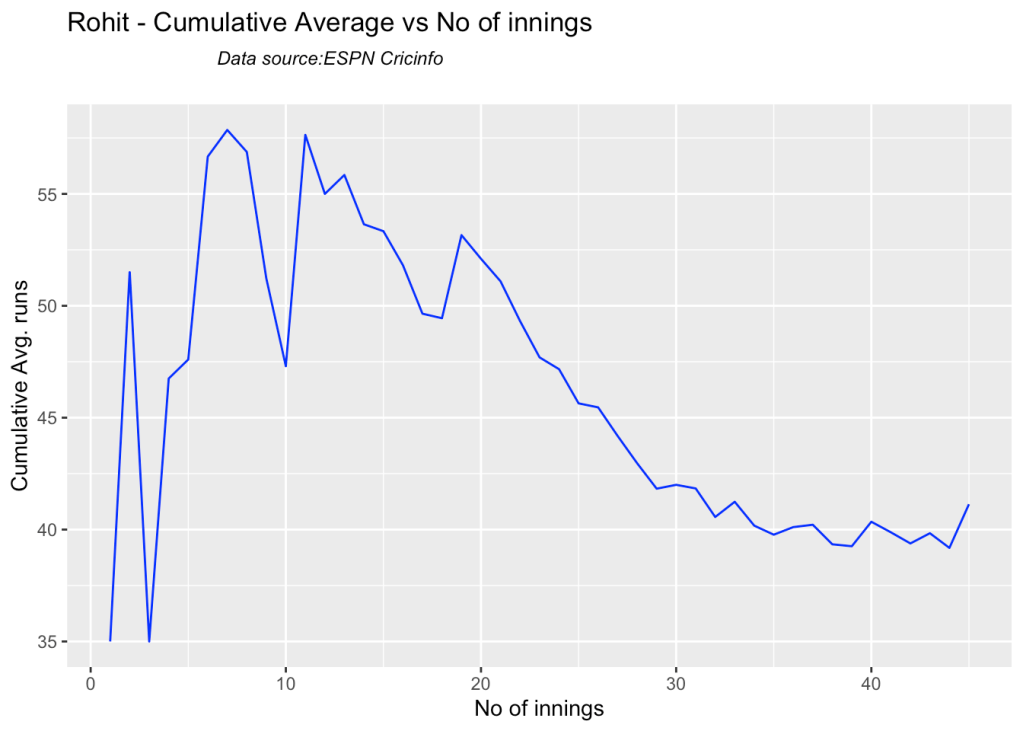
batsmanCumulativeAverageRuns("rahaneTest.csv","Rahane")
batsmanCumulativeAverageRuns("pujaraTest.csv","Pujara")
batsmanCumulativeAverageRuns("shubmanTest.csv","S Gill")
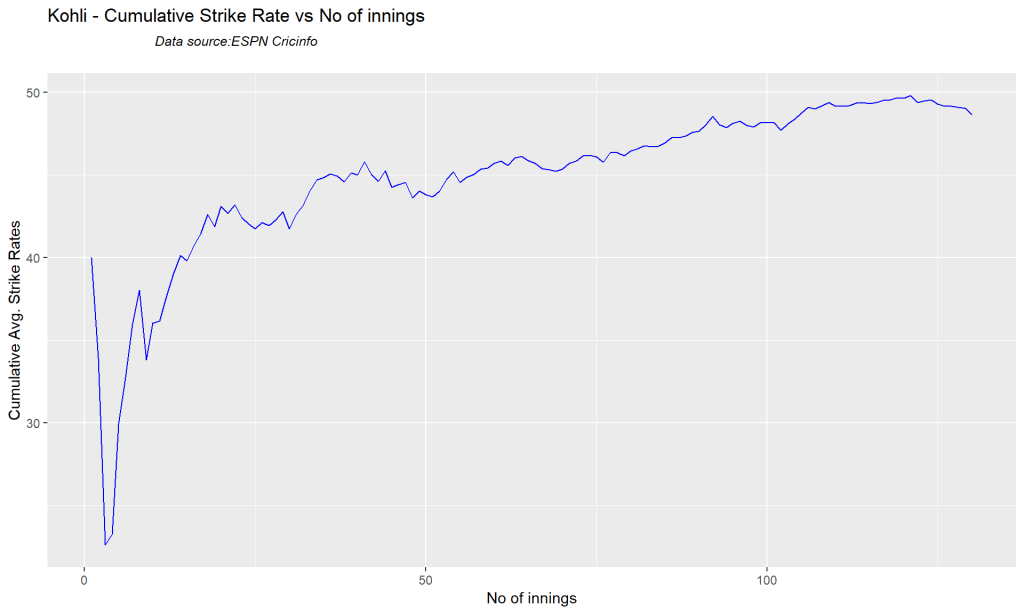
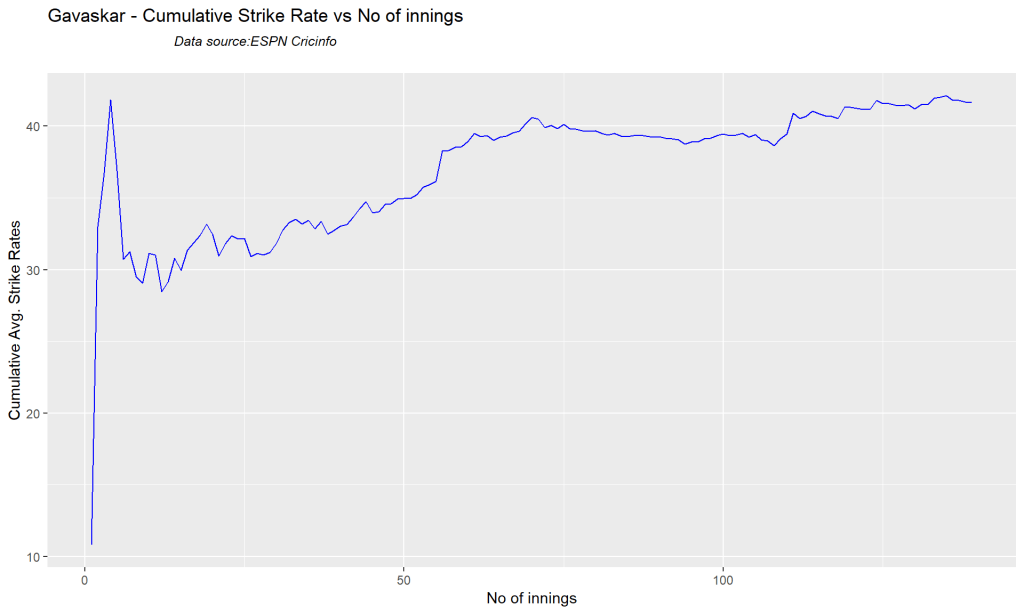
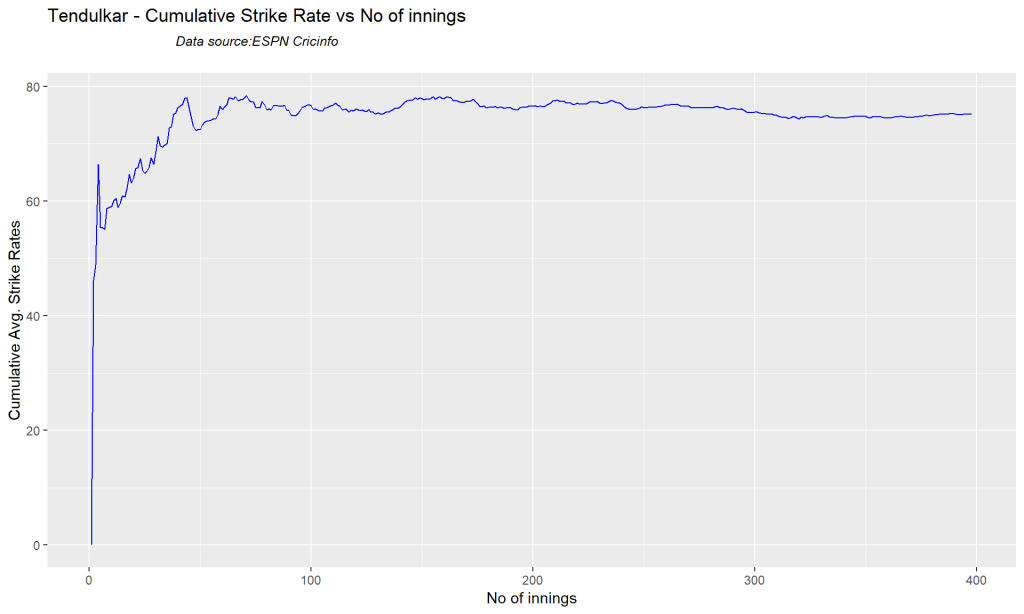
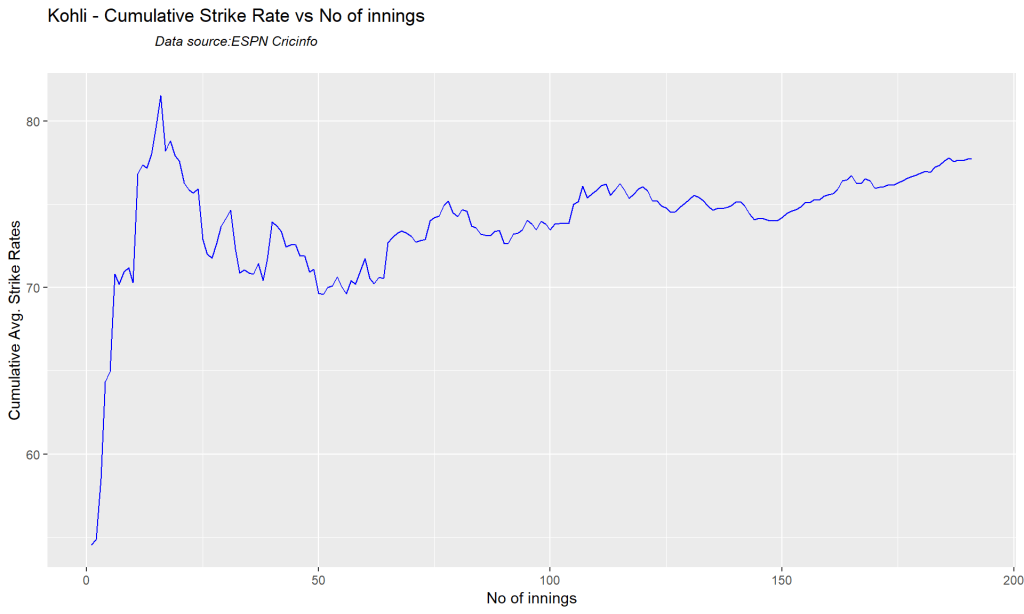
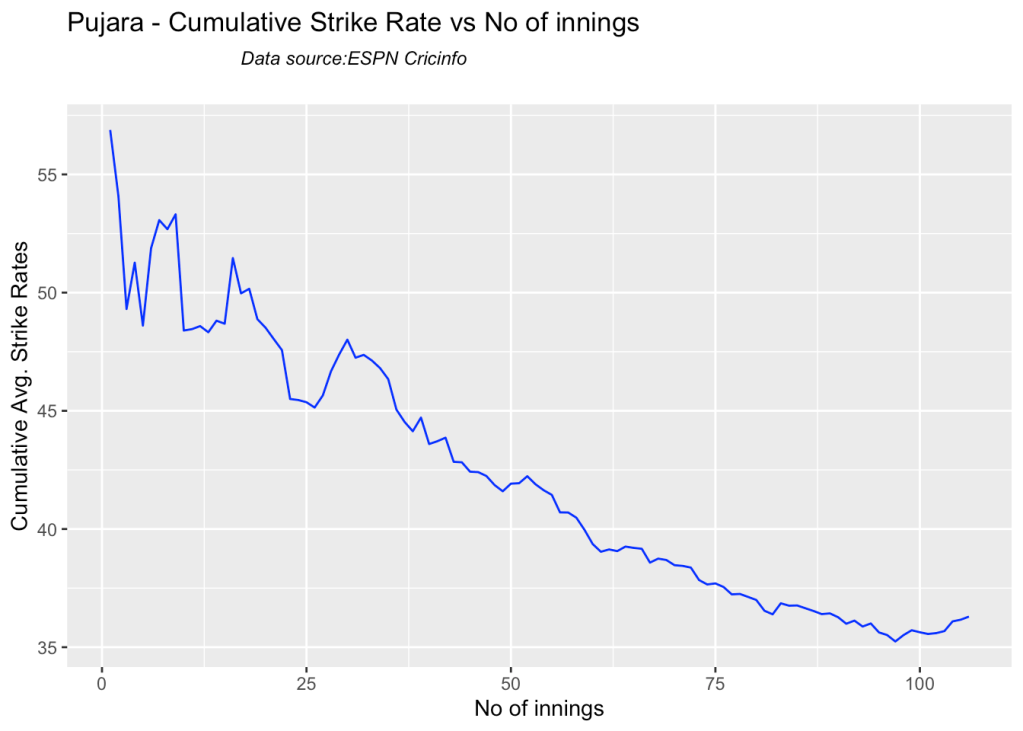
3j Cumulative Average strike rate of batsman in career

par(mfrow=c(2,2))
par(mar=c(4,4,2,2))

batsmanCumulativeStrikeRate("kohliTest.csv","Kohli")
batsmanCumulativeStrikeRate("rohitTest.csv","Rohit")
batsmanCumulativeStrikeRate("rahaneTest.csv","Rahane")
batsmanCumulativeStrikeRate("pujaraTest.csv","Pujara")
batsmanCumulativeStrikeRate("shubmanTest.csv","S Gill")

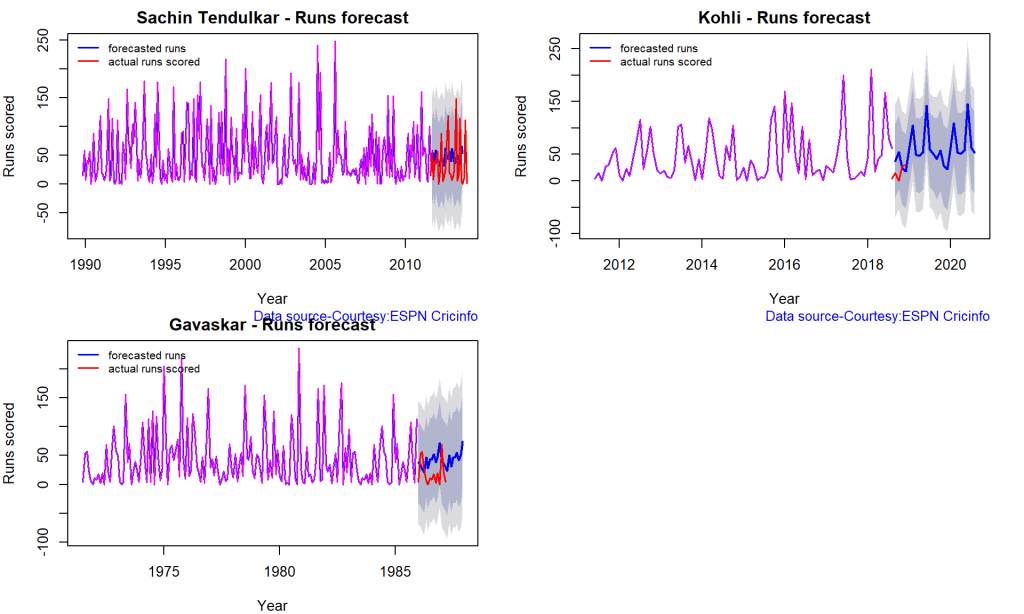
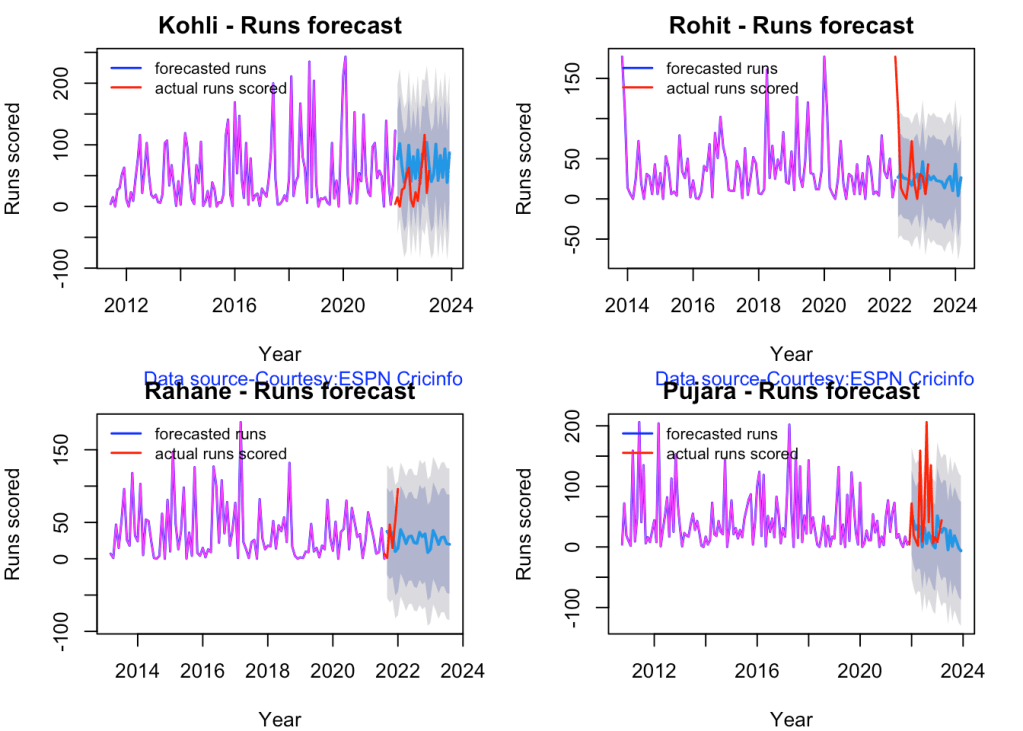
3k. Future Runs forecast

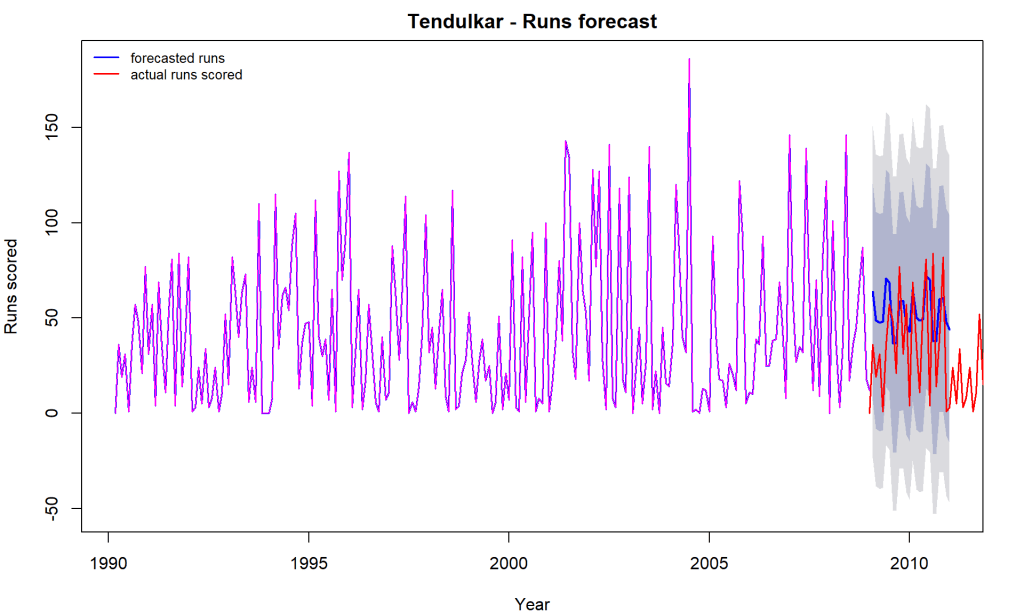
Here are plots that forecast how the batsman will perform in future. In this case 90% of the career runs trend is uses as the training set. the remaining 10% is the test set.

A Holt-Winters forecating model is used to forecast future performance based on the 90% training set. The forecated runs trend is plotted. The test set is also plotted to see how close the forecast and the actual matches

Take a look at the runs forecasted for the batsman below.

par(mfrow=c(2,2))
par(mar=c(4,4,2,2))

batsmanPerfForecast("kohli.csv","Kohli")
batsmanPerfForecast("rohit.csv","Rohit")
batsmanPerfForecast("rahane.csv","Rahane")
batsmanPerfForecast("pujara.csv","Pujara")
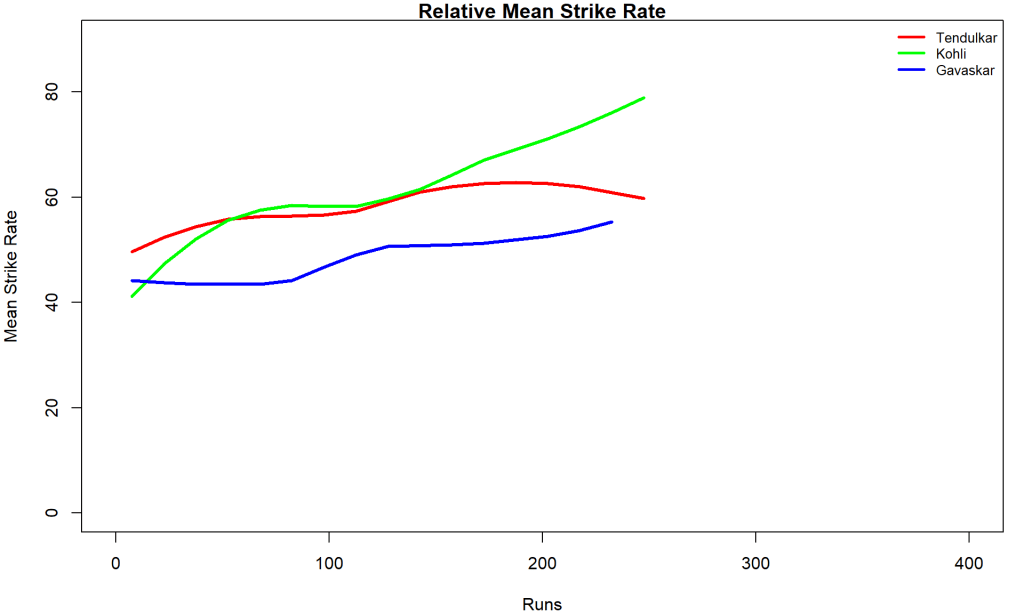
3l. Relative Mean Strike Rate plot

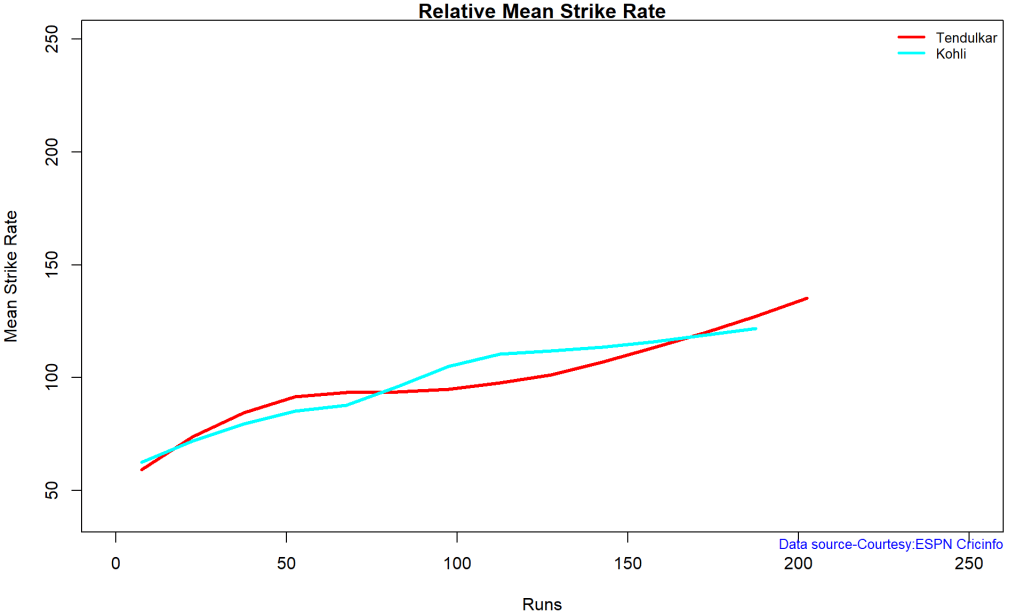
The plot below compares the Mean Strike Rate of the batsman for each of the runs ranges of 10 and plots them. The plot indicate the following

frames <- list("kohliTest.csv","rohitTest.csv","pujaraTest.csv","rahaneTest.csv","shubmanTest.csv")
names <- list("Kohli","Rohit","Pujara","Rahane","S Gill")
relativeBatsmanSR(frames,names)
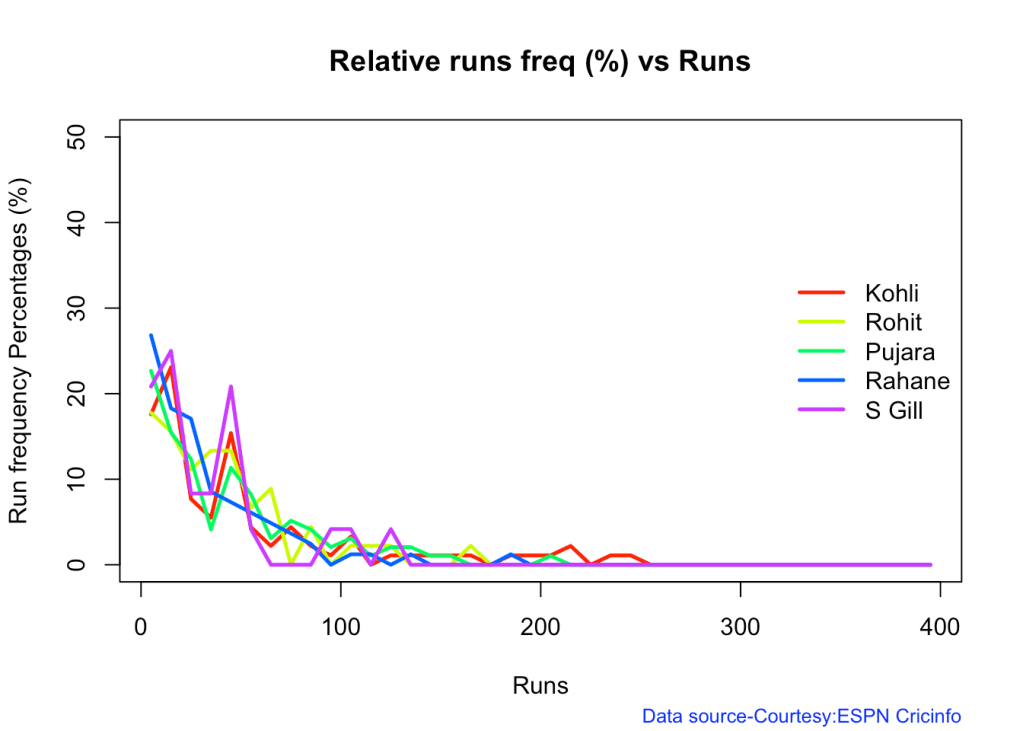
3m. Relative Runs Frequency plot

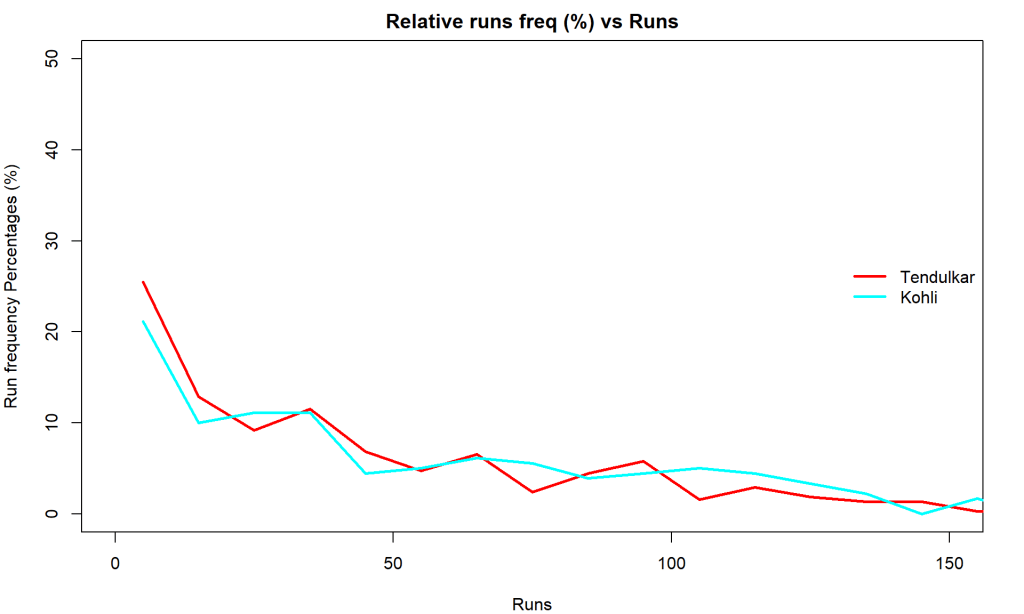
The plot below gives the relative Runs Frequency Percetages for each 10 run bucket. The plot below show

frames <- list("kohliTest.csv","rohitTest.csv","pujaraTest.csv","rahaneTest.csv","shubmanTest.csv")
names <- list("Kohli","Rohit","Pujara","Rahane","S Gill")
relativeRunsFreqPerf(frames,names)
3n. Relative cumulative average runs in career

Kohli’s tops the list, followed by Pujara and Rohit is 3rd. Gill is on the upswing. Hope he performs well.

frames <- list("kohliTest.csv","rohitTest.csv","pujaraTest.csv","rahaneTest.csv","shubmanTest.csv")
names <- list("Kohli","Rohit","Pujara","Rahane","S Gill")
relativeBatsmanCumulativeAvgRuns(frames,names)
3o. Relative cumulative average strike rate in career

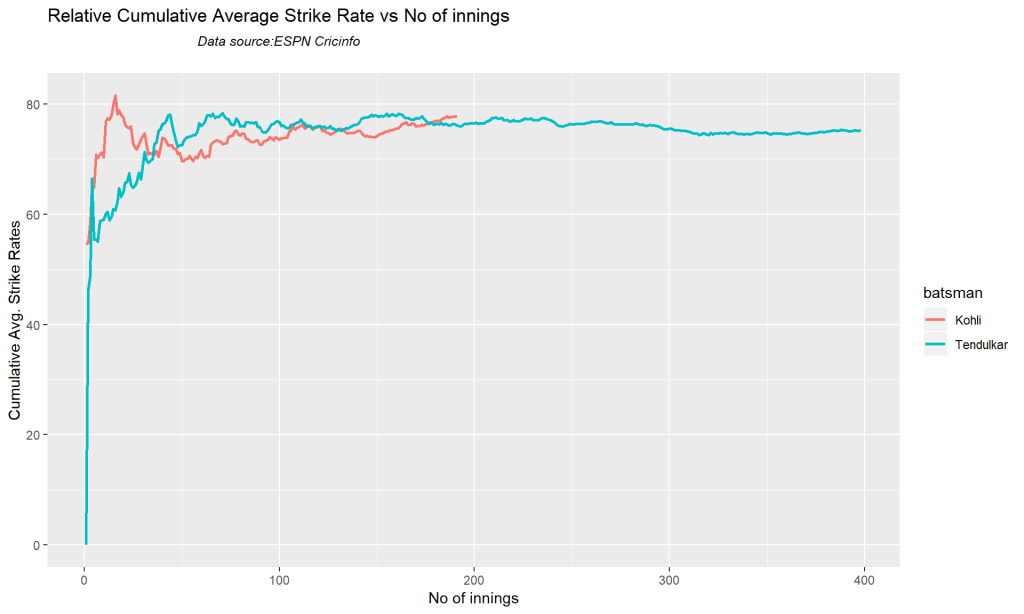
ROhit has the best strike rate followed by Kohli, with Shubman Gill ctaching up fast

frames <- list("kohliTest.csv","rohitTest.csv","pujaraTest.csv","rahaneTest.csv","shubmanTest.csv")
names <- list("Kohli","Rohit","Pujara","Rahane","S Gill")
relativeBatsmanCumulativeStrikeRate(frames,names)

3p. Check Batsman In-Form or Out-of-Form

The below computation uses Null Hypothesis testing and p-value to determine if the batsman is in-form or out-of-form. For this 90% of the career runs is chosen as the population and the mean computed. The last 10% is chosen to be the sample set and the sample Mean and the sample Standard Deviation are caculated.

The Null Hypothesis (H0) assumes that the batsman continues to stay in-form where the sample mean is within 95% confidence interval of population mean The Alternative (Ha) assumes that the batsman is out of form the sample mean is beyond the 95% confidence interval of the population mean.

A significance value of 0.05 is chosen and p-value us computed If p-value >= .05 – Batsman In-Form If p-value < 0.05 – Batsman Out-of-Form

Note Ideally the p-value should be done for a population that follows the Normal Distribution. But the runs population is usually left skewed. So some correction may be needed. I will revisit this later

This is done for the Top 4 batsman

checkBatsmanInForm("kohli.csv","Kohli")
## [1] "**************************** Form status of Kohli ****************************\n\n Population size: 154  Mean of population: 47.03 \n Sample size: 18  Mean of sample: 32.22 SD of sample: 42.45 \n\n Null hypothesis H0 : Kohli 's sample average is within 95% confidence interval of population average\n Alternative hypothesis Ha : Kohli 's sample average is below the 95% confidence interval of population average\n\n Kohli 's Form Status: In-Form because the p value: 0.078058  is greater than alpha=  0.05 \n *******************************************************************************************\n\n"
checkBatsmanInForm("rohit.csv","Rohit")
## [1] "**************************** Form status of Rohit ****************************\n\n Population size: 66  Mean of population: 37.03 \n Sample size: 8  Mean of sample: 37.88 SD of sample: 35.38 \n\n Null hypothesis H0 : Rohit 's sample average is within 95% confidence interval of population average\n Alternative hypothesis Ha : Rohit 's sample average is below the 95% confidence interval of population average\n\n Rohit 's Form Status: In-Form because the p value: 0.526254  is greater than alpha=  0.05 \n *******************************************************************************************\n\n"
checkBatsmanInForm("rahane.csv","Rahane")
## [1] "**************************** Form status of Rahane ****************************\n\n Population size: 116  Mean of population: 34.78 \n Sample size: 13  Mean of sample: 21.38 SD of sample: 21.96 \n\n Null hypothesis H0 : Rahane 's sample average is within 95% confidence interval of population average\n Alternative hypothesis Ha : Rahane 's sample average is below the 95% confidence interval of population average\n\n Rahane 's Form Status: Out-of-Form because the p value: 0.023244  is less than alpha=  0.05 \n *******************************************************************************************\n\n"
checkBatsmanInForm("pujara.csv","Pujara")
## [1] "**************************** Form status of Pujara ****************************\n\n Population size: 145  Mean of population: 41.93 \n Sample size: 17  Mean of sample: 33.24 SD of sample: 31.74 \n\n Null hypothesis H0 : Pujara 's sample average is within 95% confidence interval of population average\n Alternative hypothesis Ha : Pujara 's sample average is below the 95% confidence interval of population average\n\n Pujara 's Form Status: In-Form because the p value: 0.137319  is greater than alpha=  0.05 \n *******************************************************************************************\n\n"
checkBatsmanInForm("shubman.csv","S Gill")
## [1] "**************************** Form status of S Gill ****************************\n\n Population size: 23  Mean of population: 30.43 \n Sample size: 3  Mean of sample: 51.33 SD of sample: 66.88 \n\n Null hypothesis H0 : S Gill 's sample average is within 95% confidence interval of population average\n Alternative hypothesis Ha : S Gill 's sample average is below the 95% confidence interval of population average\n\n S Gill 's Form Status: In-Form because the p value: 0.687033  is greater than alpha=  0.05 \n *******************************************************************************************\n\n"

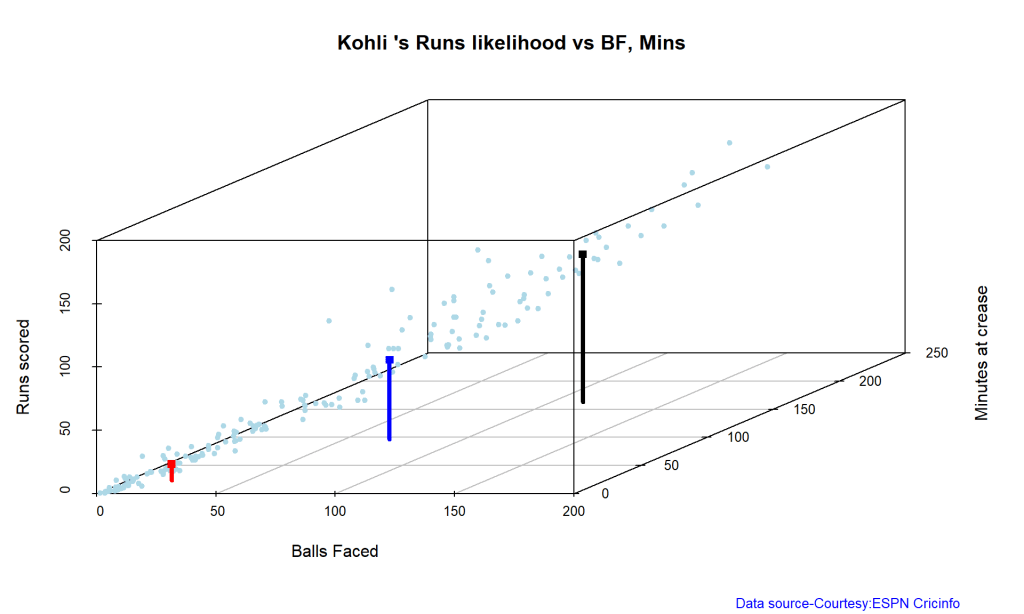
3q. Predicting Runs given Balls Faced and Minutes at Crease

A multi-variate regression plane is fitted between Runs and Balls faced +Minutes at crease.

BF <- seq( 10, 400,length=15)
Mins <- seq(30,600,length=15)
newDF <- data.frame(BF,Mins)
kohli1 <- batsmanRunsPredict("kohli.csv","Kohli",newdataframe=newDF)
rohit1 <- batsmanRunsPredict("rohit.csv","Rohit",newdataframe=newDF)
pujara1 <- batsmanRunsPredict("pujara.csv","Pujara",newdataframe=newDF)
rahane1 <- batsmanRunsPredict("rahane.csv","Rahane",newdataframe=newDF)
sgill1 <- batsmanRunsPredict("shubman.csv","S Gill",newdataframe=newDF)
batsmen <-cbind(round(kohli1$Runs),round(rohit1$Runs),round(pujara1$Runs),round(rahane1$Runs),round(sgill1$Runs))
colnames(batsmen) <- c("Kohli","Rohit","Pujara","Rahane","S Gill")
newDF <- data.frame(round(newDF$BF),round(newDF$Mins))
colnames(newDF) <- c("BallsFaced","MinsAtCrease")
predictedRuns <- cbind(newDF,batsmen)
predictedRuns
##    BallsFaced MinsAtCrease Kohli Rohit Pujara Rahane S Gill
## 1          10           30     6     3      3      2      7
## 2          38           71    24    19     16     17     24
## 3          66          111    41    35     29     31     40
## 4          94          152    58    51     42     45     56
## 5         121          193    76    66     55     59     73
## 6         149          234    93    82     68     74     89
## 7         177          274   110    98     80     88    106
## 8         205          315   128   114     93    102    122
## 9         233          356   145   129    106    116    139
## 10        261          396   163   145    119    130    155
## 11        289          437   180   161    132    145    171
## 12        316          478   197   177    144    159    188
## 13        344          519   215   192    157    173    204
## 14        372          559   232   208    170    187    221
## 15        400          600   249   224    183    202    237

4. Analysis of India WTC batsmen from Jan 2016 – May 2023 against Australia

4a. Relative cumulative average

Against Australia specifically between 2016 – 2023, Pujara has the best record followed by Rahane, with Gill in hot pursuit. Kohli and Rohit trail behind

frames <- list("kohliTestAus.csv","rohitTestAus.csv","pujaraTestAus.csv","rahaneTestAus.csv","shubmanTestAus.csv")
names <- list("Kohli","Rohit","Pujara","Rahane","S Gill")
relativeBatsmanCumulativeAvgRuns(frames,names)
4b. Relative cumulative average strike rate in career

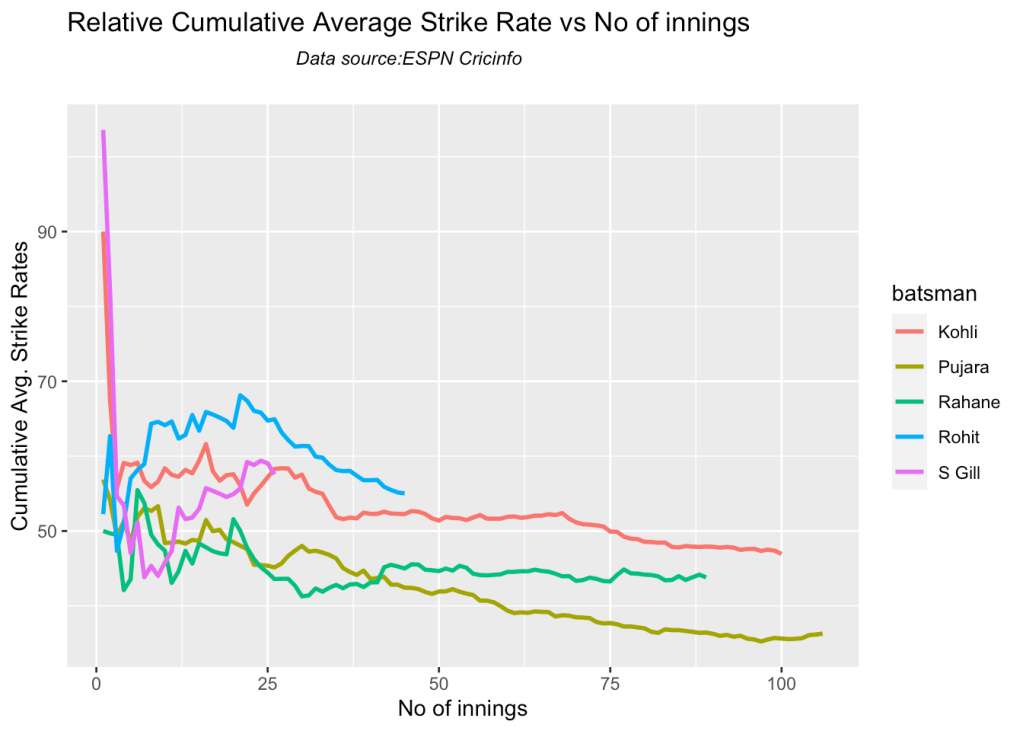
In the Strike Rate department Gill tops followed by Rohit and Rahane

frames <- list("kohliTestAus.csv","rohitTestAus.csv","pujaraTestAus.csv","rahaneTestAus.csv","shubmanTestAus.csv")
names <- list("Kohli","Rohit","Pujara","Rahane","S Gill")
relativeBatsmanCumulativeStrikeRate(frames,names)
5. Analysis of Australia WTC batsmen from Jan 2016 – May 2023

5a Basic analyses

par(mfrow=c(3,3))
par(mar=c(4,4,2,2))
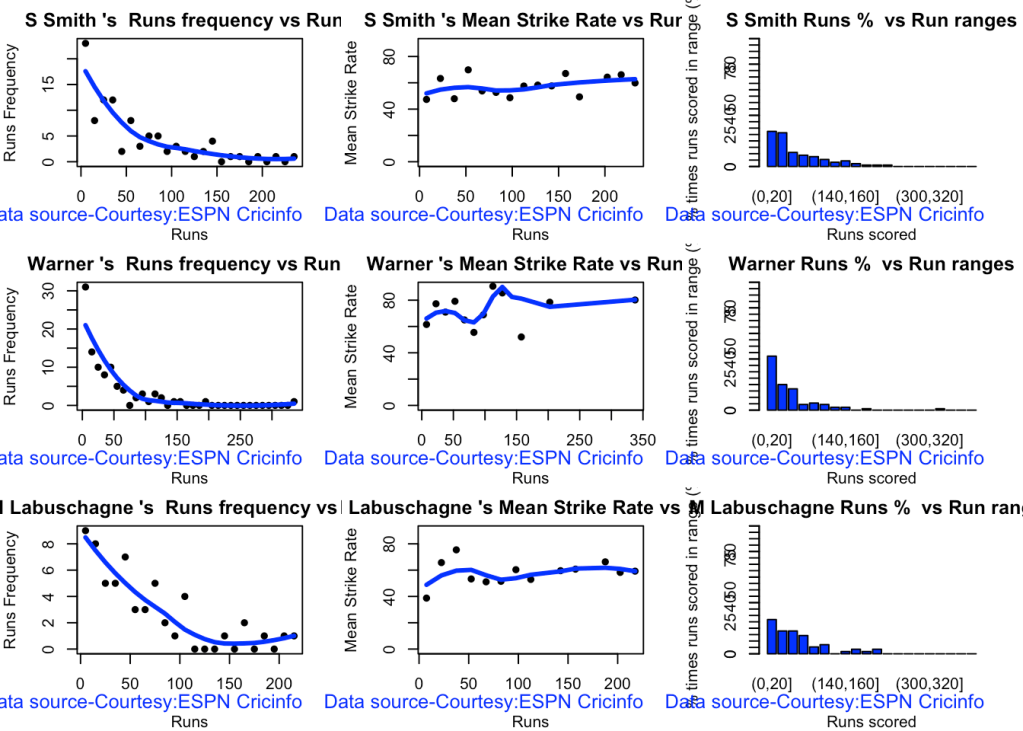
batsmanRunsFreqPerf("stevesmithTest.csv","S Smith")
batsmanMeanStrikeRate("stevesmithTest.csv","S Smith")
batsmanRunsRanges("stevesmithTest.csv","S Smith")

batsmanRunsFreqPerf("warnerTest.csv","Warner")
batsmanMeanStrikeRate("warnerTest.csv","Warner")
batsmanRunsRanges("warnerTest.csv","Warner")

batsmanRunsFreqPerf("labuschagneTest.csv","M Labuschagne")
batsmanMeanStrikeRate("labuschagneTest.csv","M Labuschagne")
batsmanRunsRanges("labuschagneTest.csv","M Labuschagne")
par(mfrow=c(2,3))
par(mar=c(4,4,2,2))
batsmanRunsFreqPerf("cgreenTest.csv","C Green")
batsmanMeanStrikeRate("cgreenTest.csv","C Green")
batsmanRunsRanges("cgreenTest.csv","C Green")

batsmanRunsFreqPerf("khwajaTest.csv","Khwaja")
batsmanMeanStrikeRate("khwajaTest.csv","Khwaja")
batsmanRunsRanges("khwajaTest.csv","Khwaja")

5b. More analyses

par(mfrow=c(3,3))
par(mar=c(4,4,2,2))
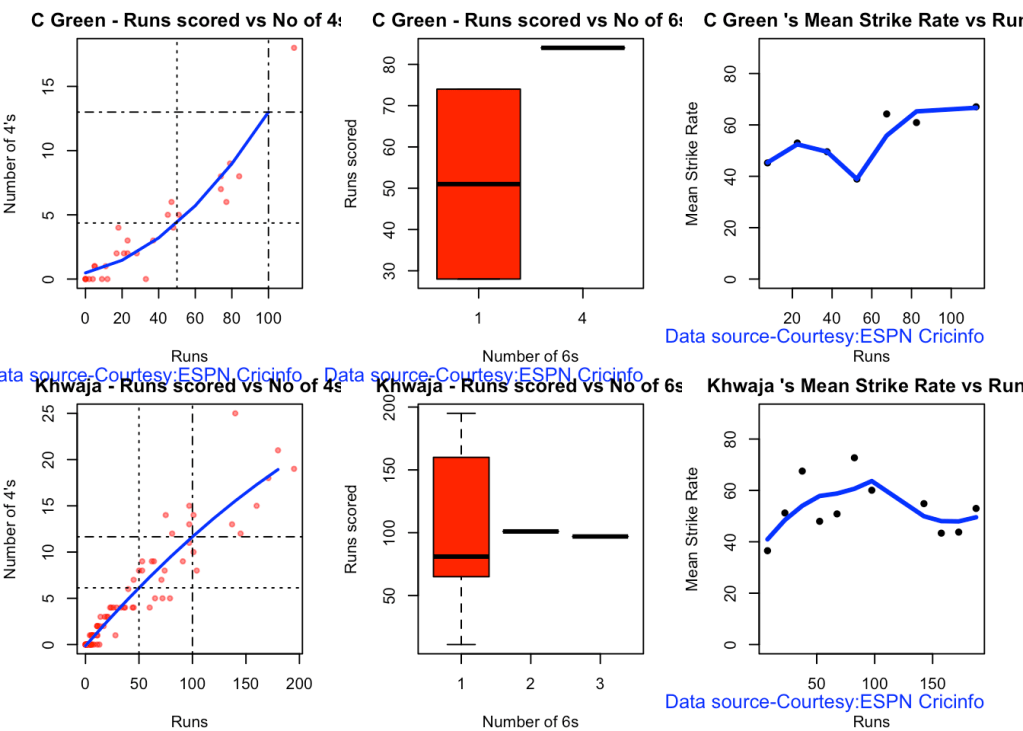
batsman4s("stevesmithTest.csv","S Smith")
batsman6s("stevesmithTest.csv","S Smith")
batsmanMeanStrikeRate("stevesmithTest.csv","S Smith")

batsman4s("warnerTest.csv","Warner")
batsman6s("warnerTest.csv","Warner")
batsmanMeanStrikeRate("warnerTest.csv","Warner")

batsman4s("labuschagneTest.csv","M Labuschagne")
batsman6s("labuschagneTest.csv","M Labuschagne")
batsmanMeanStrikeRate("labuschagneTest.csv","M Labuschagne")
par(mfrow=c(2,3))
par(mar=c(4,4,2,2))
batsman4s("cgreenTest.csv","C Green")
batsman6s("cgreenTest.csv","C Green")
batsmanMeanStrikeRate("cgreenTest.csv","C Green")

batsman4s("khwajaTest.csv","Khwaja")
batsman6s("khwajaTest.csv","Khwaja")
batsmanMeanStrikeRate("khwajaTest.csv","Khwaja")
5c.Boxplot histogram plot

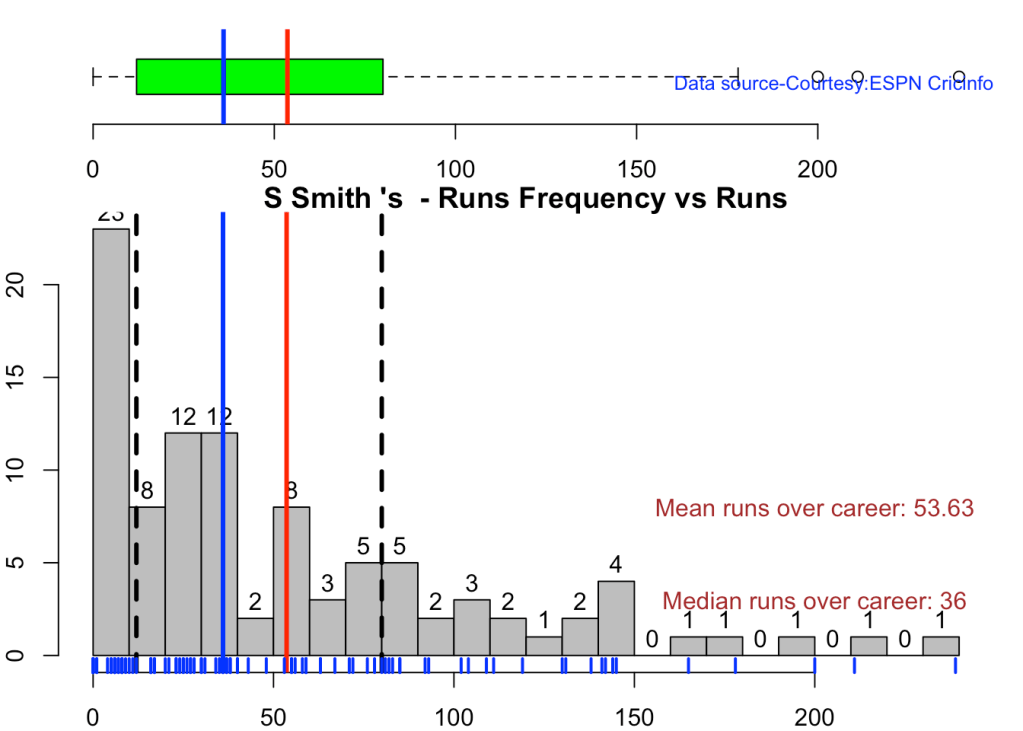
This plot shows a combined boxplot of the Runs ranges and a histog2ram of the Runs Frequency

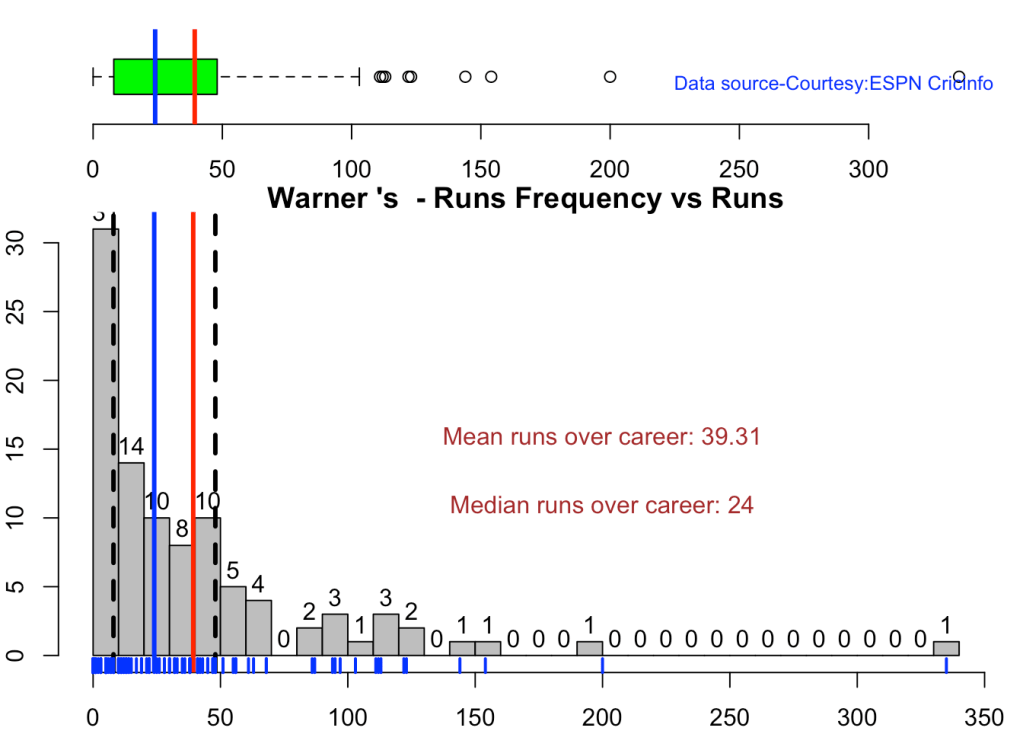
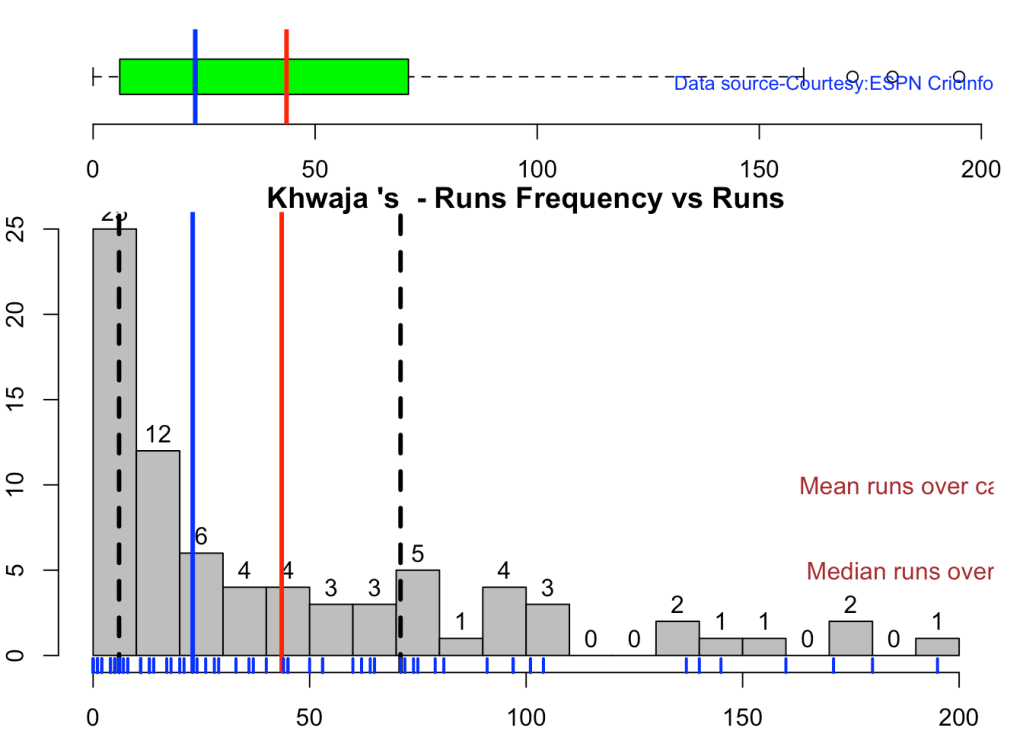
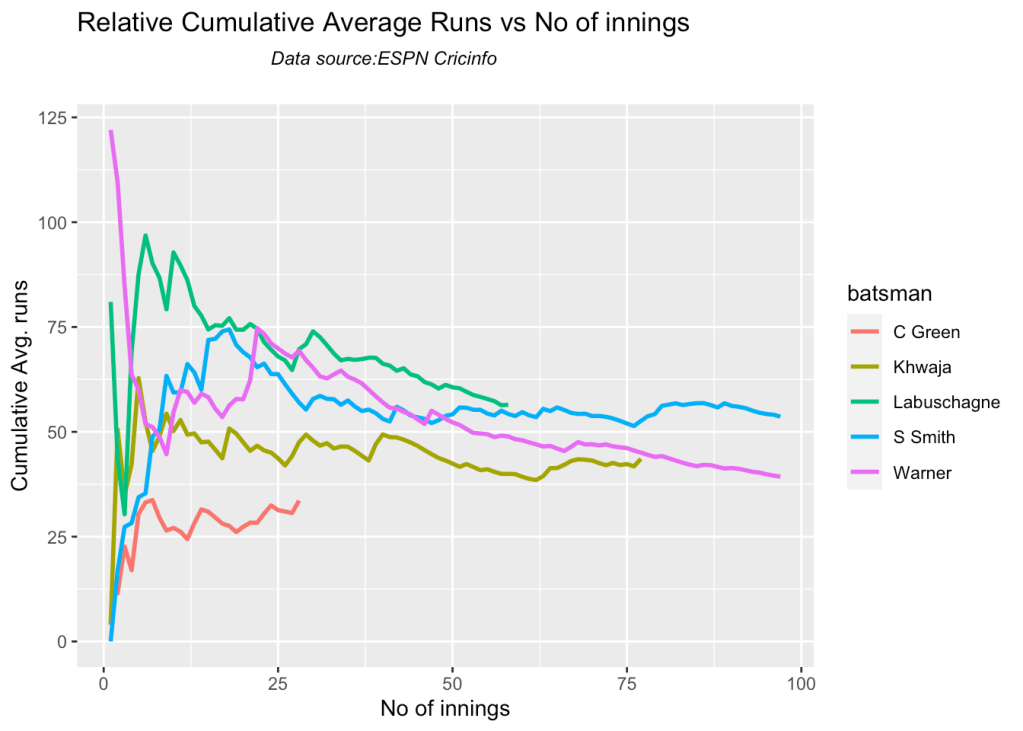
Smith, Labuschagne has an average of 53+ since 2016!! Warner & Khwaja are at ~46

batsmanPerfBoxHist("stevesmithTest.csv","S Smith")
batsmanPerfBoxHist("warnerTest.csv","Warner")
batsmanPerfBoxHist("labuschagneTest.csv","M Labuschagne")
batsmanPerfBoxHist("cgreenTest.csv","C Green")
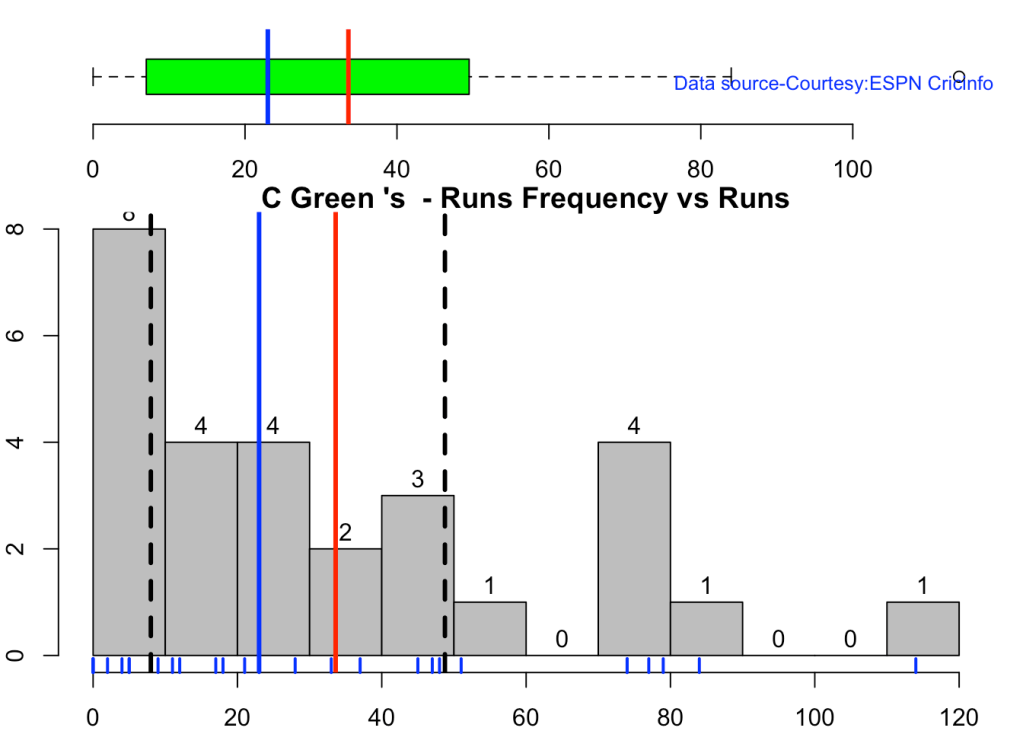
batsmanPerfBoxHist("khwajaTest.csv","Khwaja")
5d. Contribution to won and lost matches

For the 2 functions below you will have to use the getPlayerDataSp() function. Australia has won matches when Smith, Warner and Khwaja have played well.

par(mfrow=c(2,2))
par(mar=c(4,4,2,2))
batsmanContributionWonLost("stevesmithsp.csv","S Smith")
batsmanContributionWonLost("warnersp.csv","Warner")
batsmanContributionWonLost("labuschagnesp.csv","M Labuschagne")
batsmanContributionWonLost("cgreensp.csv","C Green")
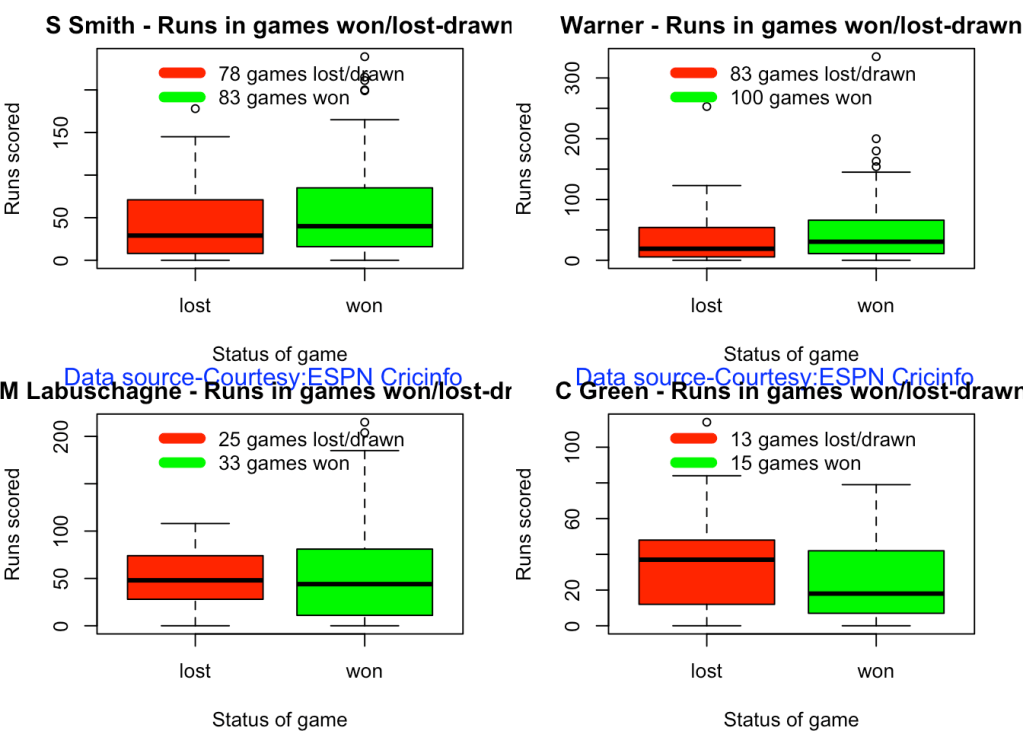
batsmanContributionWonLost("khwajasp.csv","Khwaja")

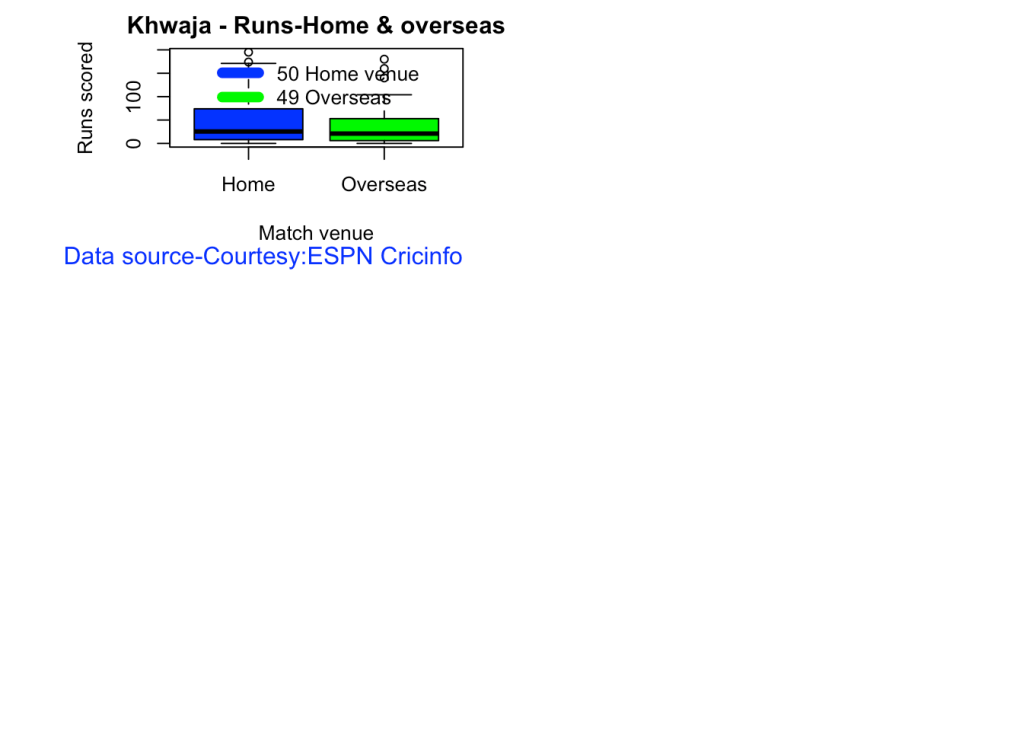
5e. Performance at home and overseas

This function also requires the use of getPlayerDataSp() as shown above. This can only be used for Test matches

par(mfrow=c(2,2))
par(mar=c(4,4,2,2))

batsmanPerfHomeAway("stevesmithsp.csv","S Smith")
batsmanPerfHomeAway("warnersp.csv","Warner")
batsmanPerfHomeAway("labuschagnesp.csv","M Labuschagne")
batsmanPerfHomeAway("cgreensp.csv","C Green")
batsmanPerfHomeAway("khwajasp.csv","Khwaja")
5f. Batsman average at different venues

par(mfrow=c(2,2))
par(mar=c(4,4,2,2))

batsmanAvgRunsGround("stevesmithTest.csv","S Smith")
batsmanAvgRunsGround("warnerTest.csv","Warner")
batsmanAvgRunsGround("labuschagneTest.csv","M Labuschagne")
batsmanAvgRunsGround("cgreenTest.csv","C Green")
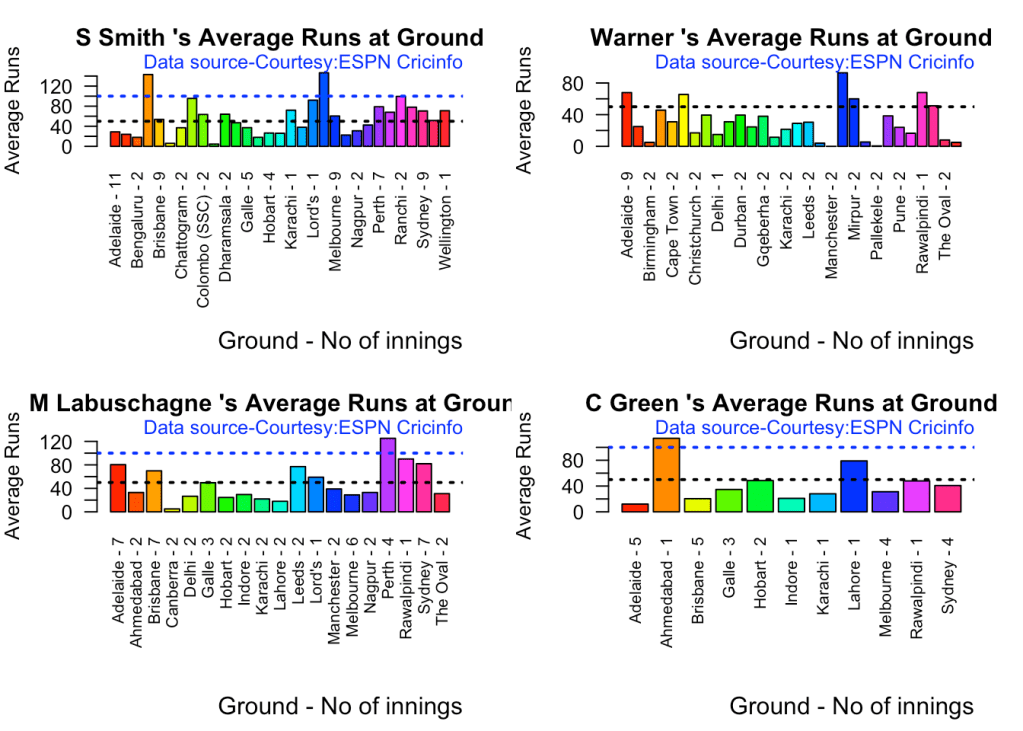
batsmanAvgRunsGround("khwajaTest.csv","Khwaja")
5g. Batsman average against different opposition

par(mfrow=c(2,2))
par(mar=c(4,4,2,2))

batsmanAvgRunsOpposition("stevesmithTest.csv","S Smith")
batsmanAvgRunsOpposition("warnerTest.csv","Warner")
batsmanAvgRunsOpposition("labuschagneTest.csv","M Labuschagne")
batsmanAvgRunsOpposition("khwajaTest.csv","Khwaja")
5h. Runs Likelihood of batsman

par(mfrow=c(2,2))
par(mar=c(4,4,2,2))

batsmanRunsLikelihood("stevesmithTest.csv","S Smith")
## Summary of  S Smith 's runs scoring likelihood
## **************************************************
## 
## There is a 58.76 % likelihood that S Smith  will make  21 Runs in  38 balls over 56  Minutes 
## There is a 24.74 % likelihood that S Smith  will make  70 Runs in  148 balls over  210  Minutes 
## There is a 16.49 % likelihood that S Smith  will make  148 Runs in  268 balls over 398  Minutes
batsmanRunsLikelihood("warnerTest.csv","Warner")
## Summary of  Warner 's runs scoring likelihood
## **************************************************
## 
## There is a 7.22 % likelihood that Warner  will make  155 Runs in  253 balls over 372  Minutes 
## There is a 62.89 % likelihood that Warner  will make  14 Runs in  21 balls over  32  Minutes 
## There is a 29.9 % likelihood that Warner  will make  65 Runs in  94 balls over 135  Minutes
batsmanRunsLikelihood("labuschagneTest.csv","M Labuschagne")
## Summary of  M Labuschagne 's runs scoring likelihood
## **************************************************
## 
## There is a 32.76 % likelihood that M Labuschagne  will make  74 Runs in  144 balls over 206  Minutes 
## There is a 55.17 % likelihood that M Labuschagne  will make  22 Runs in  37 balls over  54  Minutes 
## There is a 12.07 % likelihood that M Labuschagne  will make  168 Runs in  297 balls over 420  Minutes
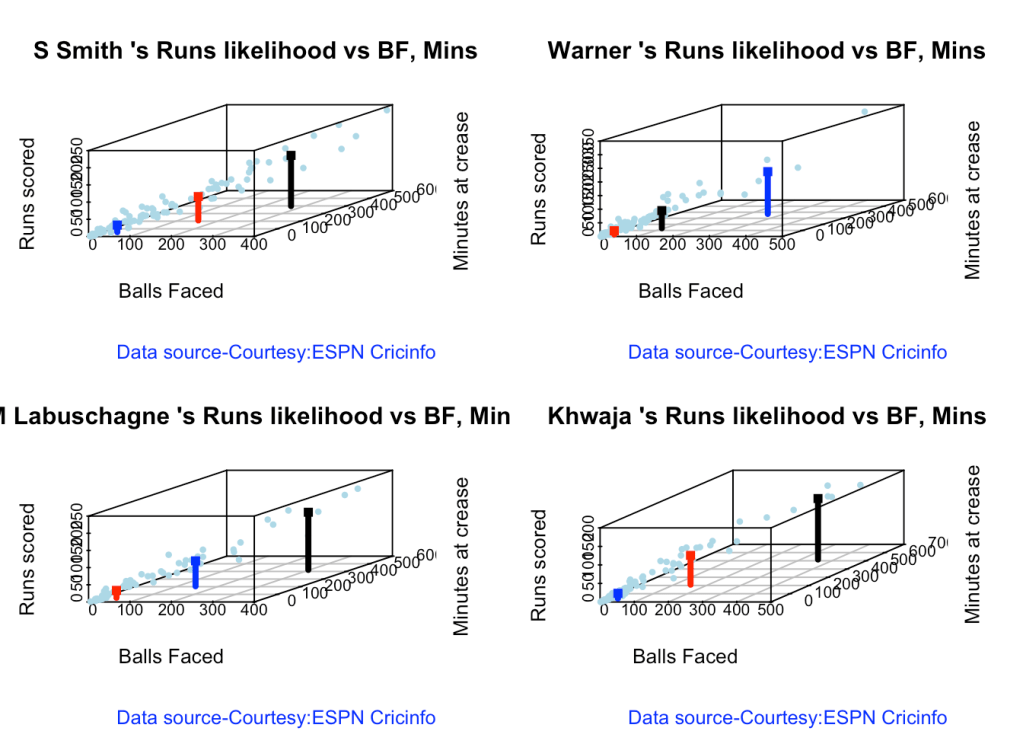
batsmanRunsLikelihood("khwajaTest.csv","Khwaja")
## Summary of  Khwaja 's runs scoring likelihood
## **************************************************
## 
## There is a 64.94 % likelihood that Khwaja  will make  14 Runs in  29 balls over 42  Minutes 
## There is a 27.27 % likelihood that Khwaja  will make  79 Runs in  148 balls over  210  Minutes 
## There is a 7.79 % likelihood that Khwaja  will make  165 Runs in  351 balls over 515  Minutes

5i. Moving average of batsman

Smith and Warner’s moving average has been on a downward trend lately. Khwaja is playing well

par(mfrow=c(2,2))
par(mar=c(4,4,2,2))

batsmanMovingAverage("stevesmith.csv","S Smith")
batsmanMovingAverage("warner.csv","Warner")
batsmanMovingAverage("labuschagne.csv","M Labuschagne")
batsmanMovingAverage("khwaja.csv","Khwaja")

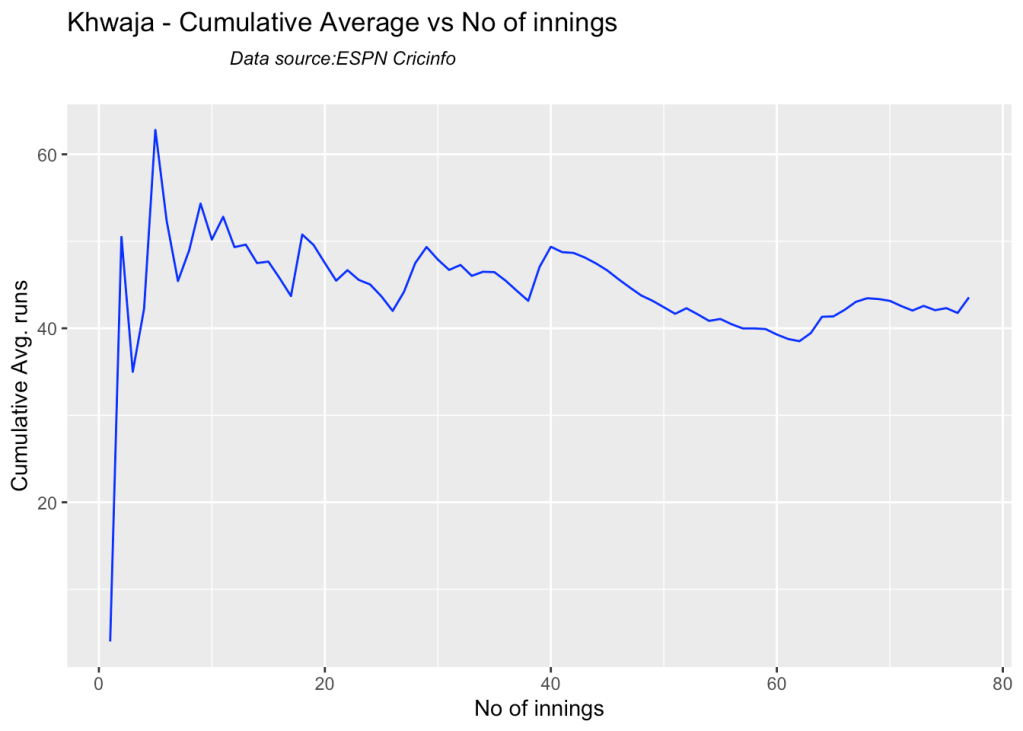
5j. Cumulative Average runs of batsman in career

Labuschagne, SMith and Warner havwe very good cumulative average

par(mfrow=c(2,2))
par(mar=c(4,4,2,2))

batsmanCumulativeAverageRuns("stevesmithTest.csv","S Smith")
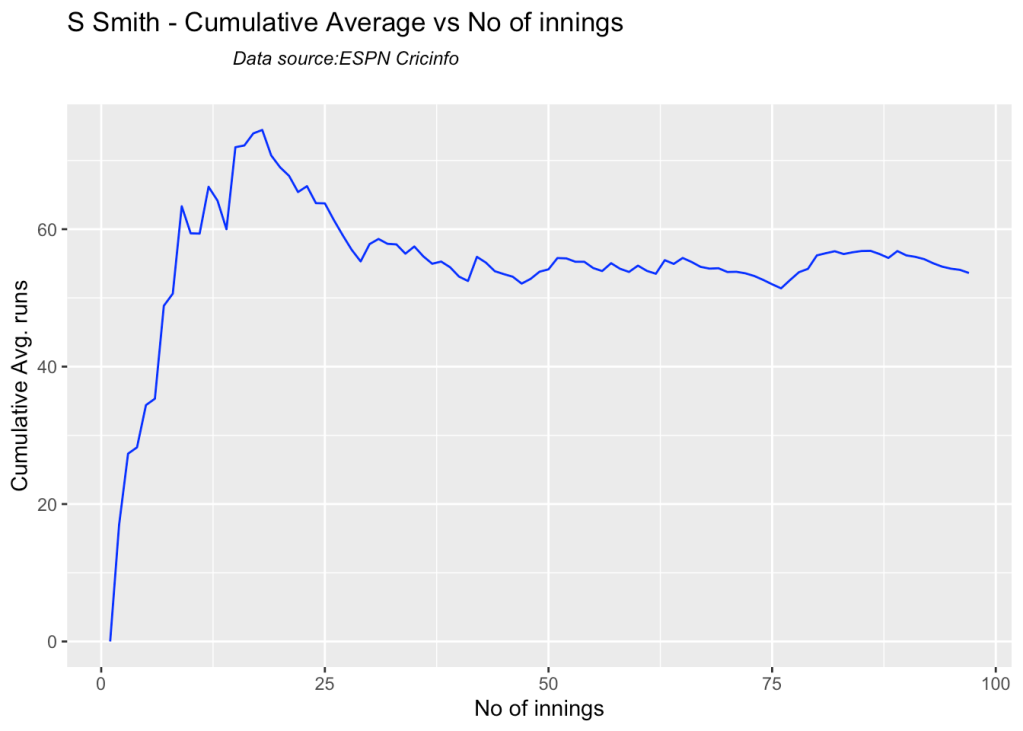
batsmanCumulativeAverageRuns("warnerTest.csv","Warner")
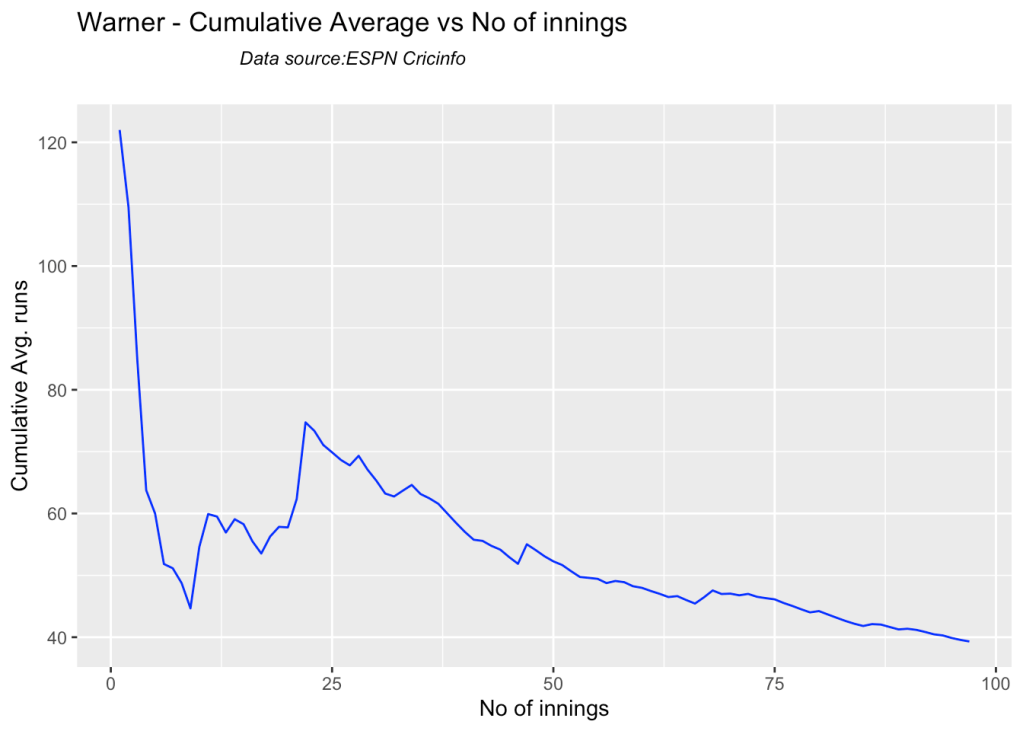
batsmanCumulativeAverageRuns("labuschagneTest.csv","M Labuschagne")
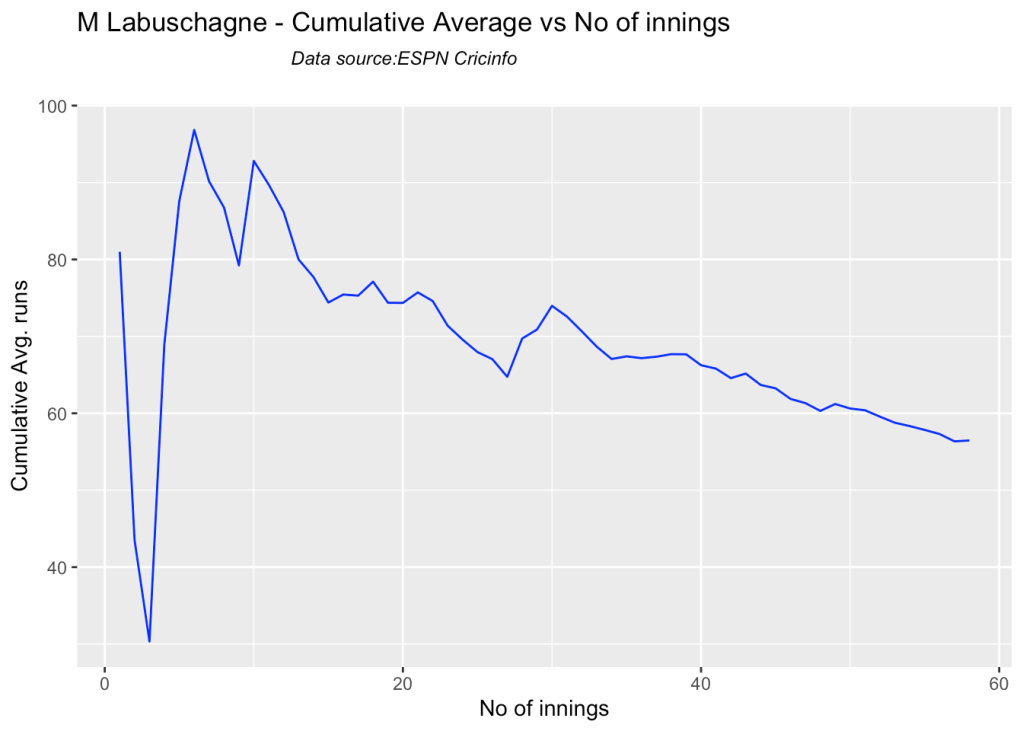
batsmanCumulativeAverageRuns("khwajaTest.csv","Khwaja")
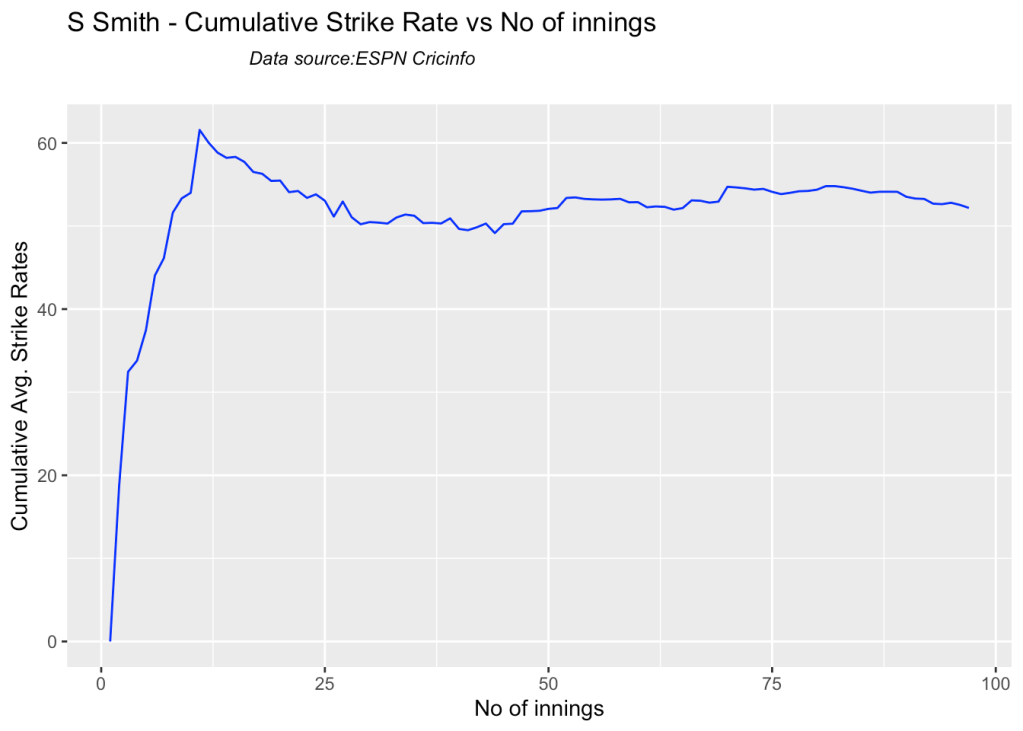
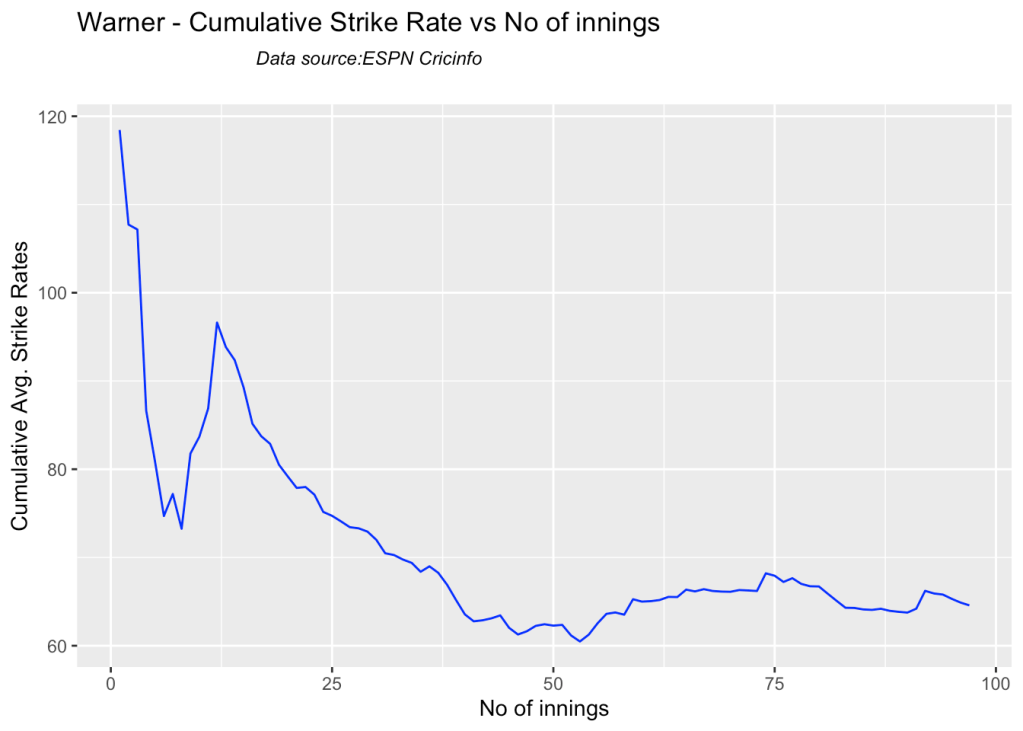
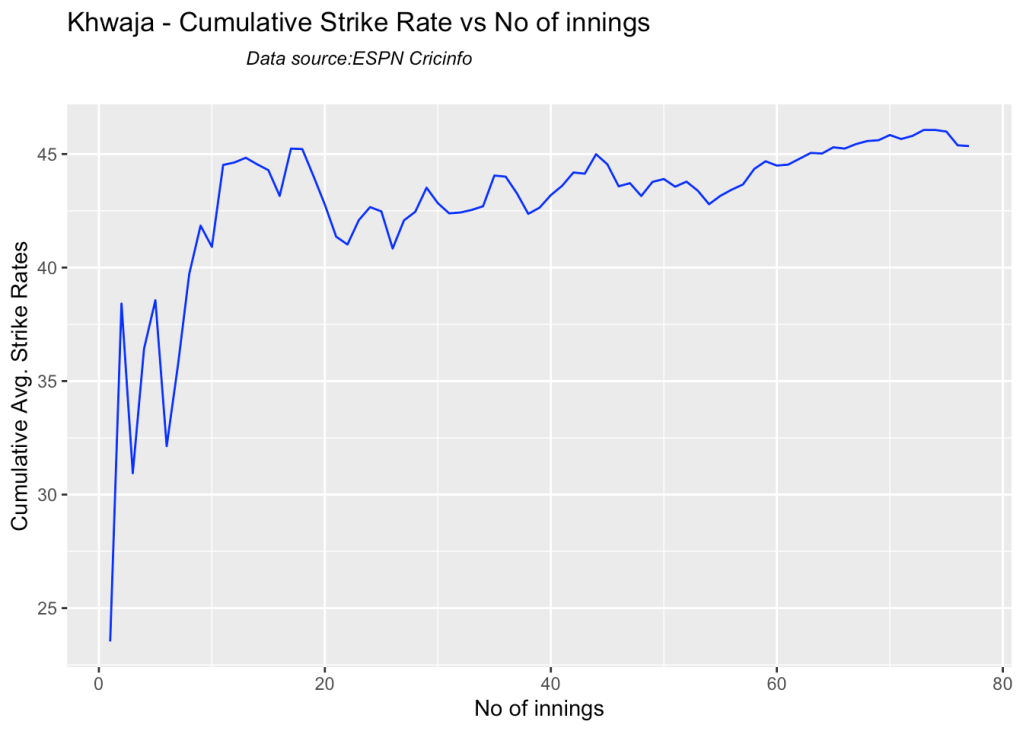
5k. Cumulative Average strike rate of batsman in career

Warner towers over the others in the cumulative strike rate, followed by Labuschagne and Smith

par(mfrow=c(2,2))
par(mar=c(4,4,2,2))

batsmanCumulativeStrikeRate("stevesmithTest.csv","S Smith")
batsmanCumulativeStrikeRate("warnerTest.csv","Warner")
batsmanCumulativeStrikeRate("labuschagneTest.csv","M Labuschagne")
batsmanCumulativeStrikeRate("khwajaTest.csv","Khwaja")
5l. Future Runs forecast

Here are plots that forecast how the batsman will perform in future. In this case 90% of the career runs trend is uses as the training set. the remaining 10% is the test set.

A Holt-Winters forecating model is used to forecast future performance based on the 90% training set. The forecated runs trend is plotted. The test set is also plotted to see how close the forecast and the actual matches

Take a look at the runs forecasted for the batsman below.

par(mfrow=c(2,2))
par(mar=c(4,4,2,2))

batsmanPerfForecast("stevesmithTest.csv","S Smith")
batsmanPerfForecast("warnerTest.csv","Warner")
batsmanPerfForecast("labuschagneTest.csv","M Labuschagne")
batsmanPerfForecast("khwajaTest.csv","Khwaja")

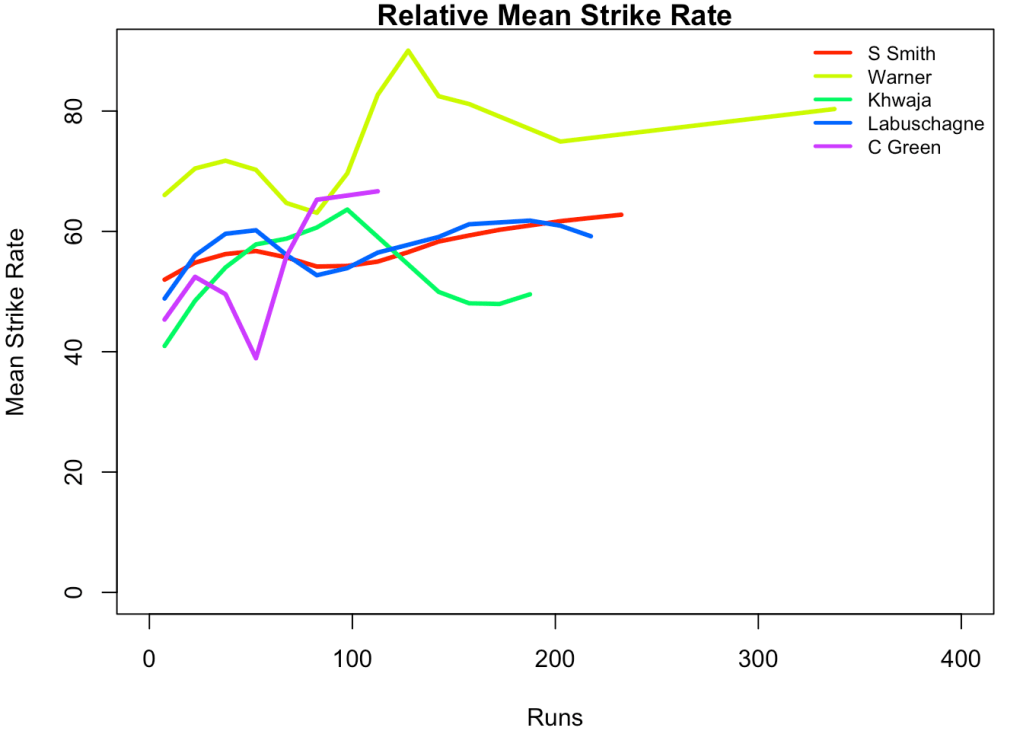
5m. Relative Mean Strike Rate plot

The plot below compares the Mean Strike Rate of the batsman for each of the runs ranges of 10 and plots them. The plot indicate the following

frames <- list("stevesmithTest.csv","warnerTest.csv","khwajaTest.csv","labuschagneTest.csv","cgreenTest.csv")
names <- list("S Smith","Warner","Khwaja","Labuschagne","C Green")
relativeBatsmanSR(frames,names)
5n. Relative Runs Frequency plot

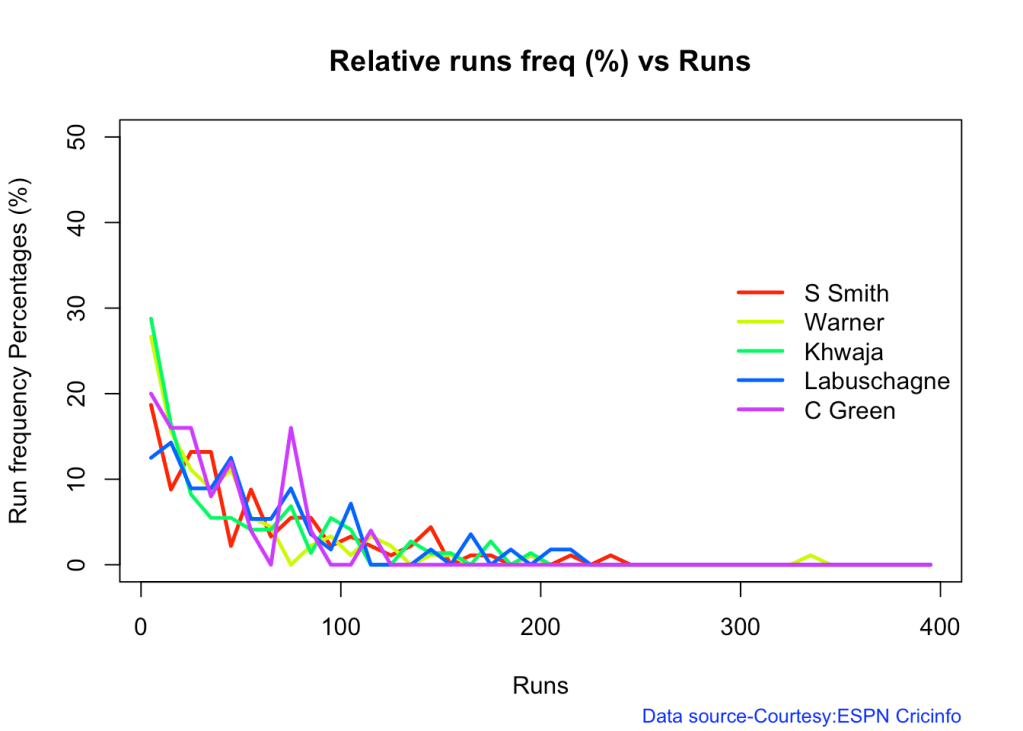
The plot below gives the relative Runs Frequency Percetages for each 10 run bucket. The plot below show

frames <- list("stevesmithTest.csv","warnerTest.csv","khwajaTest.csv","labuschagneTest.csv","cgreenTest.csv")
names <- list("S Smith","Warner","Khwaja","Labuschagne","C Green")
relativeRunsFreqPerf(frames,names)
5o. Relative cumulative average runs in career

frames <- list("stevesmithTest.csv","warnerTest.csv","khwajaTest.csv","labuschagneTest.csv","cgreenTest.csv")
names <- list("S Smith","Warner","Khwaja","Labuschagne","C Green")
relativeBatsmanCumulativeAvgRuns(frames,names)
5p. Relative cumulative average strike rate in career

frames <- list("stevesmithTest.csv","warnerTest.csv","khwajaTest.csv","labuschagneTest.csv","cgreenTest.csv")
names <- list("S Smith","Warner","Khwaja","Labuschagne","C Green")
relativeBatsmanCumulativeStrikeRate(frames,names)

5q. Check Batsman In-Form or Out-of-Form

The below computation uses Null Hypothesis testing and p-value to determine if the batsman is in-form or out-of-form. For this 90% of the career runs is chosen as the population and the mean computed. The last 10% is chosen to be the sample set and the sample Mean and the sample Standard Deviation are caculated.

The Null Hypothesis (H0) assumes that the batsman continues to stay in-form where the sample mean is within 95% confidence interval of population mean The Alternative (Ha) assumes that the batsman is out of form the sample mean is beyond the 95% confidence interval of the population mean.

A significance value of 0.05 is chosen and p-value us computed If p-value >= .05 – Batsman In-Form If p-value < 0.05 – Batsman Out-of-Form

Note Ideally the p-value should be done for a population that follows the Normal Distribution. But the runs population is usually left skewed. So some correction may be needed. I will revisit this later

This is done for the Top 4 batsman

checkBatsmanInForm("stevesmith.csv","S Smith")
## [1] "**************************** Form status of S Smith ****************************\n\n Population size: 144  Mean of population: 53.76 \n Sample size: 17  Mean of sample: 45.65 SD of sample: 56.4 \n\n Null hypothesis H0 : S Smith 's sample average is within 95% confidence interval of population average\n Alternative hypothesis Ha : S Smith 's sample average is below the 95% confidence interval of population average\n\n S Smith 's Form Status: In-Form because the p value: 0.280533  is greater than alpha=  0.05 \n *******************************************************************************************\n\n"
checkBatsmanInForm("warner.csv","Warner")
## [1] "**************************** Form status of Warner ****************************\n\n Population size: 164  Mean of population: 45.2 \n Sample size: 19  Mean of sample: 26.63 SD of sample: 44.62 \n\n Null hypothesis H0 : Warner 's sample average is within 95% confidence interval of population average\n Alternative hypothesis Ha : Warner 's sample average is below the 95% confidence interval of population average\n\n Warner 's Form Status: Out-of-Form because the p value: 0.042744  is less than alpha=  0.05 \n *******************************************************************************************\n\n"
checkBatsmanInForm("labuschagne.csv","M Labuschagne")
## [1] "**************************** Form status of M Labuschagne ****************************\n\n Population size: 52  Mean of population: 59.56 \n Sample size: 6  Mean of sample: 29.67 SD of sample: 19.96 \n\n Null hypothesis H0 : M Labuschagne 's sample average is within 95% confidence interval of population average\n Alternative hypothesis Ha : M Labuschagne 's sample average is below the 95% confidence interval of population average\n\n M Labuschagne 's Form Status: Out-of-Form because the p value: 0.005239  is less than alpha=  0.05 \n *******************************************************************************************\n\n"
checkBatsmanInForm("khwaja.csv","Khwaja")
## [1] "**************************** Form status of Khwaja ****************************\n\n Population size: 89  Mean of population: 41.62 \n Sample size: 10  Mean of sample: 53.1 SD of sample: 76.34 \n\n Null hypothesis H0 : Khwaja 's sample average is within 95% confidence interval of population average\n Alternative hypothesis Ha : Khwaja 's sample average is below the 95% confidence interval of population average\n\n Khwaja 's Form Status: In-Form because the p value: 0.677691  is greater than alpha=  0.05 \n *******************************************************************************************\n\n"

5r. Predicting Runs given Balls Faced and Minutes at Crease

A multi-variate regression plane is fitted between Runs and Balls faced +Minutes at crease.

BF <- seq( 10, 400,length=15)
Mins <- seq(30,600,length=15)
newDF <- data.frame(BF,Mins)
ssmith1 <- batsmanRunsPredict("stevesmith.csv","S Smith",newdataframe=newDF)
warner1 <- batsmanRunsPredict("warner.csv","Warner",newdataframe=newDF)
khwaja1 <- batsmanRunsPredict("khwaja.csv","Khwaja",newdataframe=newDF)
labuschagne1 <- batsmanRunsPredict("labuschagne.csv","Labuschagne",newdataframe=newDF)
cgreen1 <- batsmanRunsPredict("cgreen.csv","C Green",newdataframe=newDF)
batsmen <-cbind(round(ssmith1$Runs),round(warner1$Runs),round(khwaja1$Runs),round(labuschagne1$Runs),round(cgreen1$Runs))
colnames(batsmen) <- c("S Smith","Warner","Khwaja","Labuschagne","C Green")
newDF <- data.frame(round(newDF$BF),round(newDF$Mins))
colnames(newDF) <- c("BallsFaced","MinsAtCrease")
predictedRuns <- cbind(newDF,batsmen)
predictedRuns
##    BallsFaced MinsAtCrease S Smith Warner Khwaja Labuschagne C Green
## 1          10           30       7     10     10           9      13
## 2          38           71      23     30     24          24      29
## 3          66          111      38     50     38          40      44
## 4          94          152      53     70     53          55      60
## 5         121          193      69     90     67          70      75
## 6         149          234      84    110     81          85      91
## 7         177          274     100    130     95         100     106
## 8         205          315     115    150    109         116     122
## 9         233          356     130    170    123         131     137
## 10        261          396     146    190    137         146     153
## 11        289          437     161    210    151         161     168
## 12        316          478     177    230    165         176     184
## 13        344          519     192    250    179         192     199
## 14        372          559     207    270    193         207     215
## 15        400          600     223    290    207         222     230

6. Analysis of Australia WTC batsmen from Jan 2016 – May 2023 against India

6a. Relative cumulative average runs in career

Labuschagne, Smith and C Green have good records against India

frames <- list("stevesmithTestInd.csv","warnerTestInd.csv","khwajaTestInd.csv","labuschagneTestInd.csv","cgreenTestInd.csv")
names <- list("S Smith","Warner","Khwaja","Labuschagne","C Green")
relativeBatsmanCumulativeAvgRuns(frames,names)

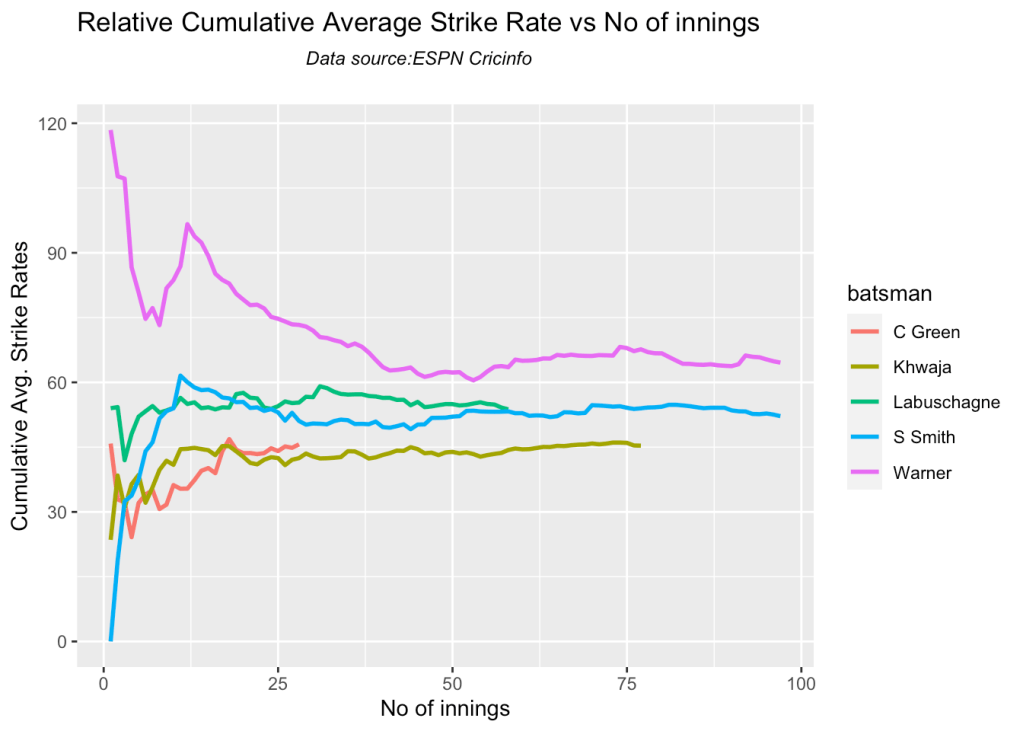
6b. Relative cumulative average strike rate in career

Warner, Labuschagne and Smith have a good strike rate against India

frames <- list("stevesmithTestInd.csv","warnerTestInd.csv","khwajaTestInd.csv","labuschagneTestInd.csv","cgreenTestInd.csv")
names <- list("S Smith","Warner","Khwaja","Labuschagne","C Green")
relativeBatsmanCumulativeStrikeRate(frames,names)
7. Analysis of India WTC bowlers from Jan 2016 – May 2023

7a Wickets frequency chart

par(mfrow=c(2,3))
par(mar=c(4,4,2,2))
bowlerWktsFreqPercent("shamiTest.csv","Shami")
bowlerWktsFreqPercent("sirajTest.csv","Siraj")
bowlerWktsFreqPercent("ashwinTest.csv","Ashwin")
bowlerWktsFreqPercent("jadejaTest.csv","Jadeja")
bowlerWktsFreqPercent("shardulTest.csv","Shardul")

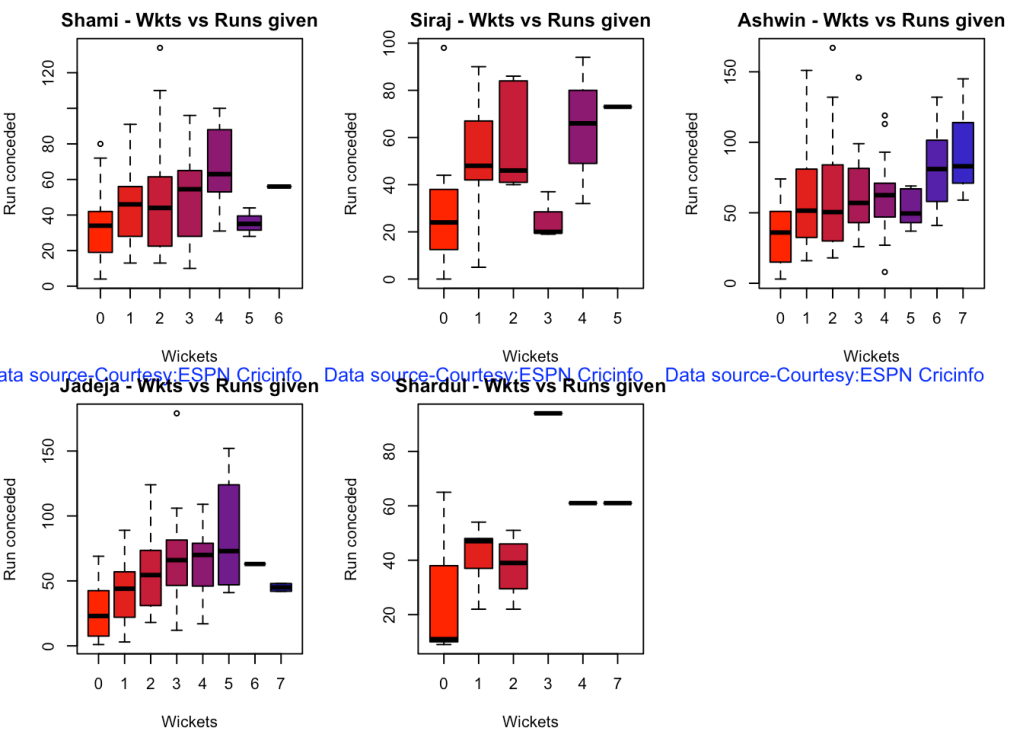
7b Wickets Runs chart

par(mfrow=c(2,3))
par(mar=c(4,4,2,2))

bowlerWktsRunsPlot("shamiTest.csv","Shami")
bowlerWktsRunsPlot("sirajTest.csv","Siraj")
bowlerWktsRunsPlot("ashwinTest.csv","Ashwin")
bowlerWktsRunsPlot("jadejaTest.csv","Jadeja")
bowlerWktsRunsPlot("shardulTest.csv","Shardul")
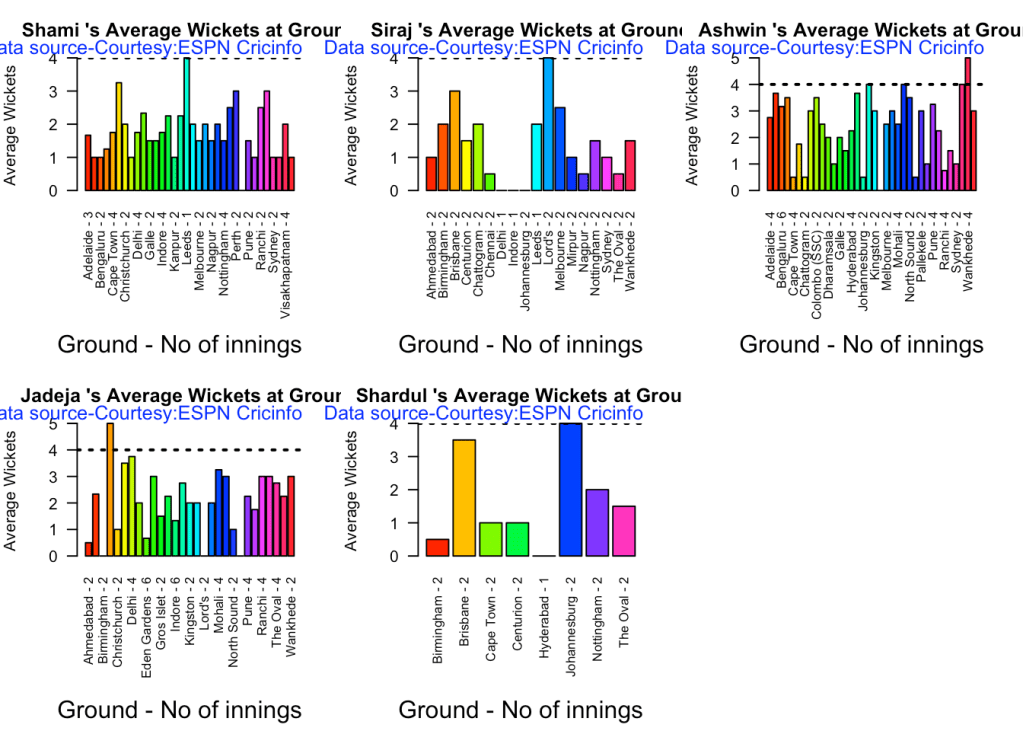
7c. Average wickets at different venues

par(mfrow=c(2,3))
par(mar=c(4,4,2,2))

bowlerAvgWktsGround("shamiTest.csv","Shami")
bowlerAvgWktsGround("sirajTest.csv","Siraj")
bowlerAvgWktsGround("ashwinTest.csv","Ashwin")
bowlerAvgWktsGround("jadejaTest.csv","Jadeja")
bowlerAvgWktsGround("shardulTest.csv","Shardul")
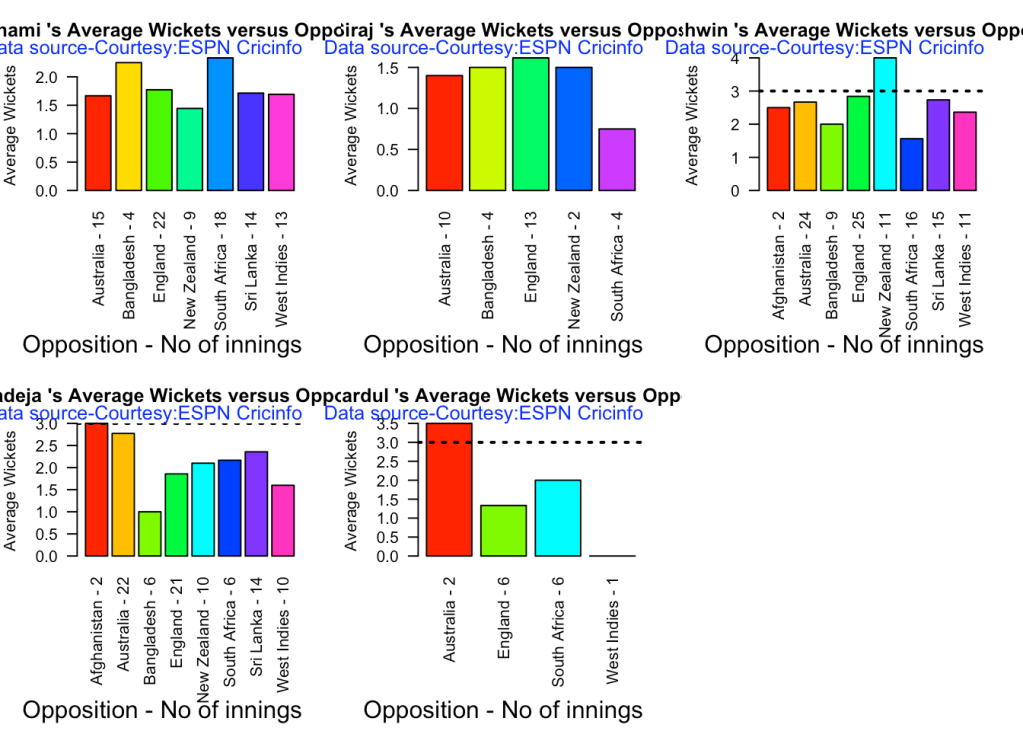
7d Average wickets against different opposition

par(mfrow=c(2,3))
par(mar=c(4,4,2,2))

bowlerAvgWktsOpposition("shamiTest.csv","Shami")
bowlerAvgWktsOpposition("sirajTest.csv","Siraj")
bowlerAvgWktsOpposition("ashwinTest.csv","Ashwin")
bowlerAvgWktsOpposition("jadejaTest.csv","Jadeja")
bowlerAvgWktsOpposition("shardulTest.csv","Shardul")
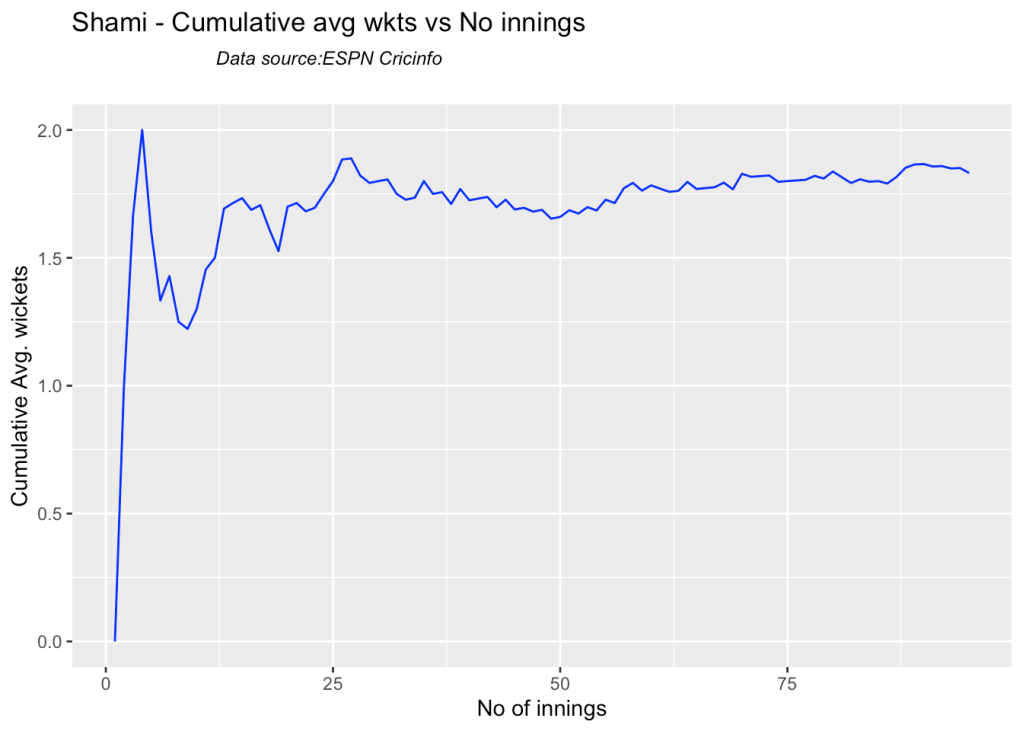
7e Cumulative average wickets taken

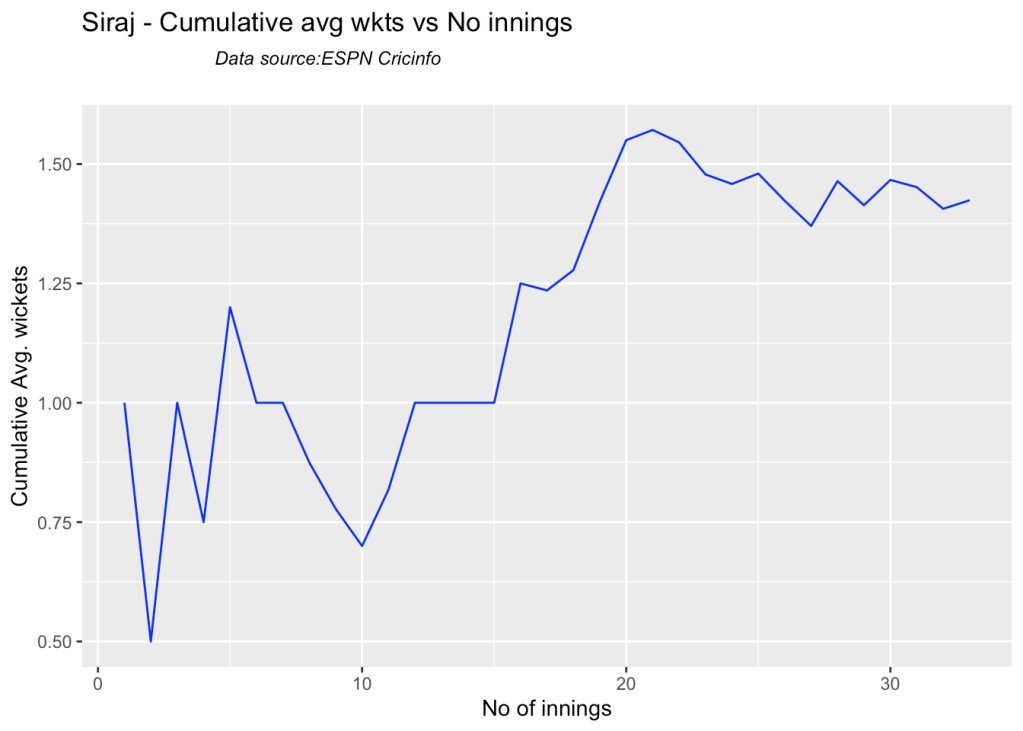
Ashwin’s performance has dropped over the years, while Siraj has been becoming better

par(mfrow=c(2,2))
par(mar=c(4,4,2,2))

bowlerCumulativeAvgWickets("shamiTest.csv","Shami")
bowlerCumulativeAvgWickets("sirajTest.csv","Siraj")
bowlerCumulativeAvgWickets("ashwinTest.csv","Ashwin")
bowlerCumulativeAvgWickets("jadejaTest.csv","Jadeja")
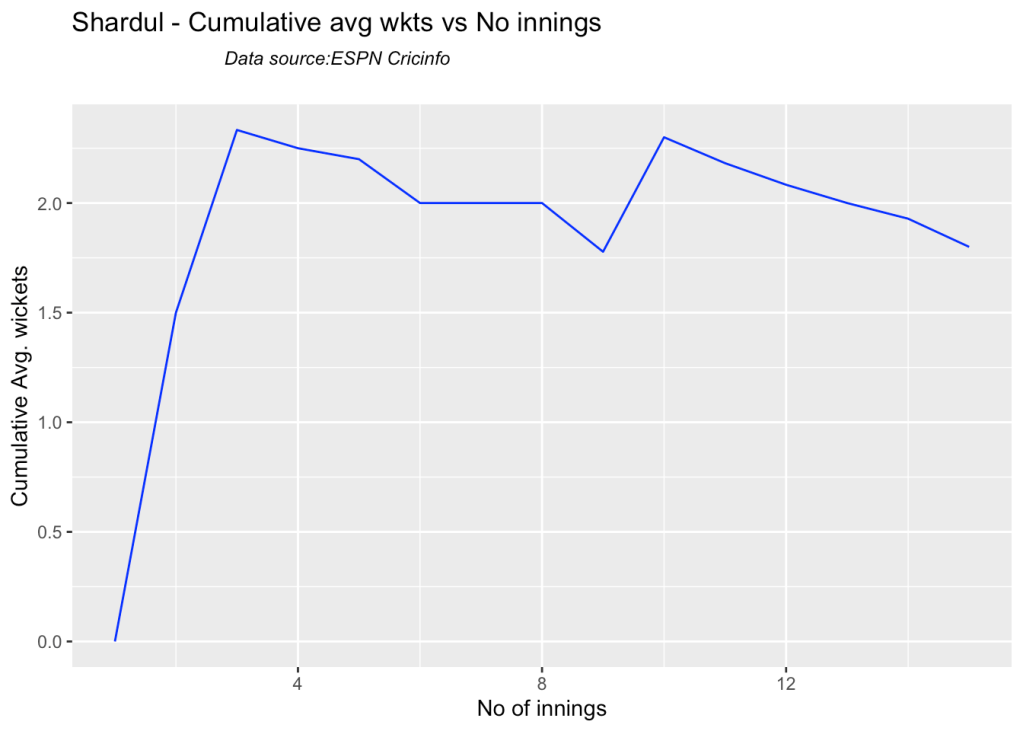
bowlerCumulativeAvgWickets("shardulTest.csv","Shardul")
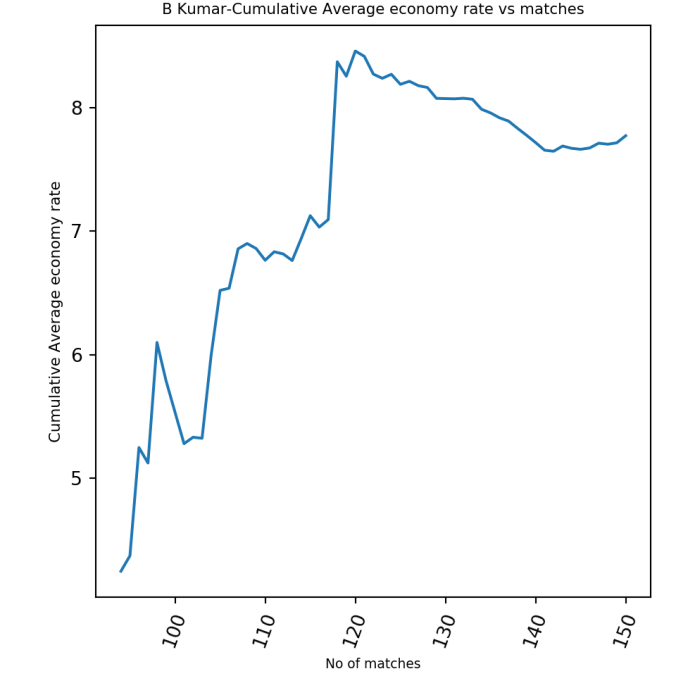
7g Cumulative average economy rate

par(mfrow=c(2,3))
par(mar=c(4,4,2,2))

bowlerCumulativeAvgEconRate("shamiTest.csv","Shami")
bowlerCumulativeAvgEconRate("sirajTest.csv","Siraj")
bowlerCumulativeAvgEconRate("ashwinTest.csv","Ashwin")
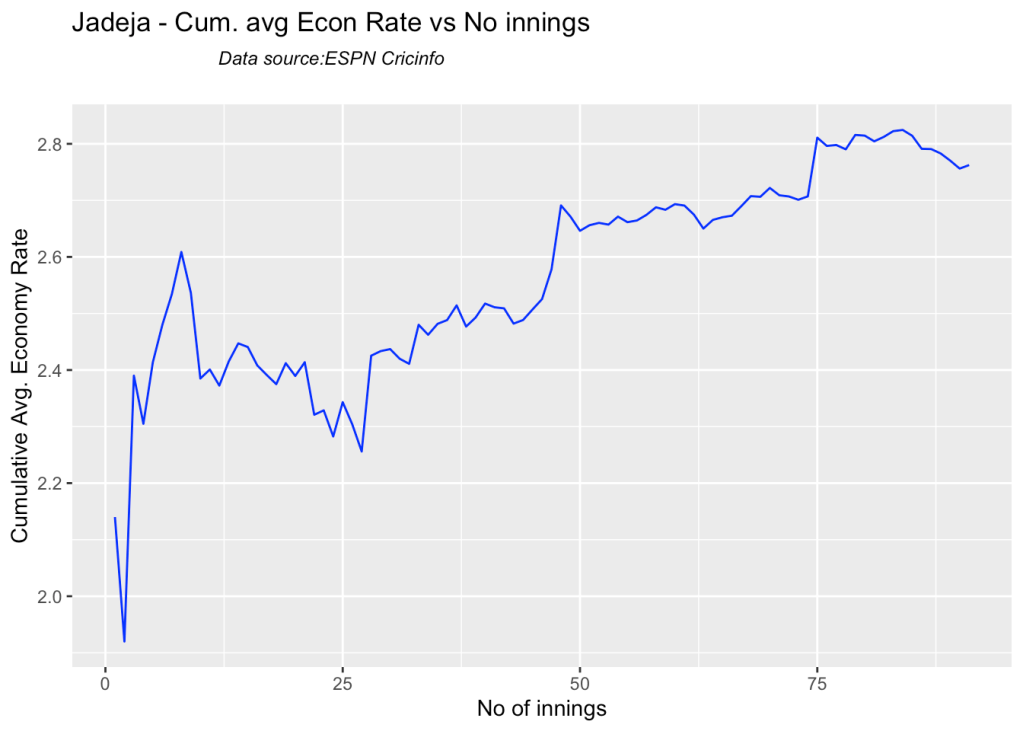
bowlerCumulativeAvgEconRate("jadejaTest.csv","Jadeja")
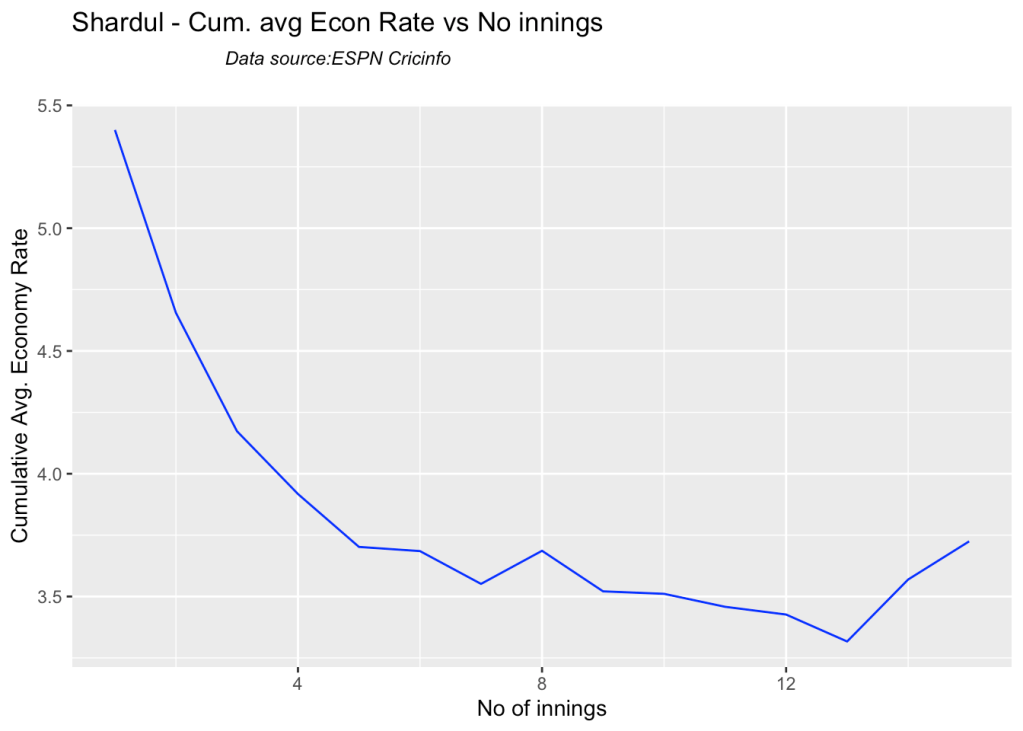
bowlerCumulativeAvgEconRate("shardulTest.csv","Shardul")
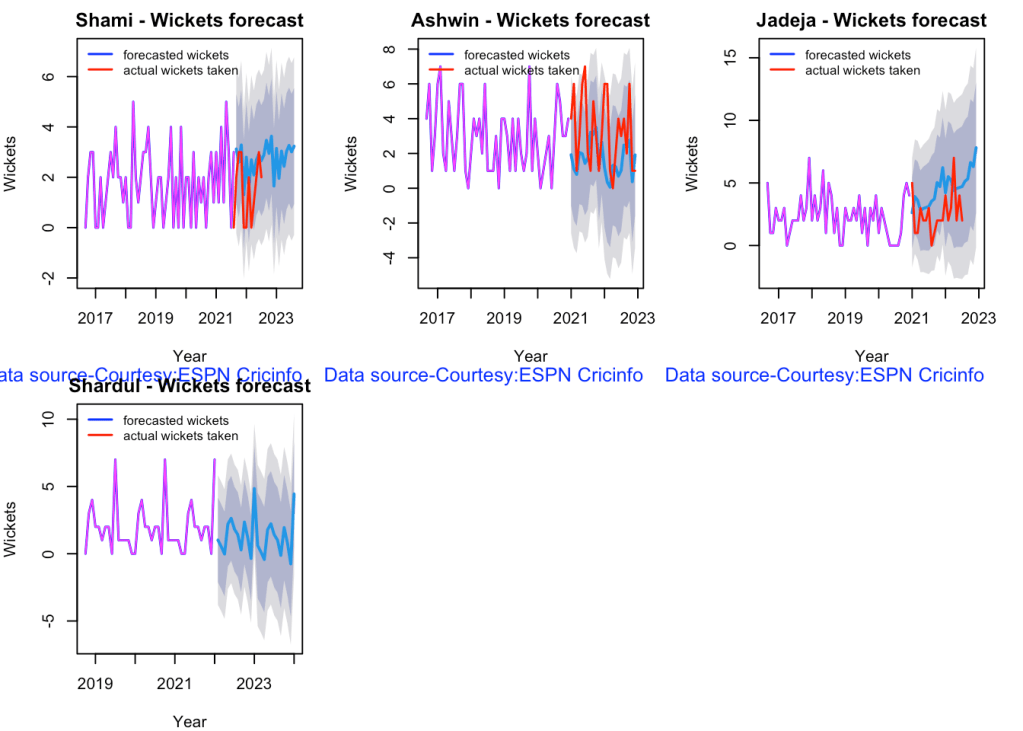
7h Wicket forecast

Here are plots that forecast how the bowler will perform in future. In this case 90% of the career wickets trend is used as the training set. the remaining 10% is the test set.

A Holt-Winters forecasting model is used to forecast future performance based on the 90% training set. The forecasted wickets trend is plotted. The test set is also plotted to see how close the forecast and the actual matches

par(mfrow=c(2,3))
par(mar=c(4,4,2,2))

bowlerPerfForecast("shamiTest.csv","Shami")
#bowlerPerfForecast("sirajTest.csv","Siraj")
bowlerPerfForecast("ashwinTest.csv","Ashwin")
bowlerPerfForecast("jadejaTest.csv","Jadeja")
bowlerPerfForecast("shardulTest.csv","Shardul")
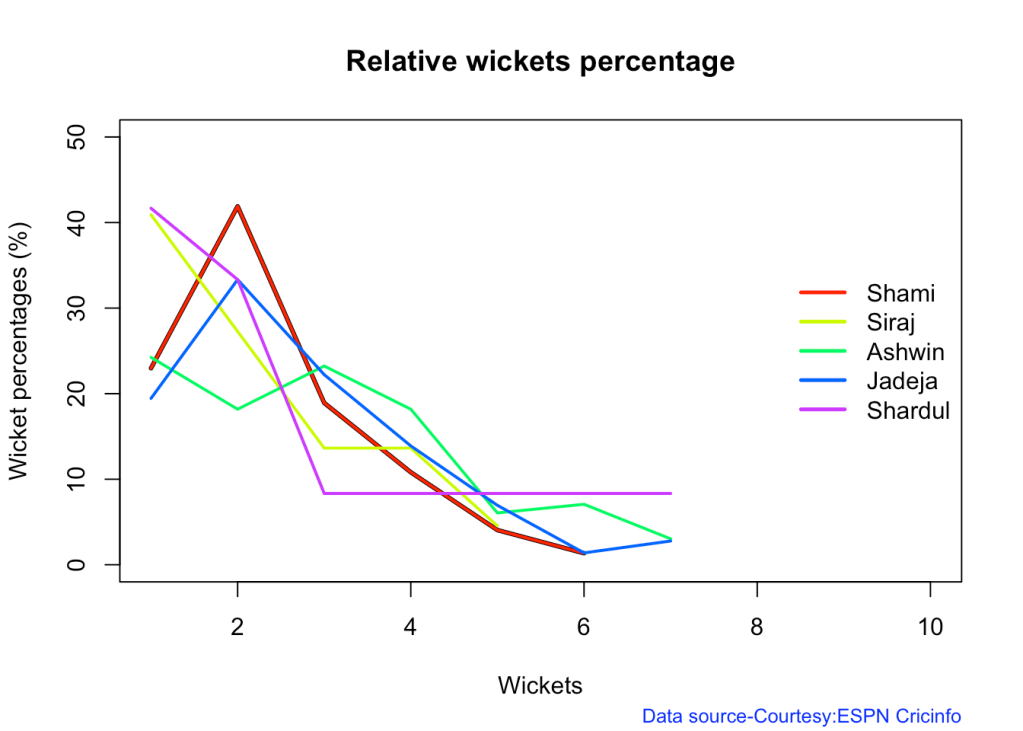
7i Relative Wickets Frequency Percentage

frames <- list("shamiTest.csv","sirajTest.csv","ashwinTest.csv","jadejaTest.csv","shardulTest.csv")
names <- list("Shami","Siraj","Ashwin","Jadeja","Shardul")
relativeBowlingPerf(frames,names)
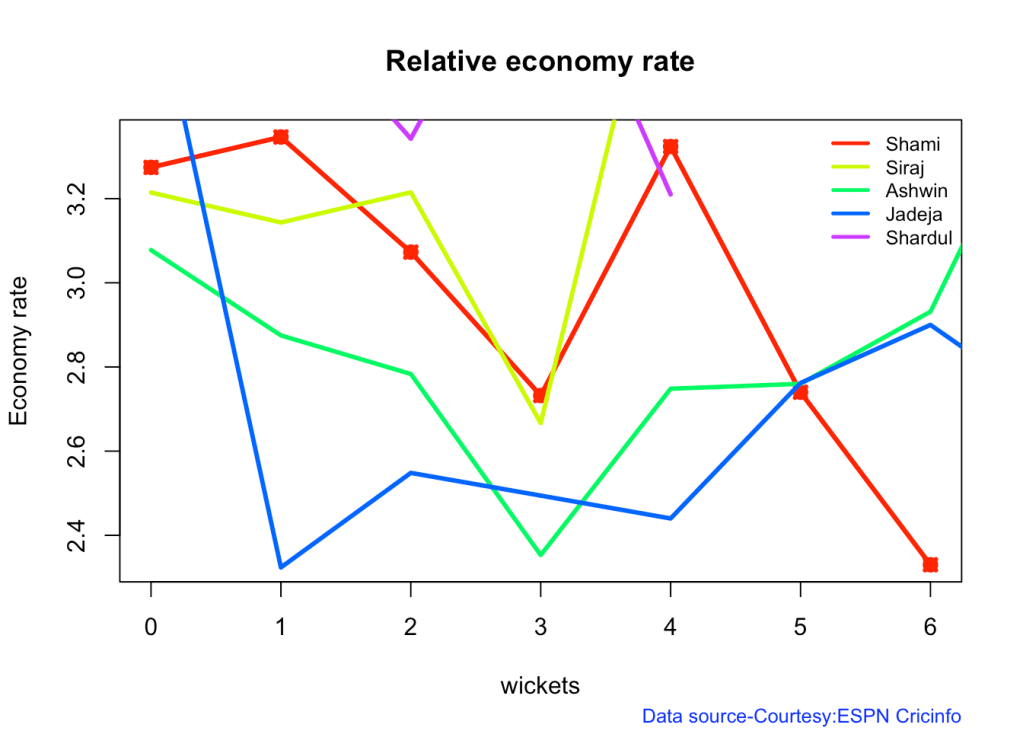
7j Relative Economy Rate against wickets taken

frames <- list("shamiTest.csv","sirajTest.csv","ashwinTest.csv","jadejaTest.csv","shardulTest.csv")
names <- list("Shami","Siraj","Ashwin","Jadeja","Shardul")
relativeBowlingER(frames,names)
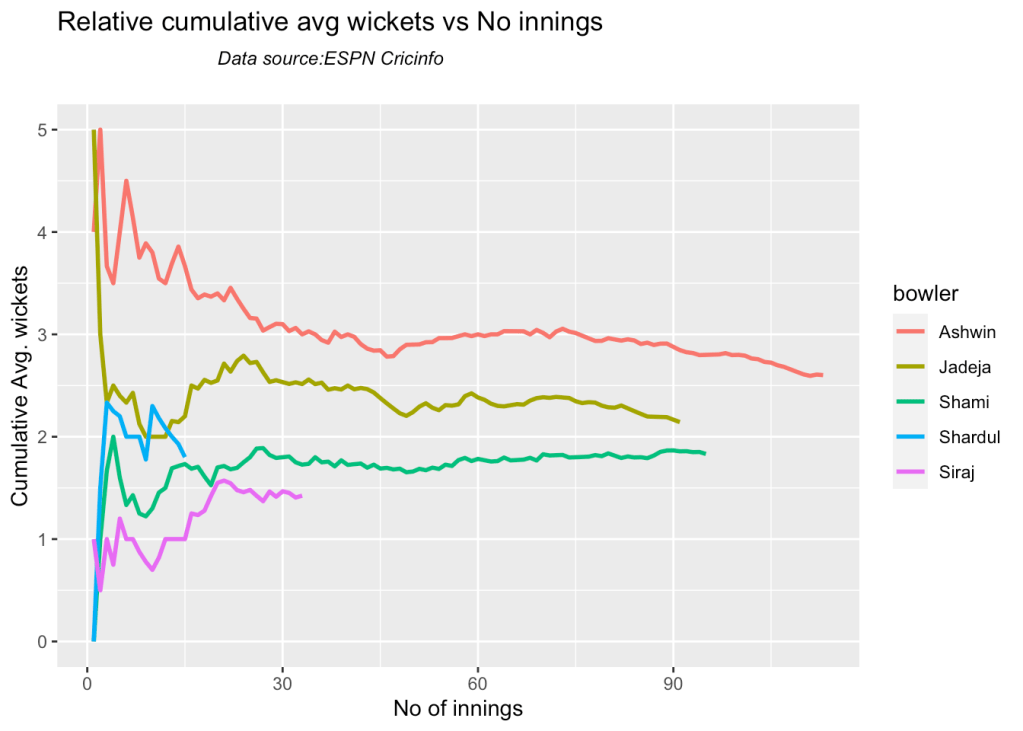
7k Relative cumulative average wickets of bowlers in career

Ashwin has the highest wickets followed by Jadeja against all teams

frames <- list("shamiTest.csv","sirajTest.csv","ashwinTest.csv","jadejaTest.csv","shardulTest.csv")
names <- list("Shami","Siraj","Ashwin","Jadeja","Shardul")
relativeBowlerCumulativeAvgWickets(frames,names)
7l Relative cumulative average economy rate of bowlers

Jadeja has the best economy rate followed by Ashwin

frames <- list("shamiTest.csv","sirajTest.csv","ashwinTest.csv","jadejaTest.csv","shardulTest.csv")
names <- list("Shami","Siraj","Ashwin","Jadeja","Shardul")
relativeBowlerCumulativeAvgEconRate(frames,names)

7m Check for bowler in-form/out-of-form

The below computation uses Null Hypothesis testing and p-value to determine if the bowler is in-form or out-of-form. For this 90% of the career wickets is chosen as the population and the mean computed. The last 10% is chosen to be the sample set and the sample Mean and the sample Standard Deviation are caculated.

The Null Hypothesis (H0) assumes that the bowler continues to stay in-form where the sample mean is within 95% confidence interval of population mean The Alternative (Ha) assumes that the bowler is out of form the sample mean is beyond the 95% confidence interval of the population mean.

A significance value of 0.05 is chosen and p-value us computed If p-value >= .05 – Batsman In-Form If p-value < 0.05 – Batsman Out-of-Form

Note Ideally the p-value should be done for a population that follows the Normal Distribution. But the runs population is usually left skewed. So some correction may be needed. I will revisit this later

Note: The check for the form status of the bowlers indicate

checkBowlerInForm("shami.csv","Shami")
## [1] "**************************** Form status of Shami ****************************\n\n Population size: 106  Mean of population: 1.93 \n Sample size: 12  Mean of sample: 1.33 SD of sample: 1.23 \n\n Null hypothesis H0 : Shami 's sample average is within 95% confidence interval \n        of population average\n Alternative hypothesis Ha : Shami 's sample average is below the 95% confidence\n        interval of population average\n\n Shami 's Form Status: In-Form because the p value: 0.058427  is greater than alpha=  0.05 \n *******************************************************************************************\n\n"
checkBowlerInForm("siraj.csv","Siraj")
## [1] "**************************** Form status of Siraj ****************************\n\n Population size: 29  Mean of population: 1.59 \n Sample size: 4  Mean of sample: 0.25 SD of sample: 0.5 \n\n Null hypothesis H0 : Siraj 's sample average is within 95% confidence interval \n        of population average\n Alternative hypothesis Ha : Siraj 's sample average is below the 95% confidence\n        interval of population average\n\n Siraj 's Form Status: Out-of-Form because the p value: 0.002923  is less than alpha=  0.05 \n *******************************************************************************************\n\n"
checkBowlerInForm("ashwin.csv","Ashwin")
## [1] "**************************** Form status of Ashwin ****************************\n\n Population size: 154  Mean of population: 2.77 \n Sample size: 18  Mean of sample: 2.44 SD of sample: 1.76 \n\n Null hypothesis H0 : Ashwin 's sample average is within 95% confidence interval \n        of population average\n Alternative hypothesis Ha : Ashwin 's sample average is below the 95% confidence\n        interval of population average\n\n Ashwin 's Form Status: In-Form because the p value: 0.218345  is greater than alpha=  0.05 \n *******************************************************************************************\n\n"
checkBowlerInForm("jadeja.csv","Jadeja")
## [1] "**************************** Form status of Jadeja ****************************\n\n Population size: 108  Mean of population: 2.22 \n Sample size: 12  Mean of sample: 1.92 SD of sample: 2.35 \n\n Null hypothesis H0 : Jadeja 's sample average is within 95% confidence interval \n        of population average\n Alternative hypothesis Ha : Jadeja 's sample average is below the 95% confidence\n        interval of population average\n\n Jadeja 's Form Status: In-Form because the p value: 0.333095  is greater than alpha=  0.05 \n *******************************************************************************************\n\n"
checkBowlerInForm("shardul.csv","Shardul")
## [1] "**************************** Form status of Shardul ****************************\n\n Population size: 13  Mean of population: 2 \n Sample size: 2  Mean of sample: 0.5 SD of sample: 0.71 \n\n Null hypothesis H0 : Shardul 's sample average is within 95% confidence interval \n        of population average\n Alternative hypothesis Ha : Shardul 's sample average is below the 95% confidence\n        interval of population average\n\n Shardul 's Form Status: Out-of-Form because the p value: 0.04807  is less than alpha=  0.05 \n *******************************************************************************************\n\n"

8. Analysis of India WTC bowlers from Jan 2016 – May 2023 against Australia

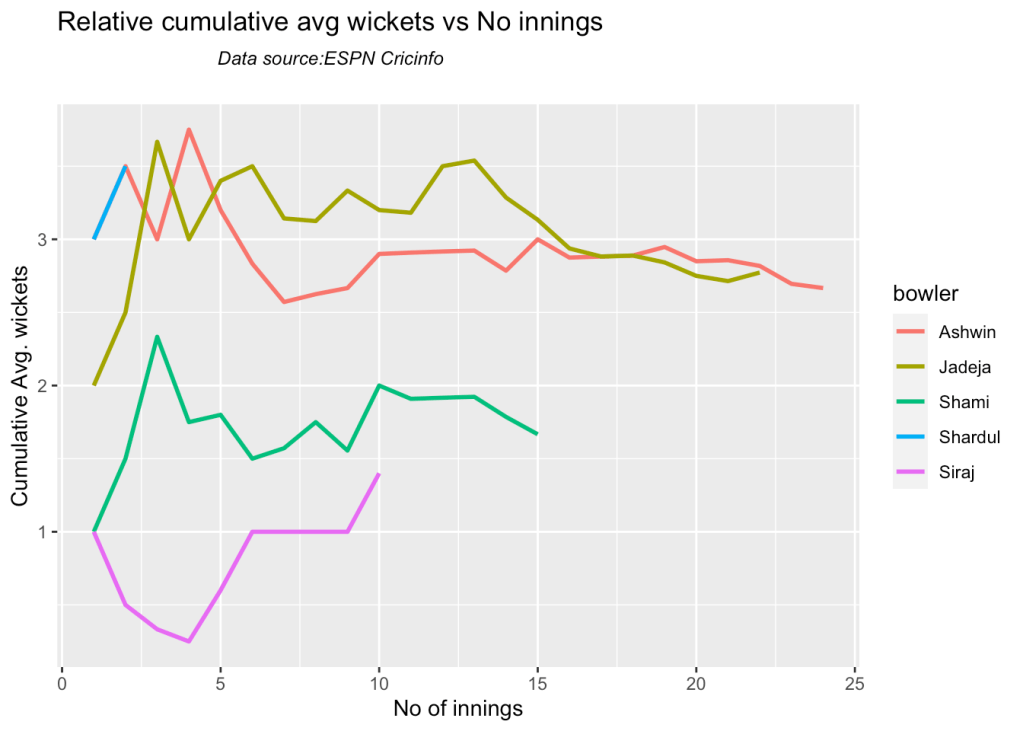
8a Relative cumulative average wickets of bowlers in career

Against Australia specifically Jadeja has the best record followed by Ashwin

frames <- list("shamiTestAus.csv","sirajTestAus.csv","ashwinTestAus.csv","jadejaTestAus.csv","shardulTestAus.csv")
names <- list("Shami","Siraj","Ashwin","Jadeja","Shardul")
relativeBowlerCumulativeAvgWickets(frames,names)
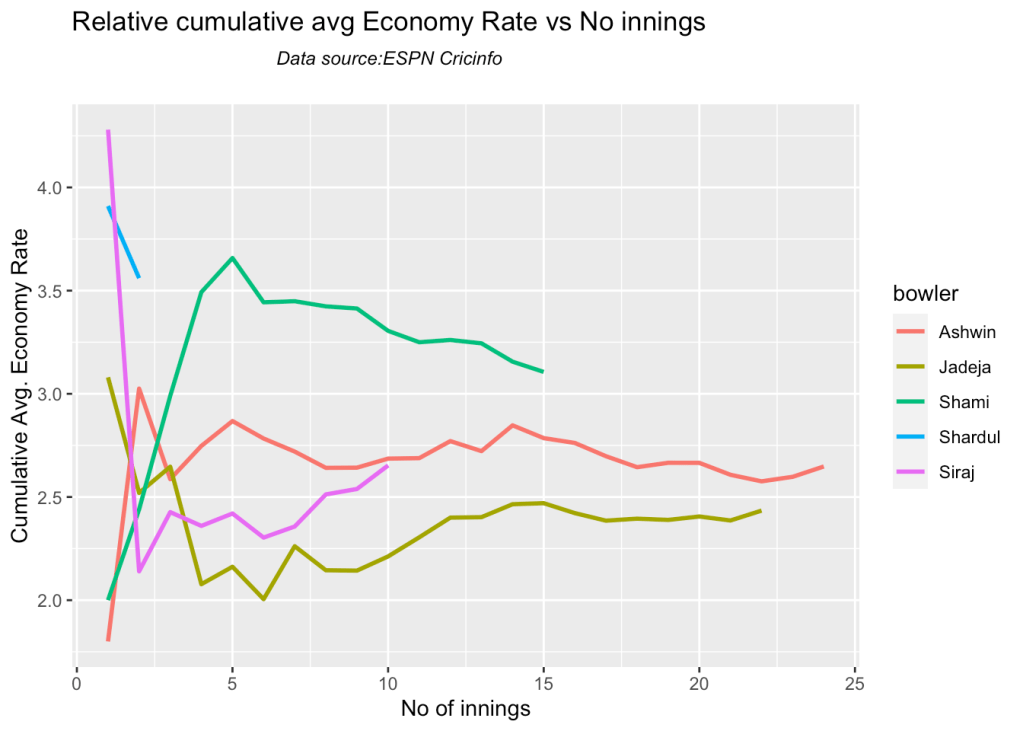
8b Relative cumulative average economy rate of bowlers

Jadeja has the best economy followed by Siraj, then Ashwin

frames <- list("shamiTestAus.csv","sirajTestAus.csv","ashwinTestAus.csv","jadejaTestAus.csv","shardulTestAus.csv")
names <- list("Shami","Siraj","Ashwin","Jadeja","Shardul")
relativeBowlerCumulativeAvgEconRate(frames,names)
8. Analysis of India WTC bowlers from Jan 2016 – May 2023

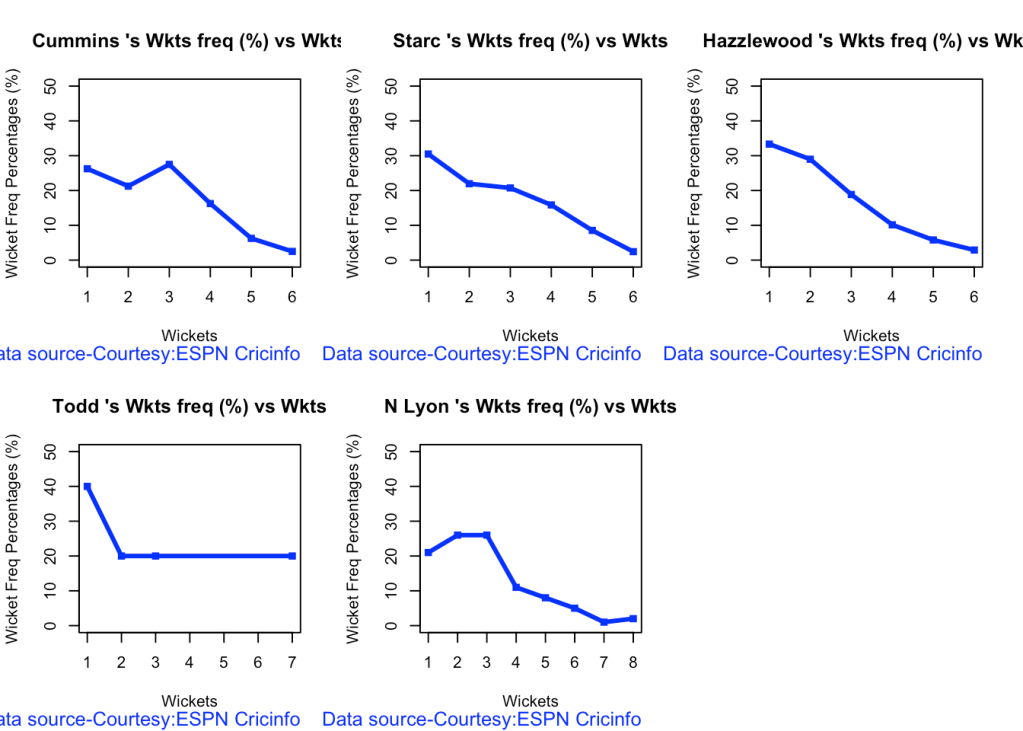
8a. Wickets frequency chart

par(mfrow=c(2,3))
par(mar=c(4,4,2,2))
bowlerWktsFreqPercent("cumminsTest.csv","Cummins")
bowlerWktsFreqPercent("starcTest.csv","Starc")
bowlerWktsFreqPercent("hazzlewoodTest.csv","Hazzlewood")
bowlerWktsFreqPercent("todd.csv","Todd")
bowlerWktsFreqPercent("lyonTest.csv","N Lyon")
 8b. Wickets frequency chart

par(mfrow=c(2,3))
par(mar=c(4,4,2,2))

bowlerWktsRunsPlot("cumminsTest.csv","Cummins")
bowlerWktsRunsPlot("starcTest.csv","Starc")
bowlerWktsRunsPlot("hazzlewoodTest.csv","Hazzlewood")
bowlerWktsRunsPlot("todd.csv","Todd")
bowlerWktsRunsPlot("lyonTest.csv","N Lyon")

8c. Average wickets at different venues

par(mfrow=c(2,3))
par(mar=c(4,4,2,2))

bowlerAvgWktsGround("cumminsTest.csv","Cummins")
bowlerAvgWktsGround("starcTest.csv","Starc")
bowlerAvgWktsGround("hazzlewoodTest.csv","Hazzlewood")
bowlerAvgWktsGround("todd.csv","Todd")
bowlerAvgWktsGround("lyonTest.csv","N Lyon")

8d Average wickets against different opposition

par(mfrow=c(2,3))
par(mar=c(4,4,2,2))

bowlerAvgWktsOpposition("cumminsTest.csv","Cummins")
bowlerAvgWktsOpposition("starcTest.csv","Starc")
bowlerAvgWktsOpposition("hazzlewoodTest.csv","Hazzlewood")
bowlerAvgWktsOpposition("todd.csv","Todd")
bowlerAvgWktsOpposition("lyonTest.csv","N Lyon")

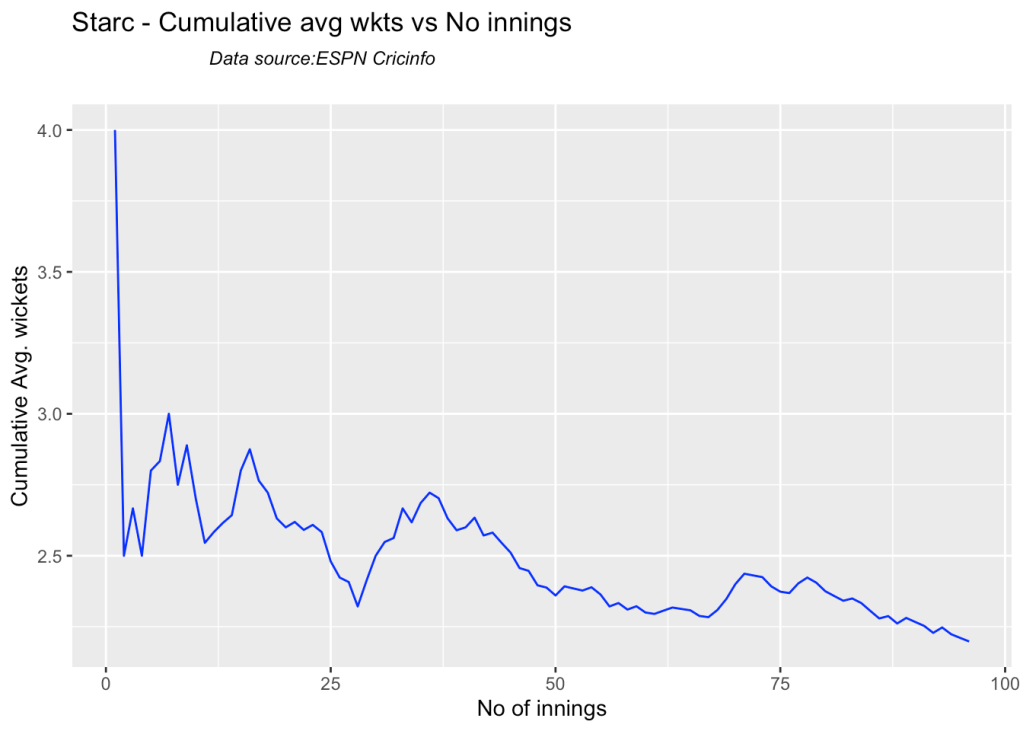
8e Cumulative average wickets taken

par(mfrow=c(2,2))
par(mar=c(4,4,2,2))

bowlerCumulativeAvgWickets("cumminsTest.csv","Cummins")
bowlerCumulativeAvgWickets("starcTest.csv","Starc")
bowlerCumulativeAvgWickets("hazzlewoodTest.csv","Hazzlewood")
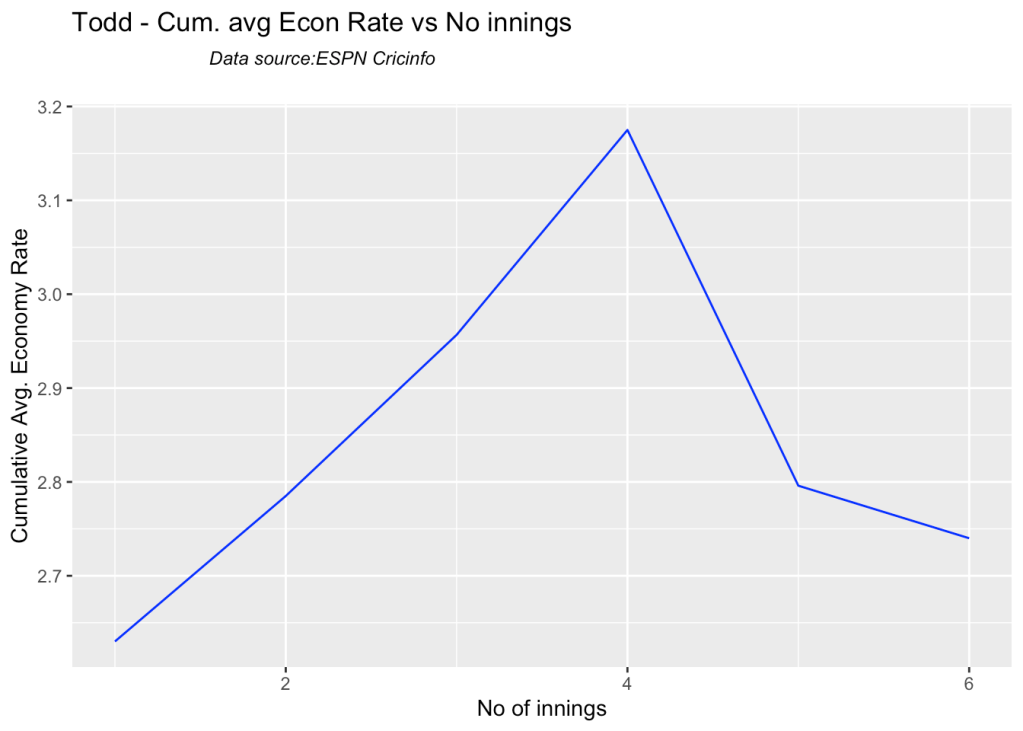
bowlerCumulativeAvgWickets("todd.csv","Todd")
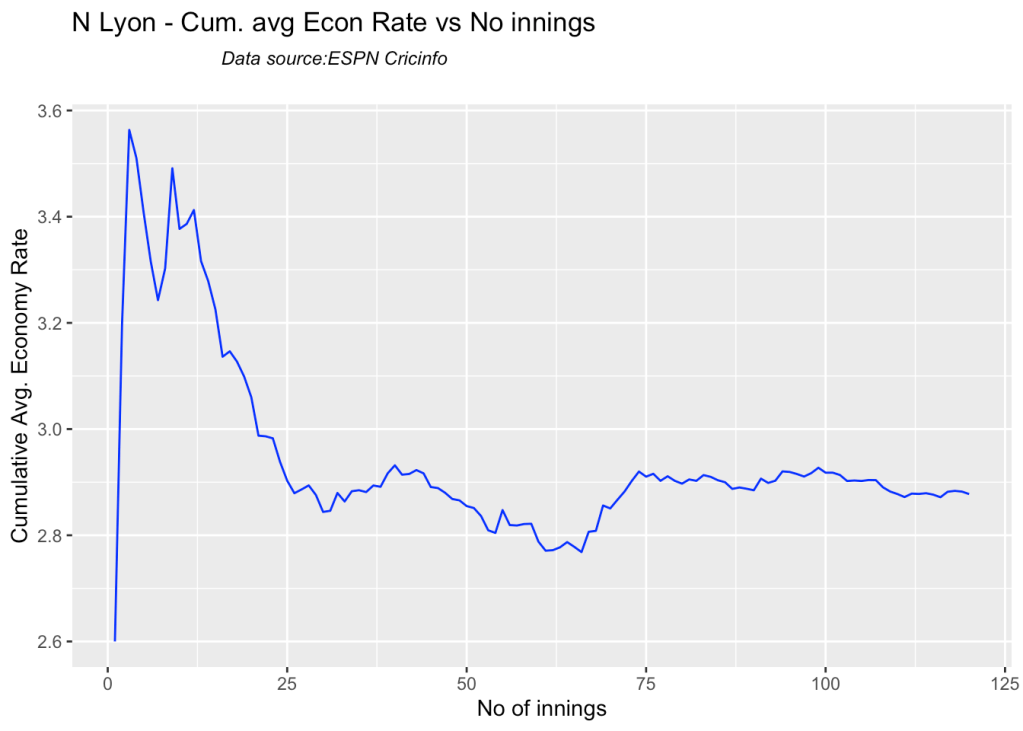
bowlerCumulativeAvgWickets("lyonTest.csv","N Lyon")
8g Cumulative average economy rate

par(mfrow=c(2,3))
par(mar=c(4,4,2,2))

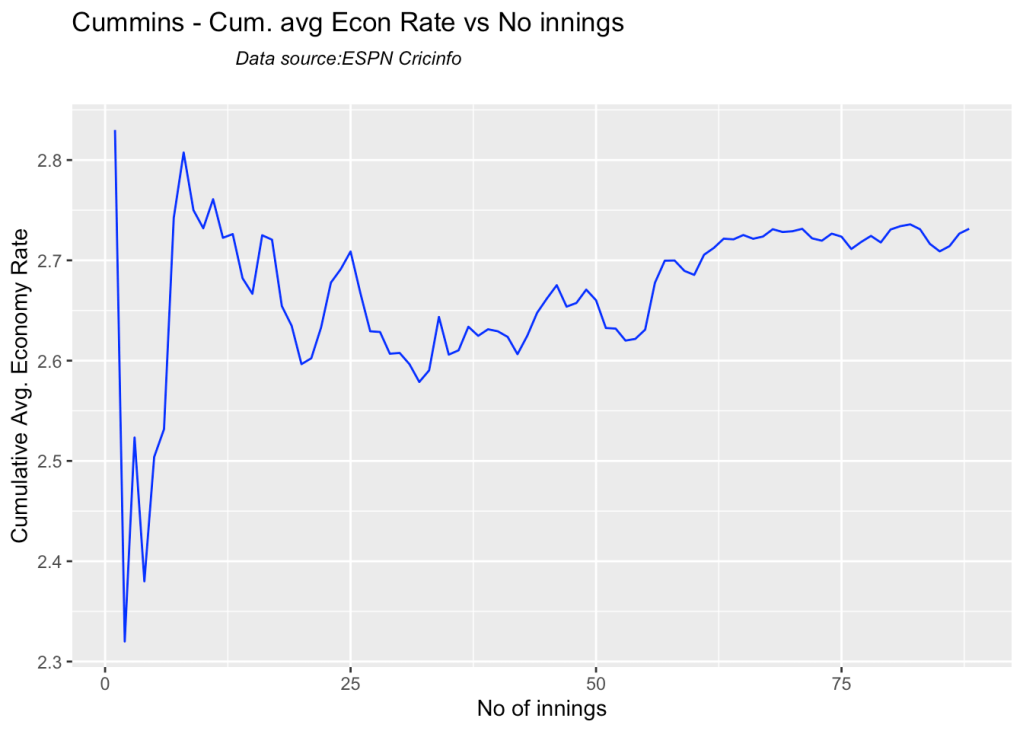
bowlerCumulativeAvgEconRate("cumminsTest.csv","Cummins")
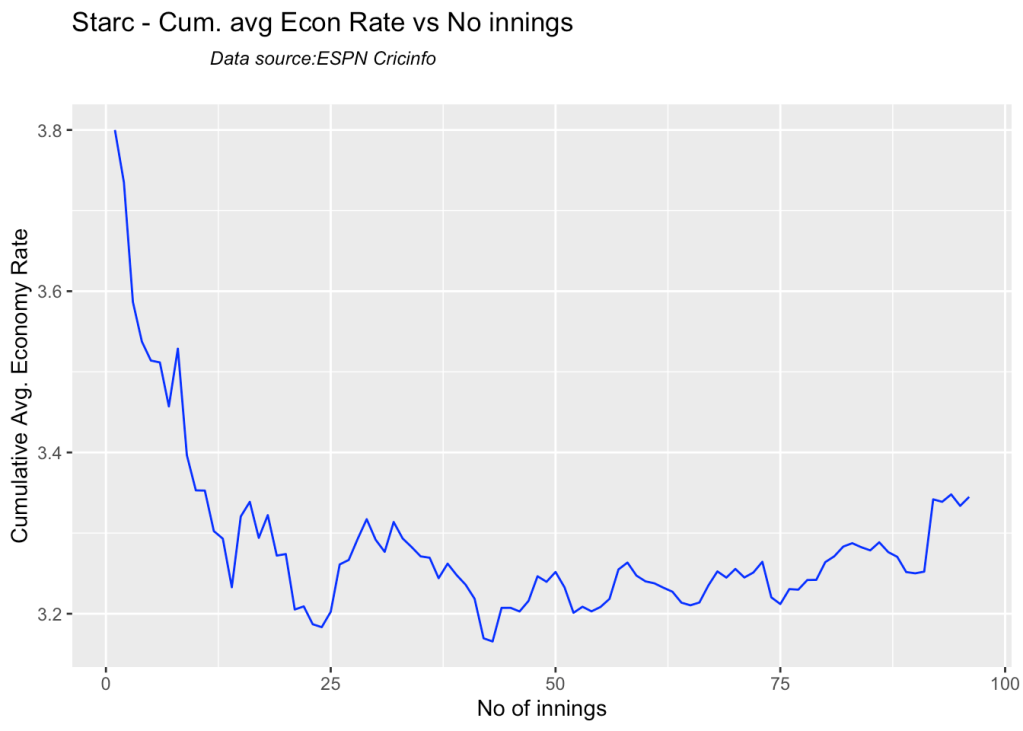
bowlerCumulativeAvgEconRate("starcTest.csv","Starc")
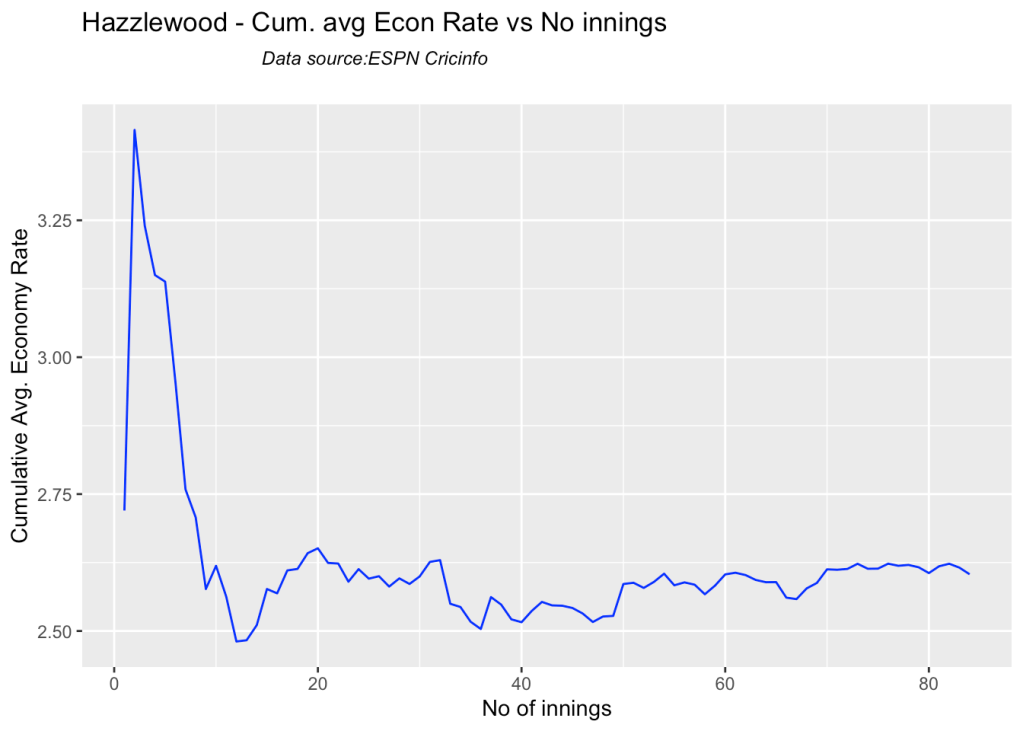
bowlerCumulativeAvgEconRate("hazzlewoodTest.csv","Hazzlewood")
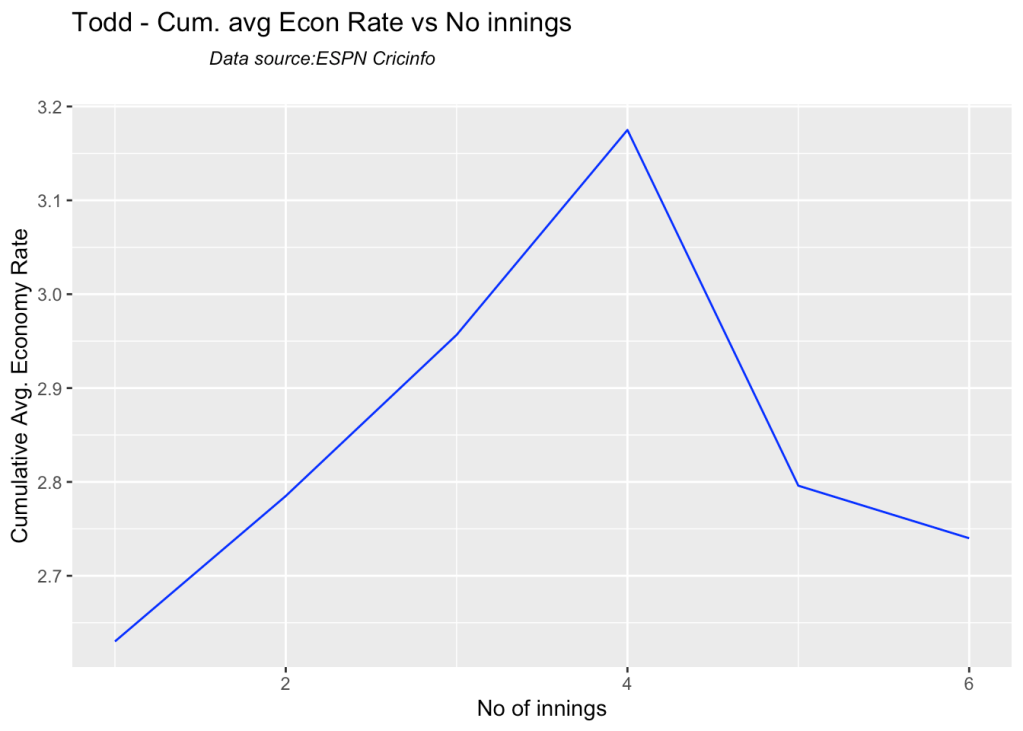
bowlerCumulativeAvgEconRate("todd.csv","Todd")
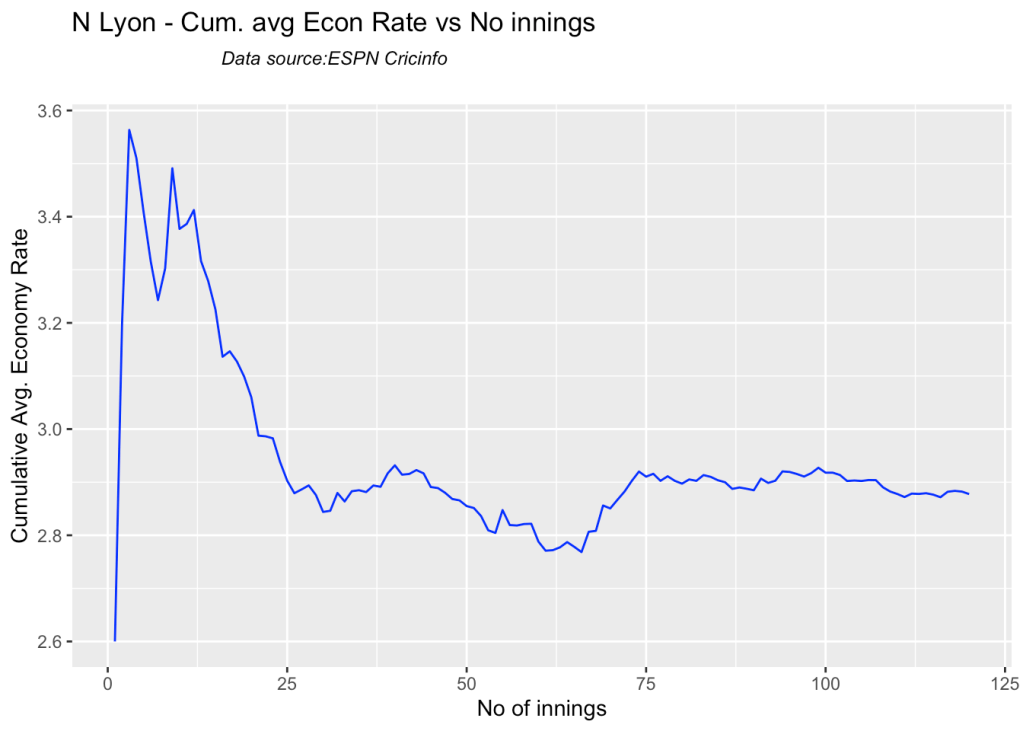
bowlerCumulativeAvgEconRate("lyonTest.csv","N Lyon")
8f. Future Wickets forecast

Here are plots that forecast how the bowler will perform in future. In this case 90% of the career wickets trend is used as the training set. the remaining 10% is the test set.

A Holt-Winters forecasting model is used to forecast future performance based on the 90% training set. The forecated wickets trend is plotted. The test set is also plotted to see how close the forecast and the actual matches

par(mfrow=c(2,3))
par(mar=c(4,4,2,2))

bowlerPerfForecast("cumminsTest.csv","Cummins")
bowlerPerfForecast("starcTest.csv","Starc")
bowlerPerfForecast("hazzlewoodTest.csv","Hazzlewood")
bowlerPerfForecast("lyonTest.csv","N Lyon")

8i. Relative Wickets Frequency Percentage

frames <- list("cumminsTest.csv","starcTest.csv","hazzlewoodTest.csv","todd.csv","lyonTest.csv")
names <- list("Cummins","Starc","Hazzlewood","Todd","N Lyon")
relativeBowlingPerf(frames,names)

8j Relative Economy Rate against wickets taken

frames <- list("cumminsTest.csv","starcTest.csv","hazzlewoodTest.csv","todd.csv","lyonTest.csv")
names <- list("Cummins","Starc","Hazzlewood","Todd","N Lyon")
relativeBowlingER(frames,names)
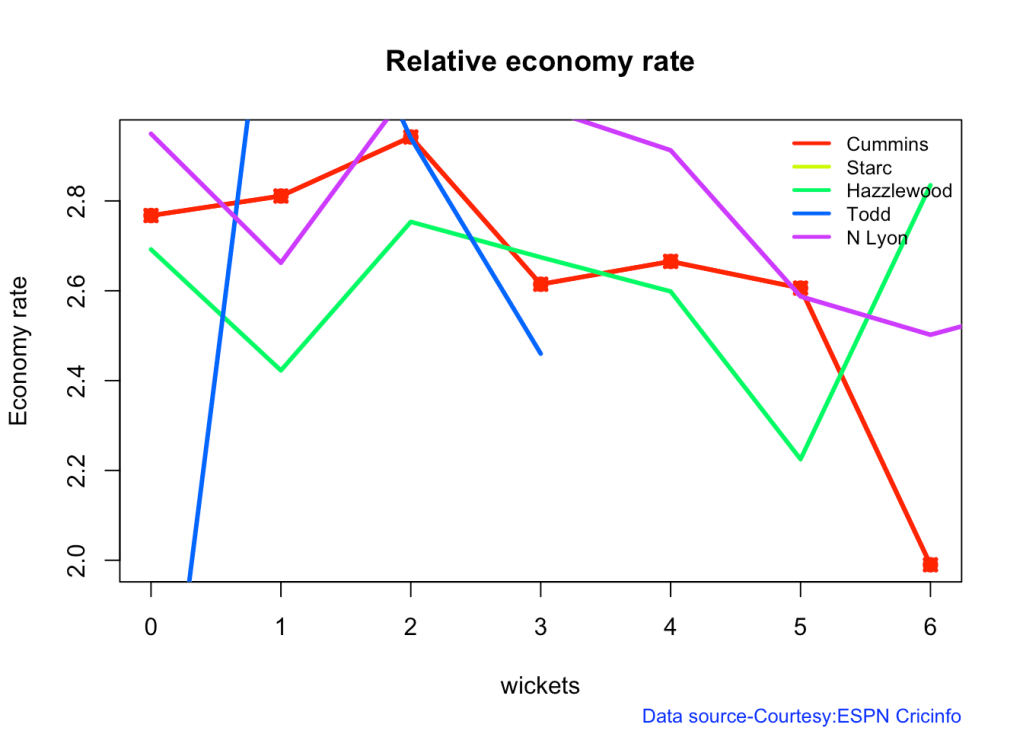
8k Relative cumulative average wickets of bowlers in career

Cummins, Starc and Lyons are the best performers

frames <- list("cumminsTest.csv","starcTest.csv","hazzlewoodTest.csv","todd.csv","lyonTest.csv")
names <- list("Cummins","Starc","Hazzlewood","Todd","N Lyon")
relativeBowlerCumulativeAvgWickets(frames,names)
8l Relative cumulative average economy rate of bowlers

Hazzlewood, Cummins have the best economy against all oppostion

frames <- list("cumminsTest.csv","starcTest.csv","hazzlewoodTest.csv","todd.csv","lyonTest.csv")
names <- list("Cummins","Starc","Hazzlewood","Todd","N Lyon")
relativeBowlerCumulativeAvgEconRate(frames,names)
8o Check for bowler in-form/out-of-form

The below computation uses Null Hypothesis testing and p-value to determine if the bowler is in-form or out-of-form. For this 90% of the career wickets is chosen as the population and the mean computed. The last 10% is chosen to be the sample set and the sample Mean and the sample Standard Deviation are calculated.

The Null Hypothesis (H0) assumes that the bowler continues to stay in-form where the sample mean is within 95% confidence interval of population mean The Alternative (Ha) assumes that the bowler is out of form the sample mean is beyond the 95% confidence interval of the population mean.

A significance value of 0.05 is chosen and p-value us computed If p-value >= .05 – Batsman In-Form If p-value < 0.05 – Batsman Out-of-Form

Note Ideally the p-value should be done for a population that follows the Normal Distribution. But the runs population is usually left skewed. So some correction may be needed. I will revisit this later

Note: The check for the form status of the bowlers indicate

checkBowlerInForm("cummins.csv","Cummins")
## [1] "**************************** Form status of Cummins ****************************\n\n Population size: 81  Mean of population: 2.46 \n Sample size: 9  Mean of sample: 2 SD of sample: 1.5 \n\n Null hypothesis H0 : Cummins 's sample average is within 95% confidence interval \n        of population average\n Alternative hypothesis Ha : Cummins 's sample average is below the 95% confidence\n        interval of population average\n\n Cummins 's Form Status: In-Form because the p value: 0.190785  is greater than alpha=  0.05 \n *******************************************************************************************\n\n"
checkBowlerInForm("starc.csv","Starc")
## [1] "**************************** Form status of Starc ****************************\n\n Population size: 126  Mean of population: 2.18 \n Sample size: 15  Mean of sample: 1.67 SD of sample: 1.18 \n\n Null hypothesis H0 : Starc 's sample average is within 95% confidence interval \n        of population average\n Alternative hypothesis Ha : Starc 's sample average is below the 95% confidence\n        interval of population average\n\n Starc 's Form Status: In-Form because the p value: 0.057433  is greater than alpha=  0.05 \n *******************************************************************************************\n\n"
checkBowlerInForm("hazzlewood.csv","Hazzlewood")
## [1] "**************************** Form status of Hazzlewood ****************************\n\n Population size: 99  Mean of population: 2.04 \n Sample size: 12  Mean of sample: 1.67 SD of sample: 1.5 \n\n Null hypothesis H0 : Hazzlewood 's sample average is within 95% confidence interval \n        of population average\n Alternative hypothesis Ha : Hazzlewood 's sample average is below the 95% confidence\n        interval of population average\n\n Hazzlewood 's Form Status: In-Form because the p value: 0.204787  is greater than alpha=  0.05 \n *******************************************************************************************\n\n"
checkBowlerInForm("lyon.csv","N Lyon")
## [1] "**************************** Form status of N Lyon ****************************\n\n Population size: 193  Mean of population: 2.08 \n Sample size: 22  Mean of sample: 2.95 SD of sample: 1.96 \n\n Null hypothesis H0 : N Lyon 's sample average is within 95% confidence interval \n        of population average\n Alternative hypothesis Ha : N Lyon 's sample average is below the 95% confidence\n        interval of population average\n\n N Lyon 's Form Status: In-Form because the p value: 0.975407  is greater than alpha=  0.05 \n *******************************************************************************************\n\n"

9. Analysis of Australia WTC bowlers from Jan 2016 – May 2023 against India

9a Relative cumulative average wickets of bowlers in career

Against India Lyon, Cummins and Hazzlewood have performed well

frames <- list("cumminsTestInd.csv","starcTestInd.csv","hazzlewoodTestInd.csv","lyonTestInd.csv")
names <- list("Cummins","Starc","Hazzlewood","N Lyon")
relativeBowlerCumulativeAvgWickets(frames,names)
9b Relative cumulative average economy rate of bowlers

Hazzlewood, Lyon have a good economy rate against India

frames <- list("cumminsTestInd.csv","starcTestInd.csv","hazzlewoodTestInd.csv","lyonTestInd.csv")
names <- list("Cummins","Starc","Hazzlewood","N Lyon")
relativeBowlerCumulativeAvgEconRate(frames,names)

10 Analysis of teams – India, Australia

#The data for India & Australia teams were obtained with the following calls

#indiaTest <-getTeamDataHomeAway(dir=".",teamView="bat",matchType="Test",file="indiaTest.csv",save=TRUE,teamName="India")
#australiaTest <- getTeamDataHomeAway(matchType="Test",file="australiaTest.csv",save=TRUE,teamName="Australia")

10a. Win-loss of India against all oppositions in Test cricket

Against Australia India has won 17 times, lost 60 and drawn 22 in Australia. At home India won 42, tied 2, lost 28 and drawn 24

teamWinLossStatusVsOpposition("indiaTest.csv",teamName="India",opposition=c("all"),homeOrAway=c("all"),matchType="Test",plot=TRUE)

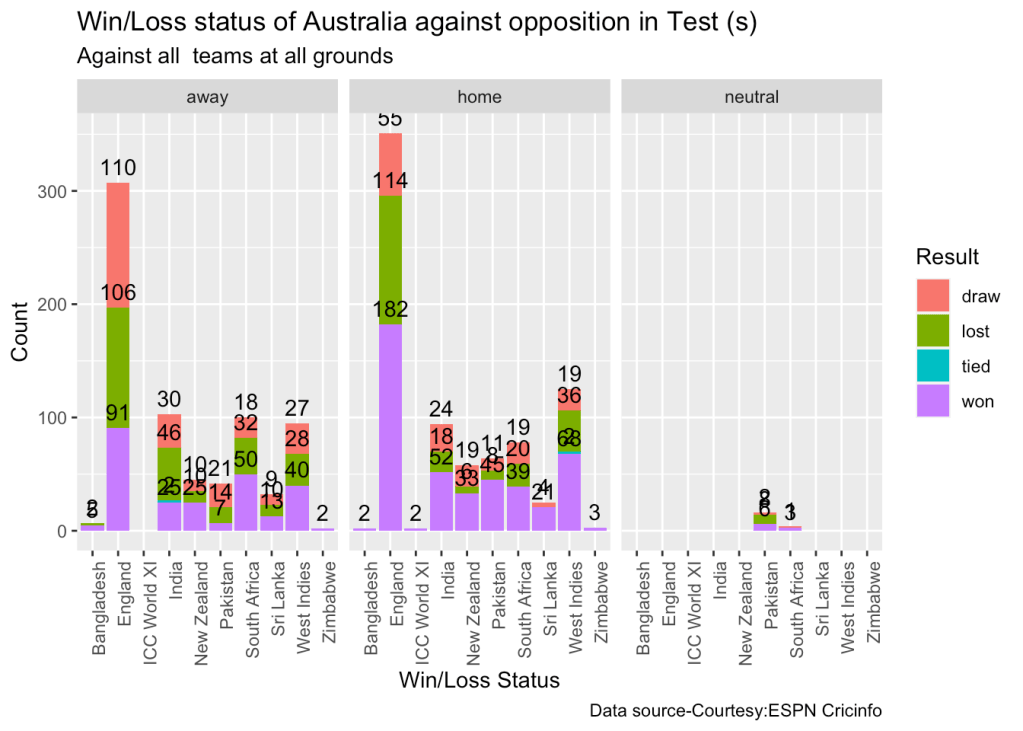
10b. Win-loss of Australia against all oppositions in Test cricket

teamWinLossStatusVsOpposition("australiaTest.csv",teamName="Australia",opposition=c("all"),homeOrAway=c("all"),matchType="Test",plot=TRUE)
10c. Win-loss of India against Australia in Test cricket

Against Australia India has won 17 times, lost 60 and drawn 22 in Australia. At home India won 42, tied 2, lost 28 and drawn 24

teamWinLossStatusVsOpposition("indiaTest.csv",teamName="India",opposition=c("Australia"),homeOrAway=c("all"),matchType="Test",plot=TRUE)
10d. Win-loss of India at all away venues

At the Oval where WTC is going to be held India has won 4, lost 10 and drawn 10.

teamWinLossStatusAtGrounds("indiaTest.csv",teamName="India",opposition=c("all"),homeOrAway=c("away"),matchType="Test",plot=TRUE)
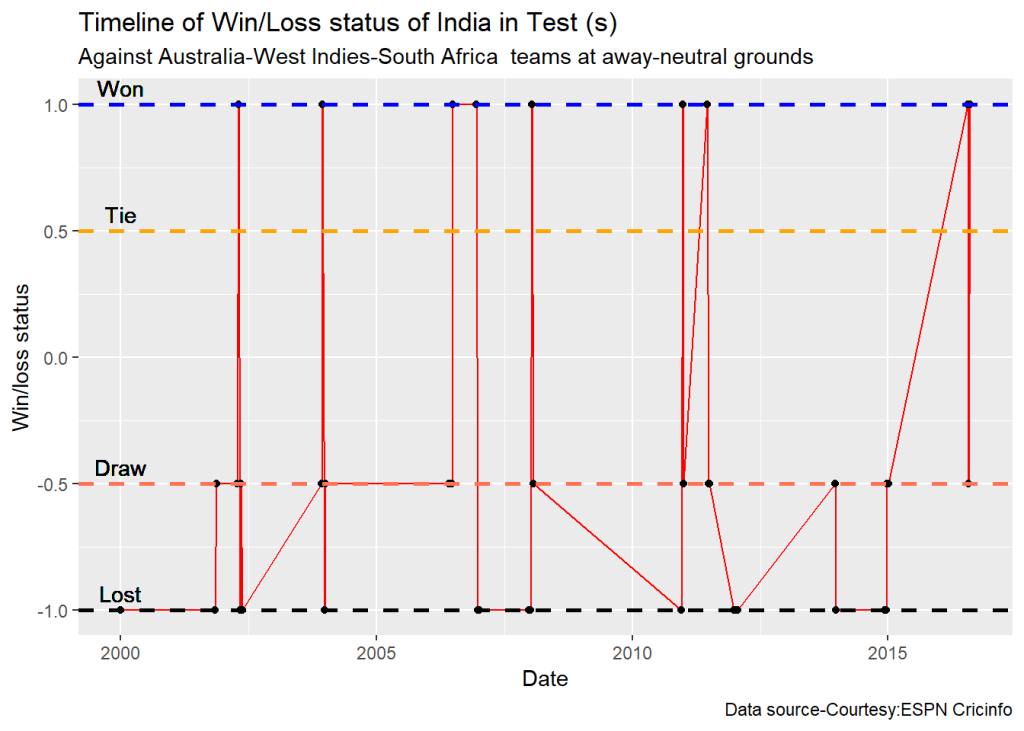
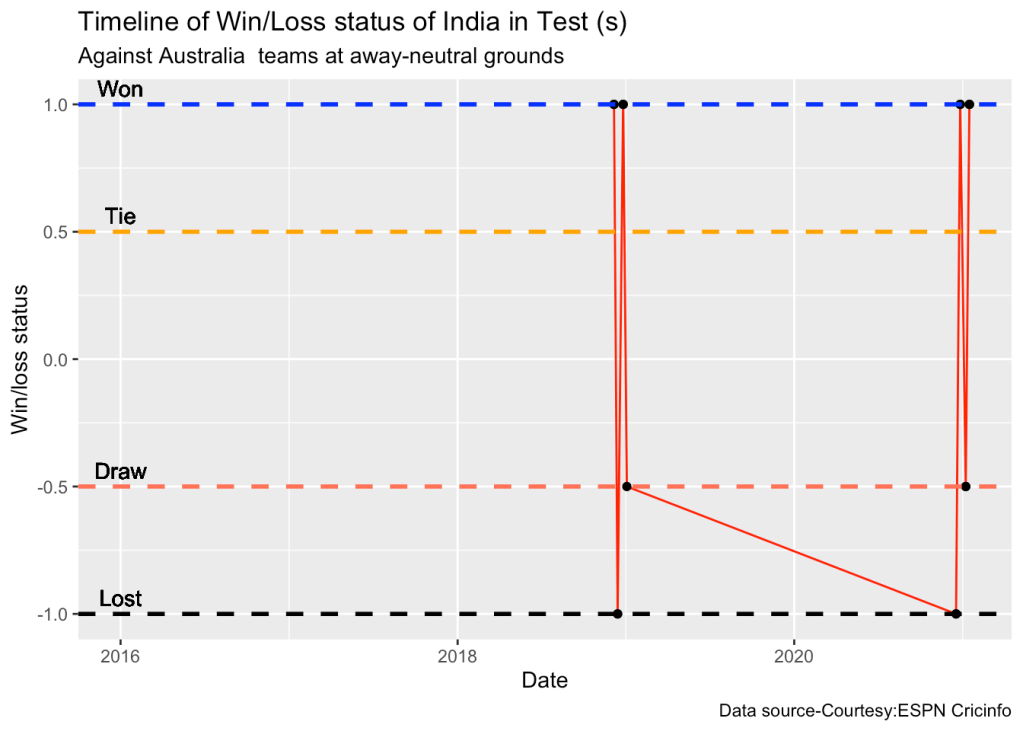
10d. Timeline of win-loss of India against Australia in Test cricket

plotTimelineofWinsLosses("indiaTest.csv",team="India",opposition=c("Australia"),
                         homeOrAway=c("away","neutral"), startDate="2016-01-01",endDate="2023-05-01")
11. Conclusion

The above analysis performs various analysis of India and Australia in home and away matches. While we know the performance of the player at India or Australia, we cannot judge how the match will progress in the neutral, swinging conditions of the Oval. Let us hope for a good match!

Feel free to try out your own analysis with cricketr. Have fun with cricketr!!

Also see

  1. GooglyPlusPlus: Win Probability using Deep Learning and player embeddings
  2. The common alphabet of programming languages
  3. Practical Machine Learning with R and Python – Part 5
  4. Deep Learning from first principles in Python, R and Octave – Part 4
  5. Big Data-4: Webserver log analysis with RDDs, Pyspark, SparkR and SparklyR
  6. Cricpy takes guard for the Twenty20s
  7. Using Reinforcement Learning to solve Gridworld
  8. Exploring Quantum Gate operations with QCSimulator

To see all posts click Index of posts

Updated:Analyzing performance of cricketers and cricket teams with cricketr templates

Note: I have included the latest set of functions that perform granular analysis of batsmen and bowlers to the cricketr template below! You can download this RMarkdown file from Github at cricketr-template 

This post includes a template which you can use for analyzing the performances of cricketers, both batsmen and bowlers in Test, ODI and Twenty 20 cricket. Additionally this template can also be used for analyzing performancs of teams in Test, ODI and T20 matches using my R package cricketr. To see actual usage of functions related to players in the R package cricketr see Introducing cricketr! : An R package to analyze performances of cricketers and associated posts on cricket in Index of posts. For the analyses on team performances see https://gigadom.in/2019/06/21/cricpy-adds-team-analytics-to-its-repertoire/

The ‘cricketr’ package uses the statistics info available in ESPN Cricinfo Statsguru. The current version of this package supports all formats of the game including Test, ODI and Twenty20 versions.

You should be able to install the package from GitHub and use the many functions available in the package. Please mindful of the ESPN Cricinfo Terms of Use

Take a look at my short video tutorial on my R package cricketr on Youtube – R package cricketr – A short tutorial

Do check out my interactive Shiny app implementation using the cricketr package – Sixer – R package cricketr’s new Shiny avatar

The cricketr package

The cricketr package has several functions that perform several different analyses on both batsman and bowlers. The package can also analyze performances of teams The package has function that plot percentage frequency runs or wickets, runs likelihood for a batsman, relative run/strike rates of batsman and relative performance/economy rate for bowlers are available. Other interesting functions include batting performance moving average, forecast and a function to check whether the batsmans in in-form or out-of-form.

In addition performances of teams against different oppositions at different venues can be computed and plotted. The timeline of wins & losses can be plotted.

A. Performances of batsmen and bowlers

The data for a particular player can be obtained with the getPlayerData() function. To do you will need to go to ESPN CricInfo Player and type in the name of the player for e.g Ricky Ponting, Sachin Tendulkar etc. This will bring up a page which have the profile number for the player e.g. for Sachin Tendulkar this would be http://www.espncricinfo.com/india/content/player/35320.html. Hence, Sachin’s profile is 35320. This can be used to get the data for Tendulkar as shown below

The cricketr package is now available from CRAN!!! You should be able to install directly with

1. Install the cricketr package

if (!require("cricketr")){
    install.packages("cricketr",lib = "c:/test")
}
library(cricketr)

The cricketr package includes some pre-packaged sample (.csv) files. You can use these sample to test functions as shown below

# Retrieve the file path of a data file installed with cricketr
#pathToFile <- system.file("data", "tendulkar.csv", package = "cricketr")
#batsman4s(pathToFile, "Sachin Tendulkar")

# The general format is pkg-function(pathToFile,par1,...)
#batsman4s(<path-To-File>,"Sachin Tendulkar")

“` The pre-packaged files can be accessed as shown above. To get the data of any player use the function in Test, ODI and Twenty20 use the following

2. For Test cricket

#tendulkar <- getPlayerData(35320,dir="..",file="tendulkar.csv",type="batting",homeOrAway=c(1,2), result=c(1,2,4))

2a. For ODI cricket

#tendulkarOD <- getPlayerDataOD(35320,dir="..",file="tendulkarOD.csv",type="batting")

2b For Twenty 20 cricket

#tendulkarT20 <- getPlayerDataTT(35320,dir="..",file="tendulkarT20.csv",type="batting")

Important Note 1 This needs to be done only once for a player. This function stores the player’s data in a CSV file (for e.g. tendulkar.csv as above) which can then be reused for all other functions. Once we have the data for the players many analyses can be done. This post will use the stored CSV file obtained with a prior getPlayerData for all subsequent analyses

Important Note 2 The same set of functions can be used for Tests, ODI and T20s. I have mentioned wherever you may need special functions for ODI and T20 below

Sachin Tendulkar’s performance – Basic Analyses

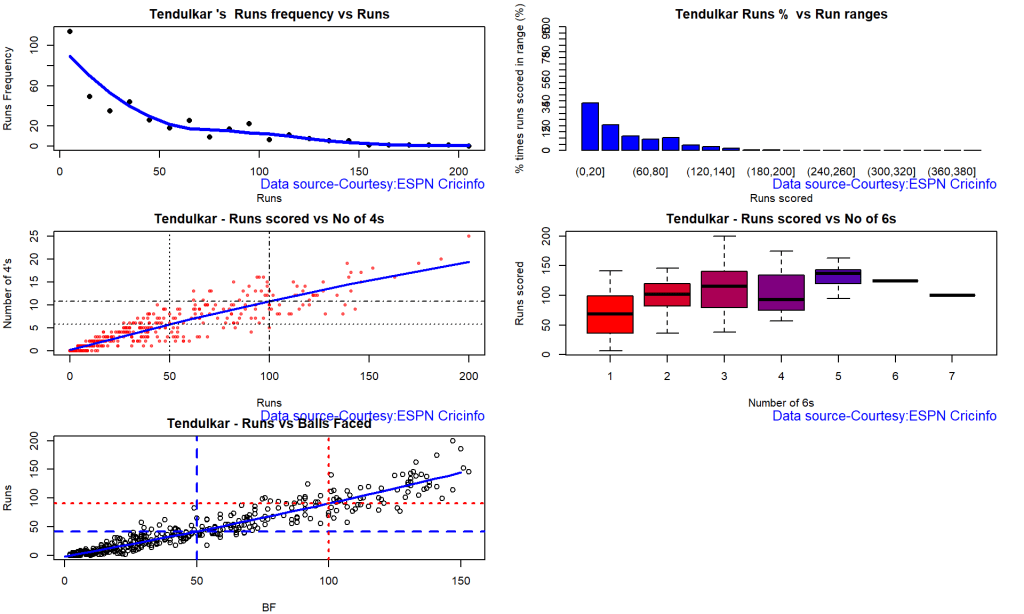
The 3 plots below provide the following for Tendulkar

  1. Frequency percentage of runs in each run range over the whole career
  2. Mean Strike Rate for runs scored in the given range
  3. A histogram of runs frequency percentages in runs ranges For example

3. Basic analyses

par(mfrow=c(1,3))
par(mar=c(4,4,2,2))
#batsmanRunsFreqPerf("./tendulkar.csv","Tendulkar")
#batsmanMeanStrikeRate("./tendulkar.csv","Tendulkar")
#batsmanRunsRanges("./tendulkar.csv","Tendulkar")
dev.off()
## null device 
##           1
  1. Player 1
  2. Player 2
  3. Player 3
  4. Player 4

4. More analyses

par(mfrow=c(1,3))
par(mar=c(4,4,2,2))
#batsman4s("./player1.csv","Player1")
#batsman6s("./player1.csv","Player1")
#batsmanMeanStrikeRate("./player1.csv","Player1")

# For ODI and T20
#batsmanScoringRateODTT("./player1.csv","Player1")
dev.off()
## null device 
##           1
par(mfrow=c(1,3))
par(mar=c(4,4,2,2))
#batsman4s("./player2.csv","Player2")
#batsman6s("./player2.csv","Player2")
#batsmanMeanStrikeRate("./player2.csv","Player2")
# For ODI and T20
#batsmanScoringRateODTT("./player1.csv","Player1")
dev.off()
## null device 
##           1
par(mfrow=c(1,3))
par(mar=c(4,4,2,2))
#batsman4s("./player3.csv","Player3")
#batsman6s("./player3.csv","Player3")
#batsmanMeanStrikeRate("./player3.csv","Player3")
# For ODI and T20
#batsmanScoringRateODTT("./player1.csv","Player1")

dev.off()
## null device 
##           1
par(mfrow=c(1,3))
par(mar=c(4,4,2,2))
#batsman4s("./player4.csv","Player4")
#batsman6s("./player4.csv","Player4")
#batsmanMeanStrikeRate("./player4.csv","Player4")
# For ODI and T20
#batsmanScoringRateODTT("./player1.csv","Player1")
dev.off()
## null device 
##           1

Note: For mean strike rate in ODI and Twenty20 use the function batsmanScoringRateODTT()

5.Boxplot histogram plot

This plot shows a combined boxplot of the Runs ranges and a histogram of the Runs Frequency

#batsmanPerfBoxHist("./player1.csv","Player1")
#batsmanPerfBoxHist("./player2.csv","Player2")
#batsmanPerfBoxHist("./player3.csv","Player3")
#batsmanPerfBoxHist("./player4.csv","Player4")

6. Contribution to won and lost matches

For the 2 functions below you will have to use the getPlayerDataSp() function. I have commented this as I already have these files. This function can only be used for Test matches

#player1sp <- getPlayerDataSp(xxxx,tdir=".",tfile="player1sp.csv",ttype="batting")
#player2sp <- getPlayerDataSp(xxxx,tdir=".",tfile="player2sp.csv",ttype="batting")
#player3sp <- getPlayerDataSp(xxxx,tdir=".",tfile="player3sp.csv",ttype="batting")
#player4sp <- getPlayerDataSp(xxxx,tdir=".",tfile="player4sp.csv",ttype="batting")
par(mfrow=c(2,2))
par(mar=c(4,4,2,2))
#batsmanContributionWonLost("player1sp.csv","Player1")
#batsmanContributionWonLost("player2sp.csv","Player2")
#batsmanContributionWonLost("player3sp.csv","Player3")
#batsmanContributionWonLost("player4sp.csv","Player4")
dev.off()
## null device 
##           1

7, Performance at home and overseas

This function also requires the use of getPlayerDataSp() as shown above. This can only be used for Test matches

par(mfrow=c(2,2))
par(mar=c(4,4,2,2))
#batsmanPerfHomeAway("player1sp.csv","Player1")
#batsmanPerfHomeAway("player2sp.csv","Player2")
#batsmanPerfHomeAway("player3sp.csv","Player3")
#batsmanPerfHomeAway("player4sp.csv","Player4")
dev.off()
## null device 
##           1

8. Batsman average at different venues

par(mfrow=c(2,2))
par(mar=c(4,4,2,2))
#batsmanAvgRunsGround("./player1.csv","Player1")
#batsmanAvgRunsGround("./player2.csv","Player2")
#batsmanAvgRunsGround("./player3.csv","Ponting")
#batsmanAvgRunsGround("./player4.csv","Player4")
dev.off()
## null device 
##           1

9. Batsman average against different opposition

par(mfrow=c(2,2))
par(mar=c(4,4,2,2))
#batsmanAvgRunsOpposition("./player1.csv","Player1")
#batsmanAvgRunsOpposition("./player2.csv","Player2")
#batsmanAvgRunsOpposition("./player3.csv","Ponting")
#batsmanAvgRunsOpposition("./player4.csv","Player4")
dev.off()
## null device 
##           1

10. Runs Likelihood of batsman

par(mfrow=c(2,2))
par(mar=c(4,4,2,2))
#batsmanRunsLikelihood("./player1.csv","Player1")
#batsmanRunsLikelihood("./player2.csv","Player2")
#batsmanRunsLikelihood("./player3.csv","Ponting")
#batsmanRunsLikelihood("./player4.csv","Player4")
dev.off()
## null device 
##           1

11. Moving Average of runs in career

par(mfrow=c(2,2))
par(mar=c(4,4,2,2))
#batsmanMovingAverage("./player1.csv","Player1")
#batsmanMovingAverage("./player2.csv","Player2")
#batsmanMovingAverage("./player3.csv","Ponting")
#batsmanMovingAverage("./player4.csv","Player4")
dev.off()
## null device 
##           1

12. Cumulative Average runs of batsman in career

par(mfrow=c(2,2))
par(mar=c(4,4,2,2))
#batsmanCumulativeAverageRuns("./player1.csv","Player1")
#batsmanCumulativeAverageRuns("./player2.csv","Player2")
#batsmanCumulativeAverageRuns("./player3.csv","Ponting")
#batsmanCumulativeAverageRuns("./player4.csv","Player4")
dev.off()
## null device 
##           1

13. Cumulative Average strike rate of batsman in career

par(mfrow=c(2,2))
par(mar=c(4,4,2,2))
#batsmanCumulativeStrikeRate("./player1.csv","Player1")
#batsmanCumulativeStrikeRate("./player2.csv","Player2")
#batsmanCumulativeStrikeRate("./player3.csv","Ponting")
#batsmanCumulativeStrikeRate("./player4.csv","Player4")
dev.off()
## null device 
##           1

14. Future Runs forecast

Here are plots that forecast how the batsman will perform in future. In this case 90% of the career runs trend is uses as the training set. the remaining 10% is the test set.

A Holt-Winters forecating model is used to forecast future performance based on the 90% training set. The forecated runs trend is plotted. The test set is also plotted to see how close the forecast and the actual matches

Take a look at the runs forecasted for the batsman below.

par(mfrow=c(2,2))
par(mar=c(4,4,2,2))
#batsmanPerfForecast("./player1.csv","Player1")
#batsmanPerfForecast("./player2.csv","Player2")
#batsmanPerfForecast("./player3.csv","Player3")
#batsmanPerfForecast("./player4.csv","Player4")
dev.off()
## null device 
##           1

15. Relative Mean Strike Rate plot

The plot below compares the Mean Strike Rate of the batsman for each of the runs ranges of 10 and plots them. The plot indicate the following

frames <- list("./player1.csv","./player2.csv","player3.csv","player4.csv")
names <- list("Player1","Player2","Player3","Player4")
#relativeBatsmanSR(frames,names)

16. Relative Runs Frequency plot

The plot below gives the relative Runs Frequency Percetages for each 10 run bucket. The plot below show

frames <- list("./player1.csv","./player2.csv","player3.csv","player4.csv")
names <- list("Player1","Player2","Player3","Player4")
#relativeRunsFreqPerf(frames,names)

17. Relative cumulative average runs in career

frames <- list("./player1.csv","./player2.csv","player3.csv","player4.csv")
names <- list("Player1","Player2","Player3","Player4")
#relativeBatsmanCumulativeAvgRuns(frames,names)

18. Relative cumulative average strike rate in career

frames <- list("./player1.csv","./player2.csv","player3.csv","player4.csv")
names <- list("Player1","Player2","Player3","player4")
#relativeBatsmanCumulativeStrikeRate(frames,names)

19. Check Batsman In-Form or Out-of-Form

The below computation uses Null Hypothesis testing and p-value to determine if the batsman is in-form or out-of-form. For this 90% of the career runs is chosen as the population and the mean computed. The last 10% is chosen to be the sample set and the sample Mean and the sample Standard Deviation are caculated.

The Null Hypothesis (H0) assumes that the batsman continues to stay in-form where the sample mean is within 95% confidence interval of population mean The Alternative (Ha) assumes that the batsman is out of form the sample mean is beyond the 95% confidence interval of the population mean.

A significance value of 0.05 is chosen and p-value us computed If p-value >= .05 – Batsman In-Form If p-value < 0.05 – Batsman Out-of-Form

Note Ideally the p-value should be done for a population that follows the Normal Distribution. But the runs population is usually left skewed. So some correction may be needed. I will revisit this later

This is done for the Top 4 batsman

#checkBatsmanInForm("./player1.csv","Player1")
#checkBatsmanInForm("./player2.csv","Player2")
#checkBatsmanInForm("./player3.csv","Player3")
#checkBatsmanInForm("./player4.csv","Player4")

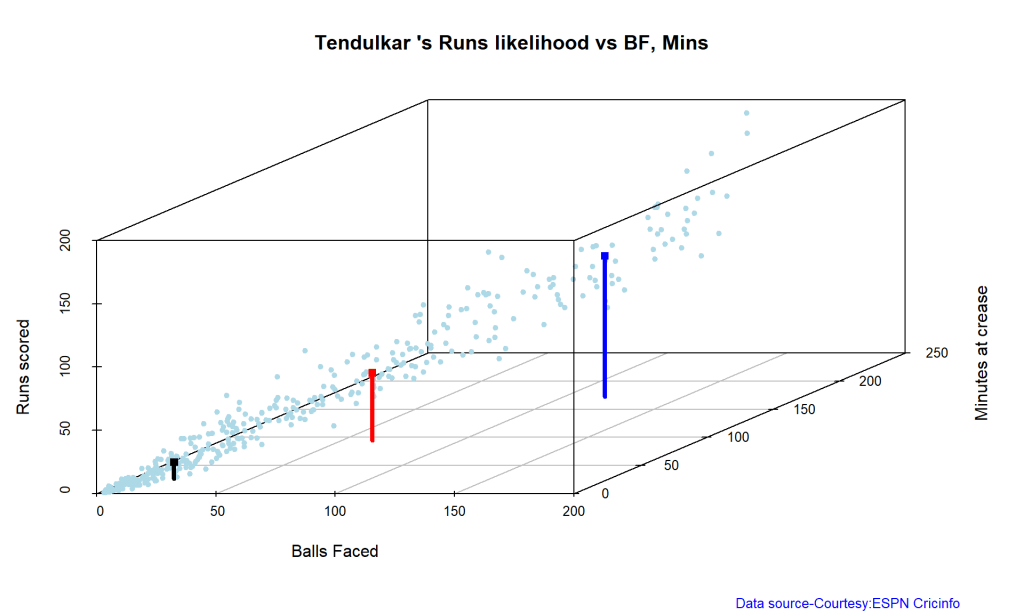
20. 3D plot of Runs vs Balls Faced and Minutes at Crease

The plot is a scatter plot of Runs vs Balls faced and Minutes at Crease. A prediction plane is fitted

par(mfrow=c(1,2))
par(mar=c(4,4,2,2))
#battingPerf3d("./player1.csv","Player1")
#battingPerf3d("./player2.csv","Player2")
par(mfrow=c(1,2))
par(mar=c(4,4,2,2))
#battingPerf3d("./player3.csv","Player3")
#battingPerf3d("./player4.csv","player4")
dev.off()
## null device 
##           1

21. Predicting Runs given Balls Faced and Minutes at Crease

A multi-variate regression plane is fitted between Runs and Balls faced +Minutes at crease.

BF <- seq( 10, 400,length=15)
Mins <- seq(30,600,length=15)
newDF <- data.frame(BF,Mins)
#Player1 <- batsmanRunsPredict("./player1.csv","Player1",newdataframe=newDF)
#Player2 <- batsmanRunsPredict("./player2.csv","Player2",newdataframe=newDF)
#ponting <- batsmanRunsPredict("./player3.csv","Player3",newdataframe=newDF)
#sangakkara <- batsmanRunsPredict("./player4.csv","Player4",newdataframe=newDF)
#batsmen <-cbind(round(Player1$Runs),round(Player2$Runs),round(Player3$Runs),round(Player4$Runs))
#colnames(batsmen) <- c("Player1","Player2","Player3","Player4")
#newDF <- data.frame(round(newDF$BF),round(newDF$Mins))
#colnames(newDF) <- c("BallsFaced","MinsAtCrease")
#predictedRuns <- cbind(newDF,batsmen)
#predictedRuns

Analysis of bowlers

  1. Bowler1
  2. Bowler2
  3. Bowler3
  4. Bowler4

player1 <- getPlayerData(xxxx,dir=“..”,file=“player1.csv”,type=“bowling”) Note For One day you will have to use getPlayerDataOD() and for Twenty20 it is getPlayerDataTT()

21. Wicket Frequency Plot

This plot below computes the percentage frequency of number of wickets taken for e.g 1 wicket x%, 2 wickets y% etc and plots them as a continuous line

par(mfrow=c(1,3))
par(mar=c(4,4,2,2))
#bowlerWktsFreqPercent("./bowler1.csv","Bowler1")
#bowlerWktsFreqPercent("./bowler2.csv","Bowler2")
#bowlerWktsFreqPercent("./bowler3.csv","Bowler3")
dev.off()
## null device 
##           1

22. Wickets Runs plot

par(mfrow=c(1,3))
par(mar=c(4,4,2,2))
#bowlerWktsRunsPlot("./bowler1.csv","Bowler1")
#bowlerWktsRunsPlot("./bowler2.csv","Bowler2")
#bowlerWktsRunsPlot("./bowler3.csv","Bowler3")
dev.off()
## null device 
##           1

23. Average wickets at different venues

#bowlerAvgWktsGround("./bowler3.csv","Bowler3")

24. Average wickets against different opposition

#bowlerAvgWktsOpposition("./bowler3.csv","Bowler3")

25. Wickets taken moving average

par(mfrow=c(1,3))
par(mar=c(4,4,2,2))
#bowlerMovingAverage("./bowler1.csv","Bowler1")
#bowlerMovingAverage("./bowler2.csv","Bowler2")
#bowlerMovingAverage("./bowler3.csv","Bowler3")

dev.off()
## null device 
##           1

26. Cumulative Wickets taken

par(mfrow=c(1,3))
par(mar=c(4,4,2,2))
#bowlerCumulativeAvgWickets("./bowler1.csv","Bowler1")
#bowlerCumulativeAvgWickets("./bowler2.csv","Bowler2")
#bowlerCumulativeAvgWickets("./bowler3.csv","Bowler3")
dev.off()
## null device 
##           1

27. Cumulative Economy rate

par(mfrow=c(1,3))
par(mar=c(4,4,2,2))
#bowlerCumulativeAvgEconRate("./bowler1.csv","Bowler1")
#bowlerCumulativeAvgEconRate("./bowler2.csv","Bowler2")
#bowlerCumulativeAvgEconRate("./bowler3.csv","Bowler3")
dev.off()
## null device 
##           1

28. Future Wickets forecast

Here are plots that forecast how the bowler will perform in future. In this case 90% of the career wickets trend is used as the training set. the remaining 10% is the test set.

A Holt-Winters forecating model is used to forecast future performance based on the 90% training set. The forecated wickets trend is plotted. The test set is also plotted to see how close the forecast and the actual matches

par(mfrow=c(1,3))
par(mar=c(4,4,2,2))
#bowlerPerfForecast("./bowler1.csv","Bowler1")
#bowlerPerfForecast("./bowler2.csv","Bowler2")
#bowlerPerfForecast("./bowler3.csv","Bowler3")
dev.off()
## null device 
##           1

29. Contribution to matches won and lost

As discussed above the next 2 charts require the use of getPlayerDataSp(). This can only be done for Test matches

#bowler1sp <- getPlayerDataSp(xxxx,tdir=".",tfile="bowler1sp.csv",ttype="bowling")
#bowler2sp <- getPlayerDataSp(xxxx,tdir=".",tfile="bowler2sp.csv",ttype="bowling")
#bowler3sp <- getPlayerDataSp(xxxx,tdir=".",tfile="bowler3sp.csv",ttype="bowling")
par(mfrow=c(1,3))
par(mar=c(4,4,2,2))
#bowlerContributionWonLost("bowler1sp","Bowler1")
#bowlerContributionWonLost("bowler2sp","Bowler2")
#bowlerContributionWonLost("bowler3sp","Bowler3")
dev.off()
## null device 
##           1

30. Performance home and overseas.

This can only be done for Test matches

par(mfrow=c(1,3))
par(mar=c(4,4,2,2))
#bowlerPerfHomeAway("bowler1sp","Bowler1")
#bowlerPerfHomeAway("bowler2sp","Bowler2")
#bowlerPerfHomeAway("bowler3sp","Bowler3")
dev.off()
## null device 
##           1

31 Relative Wickets Frequency Percentage

frames <- list("./bowler1.csv","./bowler3.csv","bowler2.csv")
names <- list("Bowler1","Bowler3","Bowler2")
#relativeBowlingPerf(frames,names)

32 Relative Economy Rate against wickets taken

frames <- list("./bowler1.csv","./bowler3.csv","bowler2.csv")
names <- list("Bowler1","Bowler3","Bowler2")
#relativeBowlingER(frames,names)

33 Relative cumulative average wickets of bowlers in career

frames <- list("./bowler1.csv","./bowler3.csv","bowler2.csv")
names <- list("Bowler1","Bowler3","Bowler2")
#relativeBowlerCumulativeAvgWickets(frames,names)

34 Relative cumulative average economy rate of bowlers

frames <- list("./bowler1.csv","./bowler3.csv","bowler2.csv")
names <- list("Bowler1","Bowler3","Bowler2")
#relativeBowlerCumulativeAvgEconRate(frames,names)

35 Check for bowler in-form/out-of-form

The below computation uses Null Hypothesis testing and p-value to determine if the bowler is in-form or out-of-form. For this 90% of the career wickets is chosen as the population and the mean computed. The last 10% is chosen to be the sample set and the sample Mean and the sample Standard Deviation are caculated.

The Null Hypothesis (H0) assumes that the bowler continues to stay in-form where the sample mean is within 95% confidence interval of population mean The Alternative (Ha) assumes that the bowler is out of form the sample mean is beyond the 95% confidence interval of the population mean.

A significance value of 0.05 is chosen and p-value us computed If p-value >= .05 – Batsman In-Form If p-value < 0.05 – Batsman Out-of-Form

Note Ideally the p-value should be done for a population that follows the Normal Distribution. But the runs population is usually left skewed. So some correction may be needed. I will revisit this later

Note: The check for the form status of the bowlers indicate

#checkBowlerInForm("./bowler1.csv","Bowler1")
#checkBowlerInForm("./bowler2.csv","Bowler2")
#checkBowlerInForm("./bowler3.csv","Bowler3")
dev.off()
## null device 
##           1

36. Performing granular analysis of batsmen and bowlers

To perform granular analysis of batsmen and bowlers do the following 2 steps

  1. Step 1: getPlayerDataHA – This function is a wrapper around getPlayerData(), getPlayerDataOD() and getPlayerDataTT(), and adds an extra column ‘homeOrAway’ which says whether the match was played at home/away/neutral venues. A CSV file is created with this new column.
  2. Step2:getPlayerDataOppnHA – This function allows you to slice & dice the data for batsmen and bowlers against specific oppositions, at home/away/neutral venues and between certain periods. This reduced subset of data can be used to perform analyses. A CSV file is created as an output based on the parameters of opposition, home or away and the interval of time

See Cricketr learns new tricks : Performs fine-grained analysis of players

37. GetPlayerDataHA (Batsmen, Tests)

#This saves a file playerTestHA.csv
#df=getPlayerDataHA(<profileNo>,tfile="playerTestHA.csv",type="batting", matchType="Test")

#Use the generate file to create a subset of data
#df1=getPlayerDataOppnHA(infile="playerTestHA.csv",outfile="playerTestFile1.csv",
#                         startDate=<start Date>,endDate=<end Date>)

38. GetPlayerDataHA (Bowlers, Tests)

#This saves a file playerTestHA.csv
#df=getPlayerDataHA(<profileNo>,tfile="playerTestHA.csv",type="bowling", matchType="Test")

#Use the generate file to create a subset of data
#df1=getPlayerDataOppnHA(infile="playerTestHA.csv",outfile="playerTestFile1.csv",
#                         startDate=<start Date>,endDate=<end Date>)

39. GetPlayerDataHA (Batsmen, ODI)

#This saves a file playerTestHA.csv
#df=getPlayerDataHA(<profileNo>,tfile="playerODIHA.csv",type="batting", matchType="ODI")

#Use the generate file to create a subset of data
#df1=getPlayerDataOppnHA(infile="playerODIHA.csv",outfile="playerODIFile1.csv",
#                         startDate=<start Date>,endDate=<end Date>)

40. GetPlayerDataHA (Bowlers, ODI)

#This saves a file playerTestHA.csv
#df=getPlayerDataHA(<profileNo>,tfile="playerODIHA.csv",type="bowling", matchType="ODI")

#Use the generate file to create a subset of data
#df1=getPlayerDataOppnHA(infile="playerODIHA.csv",outfile="playerODIFile1.csv",
#                         startDate=<start Date>,endDate=<end Date>)

41. GetPlayerDataHA (Batsmen, T20)

#This saves a file playerTestHA.csv
#df=getPlayerDataHA(<profileNo>,tfile="playerT20HA.csv",type="batting", matchType="T20")

#Use the generate file to create a subset of data
#df1=getPlayerDataOppnHA(infile="playerT20HA.csv",outfile="playerT20File1.csv",
#                         startDate=<start Date>,endDate=<end Date>)

42. GetPlayerDataHA (Bowlers, T20)

#This saves a file playerTestHA.csv
#df=getPlayerDataHA(<profileNo>,tfile="playerT20HA.csv",type="bowling", matchType="T20")

#Use the generate file to create a subset of data
#df1=getPlayerDataOppnHA(infile="playerT20HA.csv",outfile="playerT20File1.csv",
#                         startDate=<start Date>,endDate=<end Date>)

Important Note Once you get the subset of data for batsmen and bowlers playerTestFile1.csv, playerODIFile1.csv or playerT20File1.csv , you can use any of the cricketr functions on the subset of data for a fine-grained analysis

8. Performances of teams

The following functions will get the team data for Tests, ODI and T20s

1a. Get Test team data

#country1Test= getTeamDataHomeAway(dir=".",teamView="bat",matchType="Test",file="country1Test.csv",save=True,teamName="Country1")
#country2Test= getTeamDataHomeAway(dir=".",teamView="bat",matchType="Test",file="country2Test.csv",save=True,teamName="Country2")
#country3Test= getTeamDataHomeAway(dir=".",teamView="bat",matchType="Test",file="country3Test.csv",save=True,teamName="Country3")

1b. Get ODI team data

#team1ODI=  getTeamDataHomeAway(dir=".",matchType="ODI",file="team1ODI.csv",save=True,teamName="team1")
#team2ODI=  getTeamDataHomeAway(dir=".",matchType="ODI",file="team2ODI.csv",save=True,teamName="team2")
#team3ODI=  getTeamDataHomeAway(dir=".",matchType="ODI",file="team3ODI.csv",save=True,teamName="team3")

1c. Get T20 team data

#team1T20 = getTeamDataHomeAway(matchType="T20",file="team1T20.csv",save=True,teamName="team1")
#team2T20 = getTeamDataHomeAway(matchType="T20",file="team2T20.csv",save=True,teamName="team2")
#team3T20 = getTeamDataHomeAway(matchType="T20",file="team3T20.csv",save=True,teamName="team3")

2a. Test – Analyzing test performances against opposition

# Get the performance of Indian test team against all teams at all venues as a dataframe
#df <- teamWinLossStatusVsOpposition("country1Test.csv",teamName="Country1",opposition=c("all"),homeOrAway=c("all"),matchType="Test",plot=FALSE)
#head(df)

# Plot the performance of Country1 Test team  against all teams at all venues
#teamWinLossStatusVsOpposition("country1Test.csv",teamName="Country1",opposition=c("all"),homeOrAway=c("all"),matchType="Test",plot=TRUE)

# Plot the performance of Country1 Test team  against specific teams at home/away venues
#teamWinLossStatusVsOpposition("country1Test.csv",teamName="Country1",opposition=c("Country2","Country3","Country4"),homeOrAway=c("home","away","neutral"),matchType="Test",plot=TRUE)

2b. Test – Analyzing test performances against opposition at different grounds

# Get the performance of Indian test team against all teams at all venues as a dataframe
#df <- teamWinLossStatusAtGrounds("country1Test.csv",teamName="Country1",opposition=c("all"),homeOrAway=c("all"),matchType="Test",plot=FALSE)
#head(df)

# Plot the performance of Country1 Test team  against all teams at all venues
#teamWinLossStatusAtGrounds("country1Test.csv",teamName="Country1",opposition=c("all"),homeOrAway=c("all"),matchType="Test",plot=TRUE)

# Plot the performance of Country1 Test team  against specific teams at home/away venues
#teamWinLossStatusAtGrounds("country1Test.csv",teamName="Country1",opposition=c("Country2","Country3","Country4"),homeOrAway=c("home","away","neutral"),matchType="Test",plot=TRUE)

2c. Test – Plot time lines of wins and losses

#plotTimelineofWinsLosses("country1Test.csv",team="Country1",opposition=c("all"), #startDate="1970-01-01",endDate="2017-01-01")
#plotTimelineofWinsLosses("country1Test.csv",team="Country1",opposition=c("Country2","Count#ry3","Country4"), homeOrAway=c("home",away","neutral"), startDate=<start Date> #,endDate=<endDate>)

3a. ODI – Analyzing test performances against opposition

#df <- teamWinLossStatusVsOpposition("team1ODI.csv",teamName="Team1",opposition=c("all"),homeOrAway=c("all"),matchType="ODI",plot=FALSE)
#head(df)

# Plot the performance of team1  in ODIs against Sri Lanka, India at all venues
#teamWinLossStatusVsOpposition("team1ODI.csv",teamName="Team1",opposition=c("all"),homeOrAway=c(all"),matchType="ODI",plot=TRUE)

# Plot the performance of Team1 ODI team  against specific teams at home/away venues
#teamWinLossStatusVsOpposition("team1ODI.csv",teamName="Team1",opposition=c("Team2","Team3","Team4"),homeOrAway=c("home","away","neutral"),matchType="ODI",plot=TRUE)

3b. ODI – Analyzing test performances against opposition at different venues

#df <- teamWinLossStatusAtGrounds("team1ODI.csv",teamName="Team1",opposition=c("all"),homeOrAway=c("all"),matchType="ODI",plot=FALSE)
#head(df)

# Plot the performance of Team1s in ODIs specific ODI teams at all venues
#teamWinLossStatusAtGrounds("team1ODI.csv",teamName="Team1",opposition=c("all"),homeOrAway=c(all"),matchType="ODI",plot=TRUE)

# Plot the performance of Team1 against specific ODI teams at home/away venues
#teamWinLossStatusAtGrounds("team1ODI.csv",teamName="Team1",opposition=c("Team2","Team3","Team4"),homeOrAway=c("home","away","neutral"),matchType="ODI",plot=TRUE)

3c. ODI – Plot time lines of wins and losses

#Plot the time line of wins/losses of Bangladesh ODI team between 2 dates all venues
#plotTimelineofWinsLosses("team1ODI.csv",team="Team1",startDate=<start date> ,endDa#te=<end date>,matchType="ODI")

#Plot the time line of wins/losses against specific opposition between 2 dates
#plotTimelineofWinsLosses("team1ODI.csv",team="Team1",opposition=c("Team2","Team2"), homeOrAway=c("home",away","neutral"), startDate=<start date>,endDate=<end date> ,matchType="ODI")

4a. T20 – Analyzing test performances against opposition

#df <- teamWinLossStatusVsOpposition("teamT20.csv",teamName="Team1",opposition=c("all"),homeOrAway=c("all"),matchType="T20",plot=FALSE)
#head(df)

# Plot the performance of Team1 in T20s  against  all opposition at all venues
#teamWinLossStatusVsOpposition("teamT20.csv",teamName="Team1",opposition=c("all"),homeOrAway=c(all"),matchType="T20",plot=TRUE)

# Plot the performance of T20 Test team  against specific teams at home/away venues
#teamWinLossStatusVsOpposition("teamT20.csv",teamName="Team1",opposition=c("Team2","Team3","Team4"),homeOrAway=c("home","away","neutral"),matchType="T20",plot=TRUE)

4b. T20 – Analyzing test performances against opposition at different venues

#df <- teamWinLossStatusAtGrounds("teamT20.csv",teamName="Team1",opposition=c("all"),homeOrAway=c("all"),matchType="T20",plot=FALSE)
#head(df)

# Plot the performance of Team1s in ODIs specific ODI teams at all venues
#teamWinLossStatusAtGrounds("teamT20.csv",teamName="Team1",opposition=c("all"),homeOrAway=c(all"),matchType="T20",plot=TRUE)

# Plot the performance of Team1 against specific ODI teams at home/away venues
#teamWinLossStatusAtGrounds("teamT20.csv",teamName="Team1",opposition=c("Team2","Team3","Team4"),homeOrAway=c("home","away","neutral"),matchType="T20",plot=TRUE)

4c. T20 – Plot time lines of wins and losses

#Plot the time line of wins/losses of Bangladesh ODI team between 2 dates all venues
#plotTimelineofWinsLosses("teamT20.csv",team="Team1",startDate=<start date> ,endDa#te=<end date>,matchType="T20")

#Plot the time line of wins/losses against specific opposition between 2 dates
#plotTimelineofWinsLosses("teamT20.csv",team="Team1",opposition=c("Team2","Team2"), homeOrAway=c("home",away","neutral"), startDate=<start date>,endDate=<end date> ,matchType="T20")

Key Findings

Analysis of batsman

Analysis of bowlers

Analysis of teams

Conclusion

Using the above template, analysis can be done for both batsmen and bowlers in Test, ODI and T20. Also analysis of any any team in Test, ODI and T20 against other specific opposition, at home/away and neutral venues can be performed.

Have fun with cricketr!!

Cricketr learns new tricks : Performs fine-grained analysis of players

“He felt that his whole life was some kind of dream and he sometimes wondered whose it was and whether they were enjoying it.”

“The ships hung in the sky in much the same way that bricks don’t.”

“We demand rigidly defined areas of doubt and uncertainty!”

“For a moment, nothing happened. Then, after a second or so, nothing continued to happen.”

“The Answer to the Great Question… Of Life, the Universe and Everything… Is… Forty-two,’ said Deep Thought, with infinite majesty and calm.”

                 The Hitchhiker's Guide to the Galaxy - Douglas Adams

Introduction

In this post, I introduce 2 new functions in my R package ‘cricketr’ (cricketr v0.22) see Re-introducing cricketr! : An R package to analyze performances of cricketers which enable granular analysis of batsmen and bowlers. They are

  1. Step 1: getPlayerDataHA – This function is a wrapper around getPlayerData(), getPlayerDataOD() and getPlayerDataTT(), and adds an extra column ‘homeOrAway’ which says whether the match was played at home/away/neutral venues. A CSV file is created with this new column.
  2. Setp 2: getPlayerDataOppnHA – This function allows you to slice & dice the data for batsmen and bowlers against specific oppositions, at home/away/neutral venues and between certain periods. This reduced subset of data can be used to perform analyses. A CSV file is created as an output based on the parameters of opposition, home or away and the interval of time

Note All the existing cricketr functions can be used on this smaller fine-grained data set for a closer analysis of players

Note 1: You have to call the above functions only once. You can reuse the CSV files in other functions

Important note: Don’t go too fine-grained by choosing just one opposition, in one of home/away/neutral and for too short a period. Too small a dataset may defeat the purpose of the analysis!

This post has been published in Rpubs and can be accessed at Cricketr learns new tricks

You can download a PDF version of this post at Cricketr learns new tricks

If you are passionate about cricket, and love analyzing cricket performances, then check out my racy book on cricket ‘Cricket analytics with cricketr and cricpy – Analytics harmony with R & Python’! This book discusses and shows how to use my R package ‘cricketr’ and my Python package ‘cricpy’ to analyze batsmen and bowlers in all formats of the game (Test, ODI and T20). The paperback is available on Amazon at $21.99 and  the kindle version at $9.99/Rs 449/-. A must read for any cricket lover! Check it out!!

You can download the latest PDF version of the book  at  ‘Cricket analytics with cricketr and cricpy: Analytics harmony with R and Python-6th edition

Untitled

1. Analyzing Tendulkar at 3 different stages of his career

The following functions analyze Sachin Tendulkar during 3 different periods of his illustrious career. a) 1st Jan 2001-1st Jan 2002 b) 1st Jan 2005-1st Jan 2006 c) 1st Jan 2012-1st Jan 2013

# Get the homeOrAway dataset for Tendulkar in matches
#Note: I have commented the lines to getPlayerDataHA() as I already have 
# CSV file
#df=getPlayerDataHA(35320,tfile="tendulkarTestHA.csv",matchType="Test")

# Get Tendulkar's data for 2001-02
df1=getPlayerDataOppnHA(infile="tendulkarHA.csv",outfile="tendulkarTest2001.csv",
                         startDate="2001-01-01",endDate="2002-01-01")

# Get Tendulkar's data for 2005-06
df2=getPlayerDataOppnHA(infile="tendulkarHA.csv",outfile="tendulkarTest2005.csv",

                                               startDate="2005-01-01",endDate="2006-01-01")

# Get Tendulkar's data for 20012-13
#df3=getPlayerDataOppnHA(infile="tendulkarHA.csv",outfile="tendulkarTest2012.csv",
#                        startDate="2012-01-01",endDate="2013-01-01")

`

1a Mean strike rate of Tendulkar in 2001,2005,2012

Note: Any of the cricketr R functions can be used on the fine-grained subset of data as below. The mean strike rate of Tendulkar is of the order of 60+ in 2001 which decreases to 50 and later to around 45

# Compute and plot mean strike rate of Tendulkar in the 3 periods
batsmanMeanStrikeRate ("./tendulkarTest2001.csv","Tendulkar-2001")

batsmanMeanStrikeRate ("./tendulkarTest2005.csv","Tendulkar-2005")

batsmanMeanStrikeRate ("./tendulkarTest2012.csv","Tendulkar-2012")

1b. Plot the performance of Tendulkar at venues during 2001,2005,2012

On an average Tendulkar score 60+ in 2001 and is really blazing. This performance decreases in 2005 and later in 2012

par(mfrow=c(1,3))
par(mar=c(4,4,2,2))
batsmanAvgRunsGround("tendulkarTest2001.csv","Tendulkar-2001")
batsmanAvgRunsGround("tendulkarTest2005.csv","Tendulkar-2005")
batsmanAvgRunsGround("tendulkarTest2012.csv","Tendulkar-2012")

dev.off()

1c. Plot the performance of Tendulkar against different oppositions during 2001,2005,2012

Sachin uniformly scores 50+ against formidable oppositions in 2001. In 2005 this decreases to 40 in 2005 and in 2012 it is around 25

batsmanAvgRunsOpposition("tendulkarTest2001.csv","Tendulkar-2001")
batsmanAvgRunsOpposition("tendulkarTest2005.csv","Tendulkar-2005")

batsmanAvgRunsOpposition("tendulkarTest2012.csv","Tendulkar-2012")

1d. Plot the relative cumulative average and relative strike rate of Tendulkar in 2001,2005,2012

The plot below compares Tendulkar’s cumulative strike rate and cumulative average during 3 different stages of his career

  1. The cumulative average runs of Tendulkar is in the high 60+ in 2001, which drops to ~50 in 2005 and later plummets to the low 25s in 2012
  2. The strike rate in 2001 for Tendulkar is amazing 60+
frames=list("tendulkarTest2001.csv","tendulkarTest2005.csv","tendulkarTest2012.csv")
names=list("Tendulkar-2001","Tendulkar-2005","Tendulkar-2012")
relativeBatsmanCumulativeAvgRuns(frames,names)

relativeBatsmanCumulativeStrikeRate(frames,names)

2. Analyzing Virat Kohli’s performance against England in England in 2014 and 2018

The analysis below looks at Kohli’s performance against England in ‘away’ venues (England) in 2014 and 2018

# Get the homeOrAway data for Kohli in Test matches
#df=getPlayerDataHA(253802,tfile="kohliTestHA.csv",type="batting",matchType="Test")

# Get the subset if data of Kohli's performance against England in England in 2014
df=getPlayerDataOppnHA(infile="kohliTestHA.csv",outfile="kohliTestEng2014.csv",
   opposition=c("England"),homeOrAway=c("away"),startDate="2014-01-01",endDate="2015-01-01")

# Get the subset if data of Kohli's performance against England in England in 2018
df1=getPlayerDataOppnHA(infile="kohliHA.csv",outfile="kohliTestEng2018.csv",
   opposition=c("England"),homeOrAway=c("away"),startDate="2018-01-01",endDate="2019-01-01")

2a. Kohli’s performance at England grounds in 2014 & 2018

Kohli had a miserable outing to England in 2014 with a string of low scores. In 2018 Kohli pulls himself out of the morass

batsmanAvgRunsGround("kohliTestEng2014.csv","Kohli-Eng-2014")

batsmanAvgRunsGround("kohliTestEng2018.csv","Kohli-Eng-2018")

2a. Kohli’s cumulative average runs in 2014 & 2018

Kohli’s cumulative average runs in 2014 is in the low 15s, while in 2018 it is 70+. Kohli stamps his class back again and undoes the bad memories of 2014

batsmanCumulativeAverageRuns("kohliTestEng2014.csv", "Kohli-Eng-2014")

batsmanCumulativeAverageRuns("kohliTestEng2018.csv", "Kohli-Eng-2018")

3a. Compare the performances of Ganguly, Dravid and VVS Laxman against opposition in ‘away’ matches in Tests

The analyses below compares the performances of Sourav Ganguly, Rahul Dravid and VVS Laxman against Australia, South Africa, and England in ‘away’ venues between 01 Jan 2002 to 01 Jan 2008

#Get the HA data for Ganguly, Dravid and Laxman
#df=getPlayerDataHA(28779,tfile="gangulyTestHA.csv",type="batting",matchType="Test")
#df=getPlayerDataHA(28114,tfile="dravidTestHA.csv",type="batting",matchType="Test")
#df=getPlayerDataHA(30750,tfile="laxmanTestHA.csv",type="batting",matchType="Test")


# Slice the data 
df=getPlayerDataOppnHA(infile="gangulyTestHA.csv",outfile="gangulyTestAES2002-08.csv"
                       ,opposition=c("Australia", "England", "South Africa"),
                       homeOrAway=c("away"),startDate="2002-01-01",endDate="2008-01-01")


df=getPlayerDataOppnHA(infile="dravidTestHA.csv",outfile="dravidTestAES2002-08.csv"
                       ,opposition=c("Australia", "England", "South Africa"),
                       homeOrAway=c("away"),startDate="2002-01-01",endDate="2008-01-01")


df=getPlayerDataOppnHA(infile="laxmanTestHA.csv",outfile="laxmanTestAES2002-08.csv"
                       ,opposition=c("Australia", "England", "South Africa"),
                       homeOrAway=c("away"),startDate="2002-01-01",endDate="2008-01-01")

3b Plot the relative cumulative average runs and relative cumative strike rate

Plot the relative cumulative average runs and relative cumative strike rate of Ganguly, Dravid and Laxman

-Dravid towers over Laxman and Ganguly with respect to cumulative average runs. – Ganguly has a superior strike rate followed by Laxman and then Dravid

frames=list("gangulyTestAES2002-08.csv","dravidTestAES2002-08.csv","laxmanTestAES2002-08.csv")
names=list("GangulyAusEngSA2002-08","DravidAusEngSA2002-08","LaxmanAusEngSA2002-08")
relativeBatsmanCumulativeAvgRuns(frames,names)

relativeBatsmanCumulativeStrikeRate(frames,names)

4. Compare the ODI performances of Rohit Sharma, Joe Root and Kane Williamson against opposition

Compare the performances of Rohit Sharma, Joe Root and Kane williamson in away & neutral venues against Australia, West Indies and Soouth Africa

  • Joe Root piles us the runs in about 15 matches. Rohit has played far more ODIs than the other two and averages a steady 35+
# Get the ODI HA data for Rohit, Root and Williamson
#df=getPlayerDataHA(34102,tfile="rohitODIHA.csv",type="batting",matchType="ODI")
#df=getPlayerDataHA(303669,tfile="joerootODIHA.csv",type="batting",matchType="ODI")
#df=getPlayerDataHA(277906,tfile="williamsonODIHA.csv",type="batting",matchType="ODI")

# Subset the data for specific opposition in away and neutral venues
df=getPlayerDataOppnHA(infile="rohitODIHA.csv",outfile="rohitODIAusWISA.csv"
                       ,opposition=c("Australia", "West Indies", "South Africa"),
                      homeOrAway=c("away","neutral"))

df=getPlayerDataOppnHA(infile="joerootODIHA.csv",outfile="joerootODIAusWISA.csv"
                       ,opposition=c("Australia", "West Indies", "South Africa"),
                       homeOrAway=c("away","neutral"))

df=getPlayerDataOppnHA(infile="williamsonODIHA.csv",outfile="williamsonODIAusWiSA.csv"
                       ,opposition=c("Australia", "West Indies", "South Africa"),
                       homeOrAway=c("away","neutral"))

4a. Compare cumulative strike rates and cumulative average runs of Rohit, Root and Williamson

The relative cumulative strike rate of all 3 are comparable

frames=list("rohitODIAusWISA.csv","joerootODIAusWISA.csv","williamsonODIAusWiSA.csv")
names=list("Rohit-ODI-AusWISA","Joe Root-ODI-AusWISA","Williamson-ODI-AusWISA")
relativeBatsmanCumulativeAvgRuns(frames,names)

relativeBatsmanCumulativeStrikeRate(frames,names)

5. Plot the performance of Dhoni in T20s against specific opposition at all venues

Plot the performances of Dhoni against Australia, West Indies, South Africa and England

# Get the HA T20 data for Dhoni
#df=getPlayerDataHA(28081,tfile="dhoniT20HA.csv",type="batting",matchType="T20")

#Subset the data
df=getPlayerDataOppnHA(infile="dhoniT20HA.csv",outfile="dhoniT20AusWISAEng.csv"
                       ,opposition=c("Australia", "West Indies", "South Africa","England"),
                       homeOrAway=c("all"))

5a. Plot Dhoni’s performances in T20

Note You can use any of cricketr’s functions against the fine grained data

batsmanAvgRunsOpposition("dhoniT20AusWISAEng.csv","Dhoni")

batsmanAvgRunsGround("dhoniT20AusWISAEng.csv","Dhoni")

batsmanCumulativeStrikeRate("dhoniT20AusWISAEng.csv","Dhoni")

batsmanCumulativeAverageRuns("dhoniT20AusWISAEng.csv","Dhoni")

6. Compute and performances of Anil Kumble, Muralitharan and Warne in ‘away’ test matches

Compute the performances of Kumble, Warne and Maralitharan against New Zealand, West Indies, South Africa and England in pitches that are not ‘home’ pithes

# Get the bowling data for Kumble, Warne and Muralitharan in Test matches
#df=getPlayerDataHA(30176,tfile="kumbleTestHA.csv",type="bowling",matchType="Test")
#df=getPlayerDataHA(8166,tfile="warneTestHA.csv",type="bowling",matchType="Test")
#df=getPlayerDataHA(49636,tfile="muraliTestHA.csv",type="bowling",matchType="Test")


# Subset the data
df=getPlayerDataOppnHA(infile="kumbleTestHA.csv",outfile="kumbleTest-NZWISAEng.csv"
                       ,opposition=c("New Zealand", "West Indies", "South Africa","England"),
                       homeOrAway=c("away"))

df=getPlayerDataOppnHA(infile="warneTestHA.csv",outfile="warneTest-NZWISAEng.csv"
                       ,opposition=c("New Zealand", "West Indies", "South Africa","England"),
                       homeOrAway=c("away"))

df=getPlayerDataOppnHA(infile="muraliTestHA.csv",outfile="muraliTest-NZWISAEng.csv"
                       ,opposition=c("New Zealand", "West Indies", "South Africa","England"),
                       homeOrAway=c("away"))

6a. Plot the average wickets of Kumble, Warne and Murali

bowlerAvgWktsOpposition("kumbleTest-NZWISAEng.csv","Kumble-NZWISAEng-AN")

bowlerAvgWktsOpposition("warneTest-NZWISAEng.csv","Warne-NZWISAEng-AN")

bowlerAvgWktsOpposition("muraliTest-NZWISAEng.csv","Murali-NZWISAEng-AN")

6b. Plot the average wickets in different grounds of Kumble, Warne and Murali

bowlerAvgWktsGround("kumbleTest-NZWISAEng.csv","Kumblew")

bowlerAvgWktsGround("warneTest-NZWISAEng.csv","Warne")

bowlerAvgWktsGround("muraliTest-NZWISAEng.csv","murali")

6c. Plot the cumulative average wickets and cumulative economy rate of Kumble, Warne and Murali

  • Murali has the best economy rate followed by Kumble and then Warne
  • Again Murali has the best cumulative average wickets followed by Warne and then Kumble
frames=list("kumbleTest-NZWISAEng.csv","warneTest-NZWISAEng.csv","muraliTest-NZWISAEng.csv")
names=list("Kumble","Warne","Murali")
relativeBowlerCumulativeAvgEconRate(frames,names)

relativeBowlerCumulativeAvgWickets(frames,names)

7. Compute and plot the performances of Bumrah in 2016, 2017 and 2018 in ODIs

# Get the HA data for Bumrah in ODI in bowling
df=getPlayerDataHA(625383,tfile="bumrahODIHA.csv",type="bowling",matchType="ODI")
## [1] "Working..."
# Slice the data for periods 2016, 2017 and 2018
df=getPlayerDataOppnHA(infile="bumrahODIHA.csv",outfile="bumrahODI2016.csv",
                       startDate="2016-01-01",endDate="2017-01-01")

df=getPlayerDataOppnHA(infile="bumrahODIHA.csv",outfile="bumrahODI2017.csv",
                       startDate="2017-01-01",endDate="2018-01-01")

df=getPlayerDataOppnHA(infile="bumrahODIHA.csv",outfile="bumrahODI2018.csv",
                       startDate="2018-01-01",endDate="2019-01-01")

7a. Compute the performances of Bumrah in 2016, 2017 and 2018

  • Very clearly Bumrah is getting better at his art. His economy rate in 2018 is the best!!!
  • Bumrah has had a very prolific year in 2017. However all the years he seems to be quite effective
frames=list("bumrahODI2016.csv","bumrahODI2017.csv","bumrahODI2018.csv")
names=list("Bumrah-2016","Bumrah-2017","Bumrah-2018")
relativeBowlerCumulativeAvgEconRate(frames,names)

relativeBowlerCumulativeAvgWickets(frames,names)

8. Compute and plot the performances of Shakib, Bumrah and Jadeja in T20 matches for bowling

# Get the HA bowling data for Shakib, Bumrah and Jadeja
df=getPlayerDataHA(56143,tfile="shakibT20HA.csv",type="bowling",matchType="T20")
## [1] "Working..."
df=getPlayerDataHA(625383,tfile="bumrahT20HA.csv",type="bowling",matchType="T20")
## [1] "Working..."
df=getPlayerDataHA(234675,tfile="jadejaT20HA.csv",type="bowling",matchType="T20")
## [1] "Working..."
# Slice the data for performances against Sri Lanka, Australia, South Africa and England
df=getPlayerDataOppnHA(infile="shakibT20HA.csv",outfile="shakibT20-SLAusSAEng.csv"
                       ,opposition=c("Sri Lanka","Australia", "South Africa","England"),
                       homeOrAway=c("all"))
df=getPlayerDataOppnHA(infile="bumrahT20HA.csv",outfile="bumrahT20-SLAusSAEng.csv"
                       ,opposition=c("Sri Lanka","Australia", "South Africa","England"),
                       homeOrAway=c("all"))

df=getPlayerDataOppnHA(infile="jadejaT20HA.csv",outfile="jadejaT20-SLAusSAEng.csv"
                       ,opposition=c("Sri Lanka","Australia", "South Africa","England"),
                       homeOrAway=c("all"))

8a. Compare the relative performances of Shakib, Bumrah and Jadeja

  • Jadeja and Bumrah have comparable economy rates. Shakib is more expensive
  • Shakib pips Bumrah in number of cumulative wickets, though Bumrah is close behind
frames=list("shakibT20-SLAusSAEng.csv","bumrahT20-SLAusSAEng.csv","jadejaT20-SLAusSAEng.csv")
names=list("Shakib-SLAusSAEng","Bumrah-SLAusSAEng","Jadeja-SLAusSAEng")
relativeBowlerCumulativeAvgEconRate(frames,names)

relativeBowlerCumulativeAvgWickets(frames,names)

Conclusion

By getting the homeOrAway data for players using the profileNo, you can slice and dice the data based on your choice of opposition, whether you want matches that were played at home/away/neutral venues. Finally by specifying the period for which the data has to be subsetted you can create fine grained analysis.

Hope you have a great time with cricketr!!!

Also see

1. My book ‘Deep Learning from first principles:Second Edition’ now on Amazon
2. Cricpy takes a swing at the ODIs
3. My book ‘Practical Machine Learning in R and Python: Third edition’ on Amazon
4. Googly: An interactive app for analyzing IPL players, matches and teams using R package yorkr
5. Big Data-2: Move into the big league:Graduate from R to SparkR
6. Rock N’ Roll with Bluemix, Cloudant & NodeExpress
7. A method to crowd source pothole marking on (Indian) roads
8. De-blurring revisited with Wiener filter using OpenCV

To see all posts click Index of posts

Analyzing cricketers’ and cricket team’s performances with cricketr template

This post includes a template which you can use for analyzing the performances of cricketers, both batsmen and bowlers in Test, ODI and Twenty 20 cricket. Additionally this template can also be used for analyzing performances of teams in Test, ODI and T20 matches using my R package cricketr. To see actual usage of functions related to players in the R package cricketr see Introducing cricketr! : An R package to analyze performances of cricketers and associated posts on cricket in Index of posts. For the analyses on team performances see https://gigadom.in/2019/06/21/cricpy-adds-team-analytics-to-its-repertoire/

The ‘cricketr’ package uses the statistics info available in ESPN Cricinfo Statsguru. The current version of this package supports all formats of the game including Test, ODI and Twenty20 versions.

You should be able to install the package from GitHub and use the many functions available in the package. Please mindful of the ESPN Cricinfo Terms of Use

Take a look at my short video tutorial on my R package cricketr on Youtube – R package cricketr – A short tutorial

Do check out my interactive Shiny app implementation using the cricketr package – Sixer – R package cricketr’s new Shiny avatar

You can download this RMarkdown file from Github at cricketr-template

You can download the latest PDF version of the book  at  ‘Cricket analytics with cricketr and cricpy: Analytics harmony with R and Python-6th edition

The cricketr package

The cricketr package has several functions that perform several different analyses on both batsman and bowlers. The package can also analyze performances of teams The package has function that plot percentage frequency runs or wickets, runs likelihood for a batsman, relative run/strike rates of batsman and relative performance/economy rate for bowlers are available. Other interesting functions include batting performance moving average, forecast and a function to check whether the batsmans in in-form or out-of-form.

In addition performances of teams against different oppositions at different venues can be computed and plotted. The timeline of wins & losses can be plotted.

A. Performances of batsmen and bowlers

The data for a particular player can be obtained with the getPlayerData() function. To do you will need to go to ESPN CricInfo Player and type in the name of the player for e.g Ricky Ponting, Sachin Tendulkar etc. This will bring up a page which have the profile number for the player e.g. for Sachin Tendulkar this would be http://www.espncricinfo.com/india/content/player/35320.html. Hence, Sachin’s profile is 35320. This can be used to get the data for Tendulkar as shown below

The cricketr package is now available from CRAN!!! You should be able to install as below

1. Install the cricketr package

if (!require("cricketr")){
    install.packages("cricketr",lib = "c:/test")
}
library(cricketr)

The cricketr package includes some pre-packaged sample (.csv) files. You can use these sample to test functions as shown below
# Retrieve the file path of a data file installed with cricketr
#pathToFile <- system.file("data", "tendulkar.csv", package = "cricketr")
#batsman4s(pathToFile, "Sachin Tendulkar")

# The general format is pkg-function(pathToFile,par1,...)
#batsman4s(<path-To-File>,"Sachin Tendulkar")

The pre-packaged files can be accessed as shown above. To get the data of any player use the function in Test, ODI and Twenty20 use the following

2. For Test cricket

#tendulkar <- getPlayerData(35320,dir="..",file="tendulkar.csv",type="batting",homeOrAway=c(1,2), result=c(1,2,4))

2a. For ODI cricket

#tendulkarOD <- getPlayerDataOD(35320,dir="..",file="tendulkarOD.csv",type="batting")

2b For Twenty 20 cricket

#tendulkarT20 <- getPlayerDataTT(35320,dir="..",file="tendulkarT20.csv",type="batting")

Important Note 1: This needs to be done only once for a player. This function stores the player’s data in a CSV file (for e.g. tendulkar.csv as above) which can then be reused for all other functions. Once we have the data for the players many analyses can be done. This post will use the stored CSV file obtained with a prior getPlayerData for all subsequent analyses

Important Note 2: The same set of functions can be used for Tests, ODI and T20s. I have mentioned wherever you may need special functions for ODI and T20 below

Sachin Tendulkar’s performance – Basic Analyses

The 3 plots below provide the following for Tendulkar

  1. Frequency percentage of runs in each run range over the whole career
  2. Mean Strike Rate for runs scored in the given range
  3. A histogram of runs frequency percentages in runs ranges For example

3. Basic analyses

par(mfrow=c(1,3))
par(mar=c(4,4,2,2))
#batsmanRunsFreqPerf("./tendulkar.csv","Tendulkar")
#batsmanMeanStrikeRate("./tendulkar.csv","Tendulkar")
#batsmanRunsRanges("./tendulkar.csv","Tendulkar")
dev.off()
## null device 
##           1
  1. Player 1
  2. Player 2
  3. Player 3
  4. Player 4

4. More analyses

par(mfrow=c(1,3))
par(mar=c(4,4,2,2))
#batsman4s("./player1.csv","Player1")
#batsman6s("./player1.csv","Player1")
#batsmanMeanStrikeRate("./player1.csv","Player1")

# For ODI and T20
#batsmanScoringRateODTT("./player1.csv","Player1")
dev.off()
## null device 
##           1
par(mfrow=c(1,3))
par(mar=c(4,4,2,2))
#batsman4s("./player2.csv","Player2")
#batsman6s("./player2.csv","Player2")
#batsmanMeanStrikeRate("./player2.csv","Player2")
# For ODI and T20
#batsmanScoringRateODTT("./player1.csv","Player1")
dev.off()
## null device 
##           1
par(mfrow=c(1,3))
par(mar=c(4,4,2,2))
#batsman4s("./player3.csv","Player3")
#batsman6s("./player3.csv","Player3")
#batsmanMeanStrikeRate("./player3.csv","Player3")
# For ODI and T20
#batsmanScoringRateODTT("./player1.csv","Player1")

dev.off()
## null device 
##           1
par(mfrow=c(1,3))
par(mar=c(4,4,2,2))
#batsman4s("./player4.csv","Player4")
#batsman6s("./player4.csv","Player4")
#batsmanMeanStrikeRate("./player4.csv","Player4")
# For ODI and T20
#batsmanScoringRateODTT("./player1.csv","Player1")
dev.off()
## null device 
##           1

Note: For mean strike rate in ODI and Twenty20 use the function batsmanScoringRateODTT()

5.Boxplot histogram plot

This plot shows a combined boxplot of the Runs ranges and a histogram of the Runs Frequency

#batsmanPerfBoxHist("./player1.csv","Player1")
#batsmanPerfBoxHist("./player2.csv","Player2")
#batsmanPerfBoxHist("./player3.csv","Player3")
#batsmanPerfBoxHist("./player4.csv","Player4")

6. Contribution to won and lost matches

For the 2 functions below you will have to use the getPlayerDataSp() function. I have commented this as I already have these files. This function can only be used for Test matches

#player1sp <- getPlayerDataSp(xxxx,tdir=".",tfile="player1sp.csv",ttype="batting")
#player2sp <- getPlayerDataSp(xxxx,tdir=".",tfile="player2sp.csv",ttype="batting")
#player3sp <- getPlayerDataSp(xxxx,tdir=".",tfile="player3sp.csv",ttype="batting")
#player4sp <- getPlayerDataSp(xxxx,tdir=".",tfile="player4sp.csv",ttype="batting")
par(mfrow=c(2,2))
par(mar=c(4,4,2,2))
#batsmanContributionWonLost("player1sp.csv","Player1")
#batsmanContributionWonLost("player2sp.csv","Player2")
#batsmanContributionWonLost("player3sp.csv","Player3")
#batsmanContributionWonLost("player4sp.csv","Player4")
dev.off()
## null device 
##           1

7, Performance at home and overseas

This function also requires the use of getPlayerDataSp() as shown above. This can only be used for Test matches

par(mfrow=c(2,2))
par(mar=c(4,4,2,2))
#batsmanPerfHomeAway("player1sp.csv","Player1")
#batsmanPerfHomeAway("player2sp.csv","Player2")
#batsmanPerfHomeAway("player3sp.csv","Player3")
#batsmanPerfHomeAway("player4sp.csv","Player4")
dev.off()
## null device 
##           1

8. Batsman average at different venues

par(mfrow=c(2,2))
par(mar=c(4,4,2,2))
#batsmanAvgRunsGround("./player1.csv","Player1")
#batsmanAvgRunsGround("./player2.csv","Player2")
#batsmanAvgRunsGround("./player3.csv","Ponting")
#batsmanAvgRunsGround("./player4.csv","Player4")
dev.off()
## null device 
##           1

9. Batsman average against different opposition

par(mfrow=c(2,2))
par(mar=c(4,4,2,2))
#batsmanAvgRunsOpposition("./player1.csv","Player1")
#batsmanAvgRunsOpposition("./player2.csv","Player2")
#batsmanAvgRunsOpposition("./player3.csv","Ponting")
#batsmanAvgRunsOpposition("./player4.csv","Player4")
dev.off()
## null device 
##           1

10. Runs Likelihood of batsman

par(mfrow=c(2,2))
par(mar=c(4,4,2,2))
#batsmanRunsLikelihood("./player1.csv","Player1")
#batsmanRunsLikelihood("./player2.csv","Player2")
#batsmanRunsLikelihood("./player3.csv","Ponting")
#batsmanRunsLikelihood("./player4.csv","Player4")
dev.off()
## null device 
##           1

11. Moving Average of runs in career

par(mfrow=c(2,2))
par(mar=c(4,4,2,2))
#batsmanMovingAverage("./player1.csv","Player1")
#batsmanMovingAverage("./player2.csv","Player2")
#batsmanMovingAverage("./player3.csv","Ponting")
#batsmanMovingAverage("./player4.csv","Player4")
dev.off()
## null device 
##           1

12. Cumulative Average runs of batsman in career

par(mfrow=c(2,2))
par(mar=c(4,4,2,2))
#batsmanCumulativeAverageRuns("./player1.csv","Player1")
#batsmanCumulativeAverageRuns("./player2.csv","Player2")
#batsmanCumulativeAverageRuns("./player3.csv","Ponting")
#batsmanCumulativeAverageRuns("./player4.csv","Player4")
dev.off()
## null device 
##           1

13. Cumulative Average strike rate of batsman in career

par(mfrow=c(2,2))
par(mar=c(4,4,2,2))
#batsmanCumulativeStrikeRate("./player1.csv","Player1")
#batsmanCumulativeStrikeRate("./player2.csv","Player2")
#batsmanCumulativeStrikeRate("./player3.csv","Ponting")
#batsmanCumulativeStrikeRate("./player4.csv","Player4")
dev.off()
## null device 
##           1

14. Future Runs forecast

Here are plots that forecast how the batsman will perform in future. In this case 90% of the career runs trend is uses as the training set. the remaining 10% is the test set.

A Holt-Winters forecating model is used to forecast future performance based on the 90% training set. The forecated runs trend is plotted. The test set is also plotted to see how close the forecast and the actual matches

Take a look at the runs forecasted for the batsman below.

par(mfrow=c(2,2))
par(mar=c(4,4,2,2))
#batsmanPerfForecast("./player1.csv","Player1")
#batsmanPerfForecast("./player2.csv","Player2")
#batsmanPerfForecast("./player3.csv","Player3")
#batsmanPerfForecast("./player4.csv","Player4")
dev.off()
## null device 
##           1

15. Relative Mean Strike Rate plot

The plot below compares the Mean Strike Rate of the batsman for each of the runs ranges of 10 and plots them. The plot indicate the following

frames <- list("./player1.csv","./player2.csv","player3.csv","player4.csv")
names <- list("Player1","Player2","Player3","Player4")
#relativeBatsmanSR(frames,names)

16. Relative Runs Frequency plot

The plot below gives the relative Runs Frequency Percetages for each 10 run bucket. The plot below show

frames <- list("./player1.csv","./player2.csv","player3.csv","player4.csv")
names <- list("Player1","Player2","Player3","Player4")
#relativeRunsFreqPerf(frames,names)

17. Relative cumulative average runs in career

frames <- list("./player1.csv","./player2.csv","player3.csv","player4.csv")
names <- list("Player1","Player2","Player3","Player4")
#relativeBatsmanCumulativeAvgRuns(frames,names)

18. Relative cumulative average strike rate in career

frames <- list("./player1.csv","./player2.csv","player3.csv","player4.csv")
names <- list("Player1","Player2","Player3","player4")
#relativeBatsmanCumulativeStrikeRate(frames,names)

19. Check Batsman In-Form or Out-of-Form

The below computation uses Null Hypothesis testing and p-value to determine if the batsman is in-form or out-of-form. For this 90% of the career runs is chosen as the population and the mean computed. The last 10% is chosen to be the sample set and the sample Mean and the sample Standard Deviation are caculated.

The Null Hypothesis (H0) assumes that the batsman continues to stay in-form where the sample mean is within 95% confidence interval of population mean The Alternative (Ha) assumes that the batsman is out of form the sample mean is beyond the 95% confidence interval of the population mean.

A significance value of 0.05 is chosen and p-value us computed If p-value >= .05 – Batsman In-Form If p-value < 0.05 – Batsman Out-of-Form

Note Ideally the p-value should be done for a population that follows the Normal Distribution. But the runs population is usually left skewed. So some correction may be needed. I will revisit this later

This is done for the Top 4 batsman

#checkBatsmanInForm("./player1.csv","Player1")
#checkBatsmanInForm("./player2.csv","Player2")
#checkBatsmanInForm("./player3.csv","Player3")
#checkBatsmanInForm("./player4.csv","Player4")

20. 3D plot of Runs vs Balls Faced and Minutes at Crease

The plot is a scatter plot of Runs vs Balls faced and Minutes at Crease. A prediction plane is fitted

par(mfrow=c(1,2))
par(mar=c(4,4,2,2))
#battingPerf3d("./player1.csv","Player1")
#battingPerf3d("./player2.csv","Player2")
par(mfrow=c(1,2))
par(mar=c(4,4,2,2))
#battingPerf3d("./player3.csv","Player3")
#battingPerf3d("./player4.csv","player4")
dev.off()
## null device 
##           1

21. Predicting Runs given Balls Faced and Minutes at Crease

A multi-variate regression plane is fitted between Runs and Balls faced +Minutes at crease.

BF <- seq( 10, 400,length=15)
Mins <- seq(30,600,length=15)
newDF <- data.frame(BF,Mins)
#Player1 <- batsmanRunsPredict("./player1.csv","Player1",newdataframe=newDF)
#Player2 <- batsmanRunsPredict("./player2.csv","Player2",newdataframe=newDF)
#ponting <- batsmanRunsPredict("./player3.csv","Player3",newdataframe=newDF)
#sangakkara <- batsmanRunsPredict("./player4.csv","Player4",newdataframe=newDF)
#batsmen <-cbind(round(Player1$Runs),round(Player2$Runs),round(Player3$Runs),round(Player4$Runs))
#colnames(batsmen) <- c("Player1","Player2","Player3","Player4")
#newDF <- data.frame(round(newDF$BF),round(newDF$Mins))
#colnames(newDF) <- c("BallsFaced","MinsAtCrease")
#predictedRuns <- cbind(newDF,batsmen)
#predictedRuns

Analysis of bowlers

  1. Bowler1
  2. Bowler2
  3. Bowler3
  4. Bowler4

player1 <- getPlayerData(xxxx,dir=“..”,file=“player1.csv”,type=“bowling”) Note For One day you will have to use getPlayerDataOD() and for Twenty20 it is getPlayerDataTT()

21. Wicket Frequency Plot

This plot below computes the percentage frequency of number of wickets taken for e.g 1 wicket x%, 2 wickets y% etc and plots them as a continuous line

par(mfrow=c(1,3))
par(mar=c(4,4,2,2))
#bowlerWktsFreqPercent("./bowler1.csv","Bowler1")
#bowlerWktsFreqPercent("./bowler2.csv","Bowler2")
#bowlerWktsFreqPercent("./bowler3.csv","Bowler3")
dev.off()
## null device 
##           1

22. Wickets Runs plot

par(mfrow=c(1,3))
par(mar=c(4,4,2,2))
#bowlerWktsRunsPlot("./bowler1.csv","Bowler1")
#bowlerWktsRunsPlot("./bowler2.csv","Bowler2")
#bowlerWktsRunsPlot("./bowler3.csv","Bowler3")
dev.off()
## null device 
##           1

23. Average wickets at different venues

#bowlerAvgWktsGround("./bowler3.csv","Bowler3")

24. Average wickets against different opposition

#bowlerAvgWktsOpposition("./bowler3.csv","Bowler3")

25. Wickets taken moving average

par(mfrow=c(1,3))
par(mar=c(4,4,2,2))
#bowlerMovingAverage("./bowler1.csv","Bowler1")
#bowlerMovingAverage("./bowler2.csv","Bowler2")
#bowlerMovingAverage("./bowler3.csv","Bowler3")

dev.off()
## null device 
##           1

26. Cumulative Wickets taken

par(mfrow=c(1,3))
par(mar=c(4,4,2,2))
#bowlerCumulativeAvgWickets("./bowler1.csv","Bowler1")
#bowlerCumulativeAvgWickets("./bowler2.csv","Bowler2")
#bowlerCumulativeAvgWickets("./bowler3.csv","Bowler3")
dev.off()
## null device 
##           1

27. Cumulative Economy rate

par(mfrow=c(1,3))
par(mar=c(4,4,2,2))
#bowlerCumulativeAvgEconRate("./bowler1.csv","Bowler1")
#bowlerCumulativeAvgEconRate("./bowler2.csv","Bowler2")
#bowlerCumulativeAvgEconRate("./bowler3.csv","Bowler3")
dev.off()
## null device 
##           1

28. Future Wickets forecast

Here are plots that forecast how the bowler will perform in future. In this case 90% of the career wickets trend is used as the training set. the remaining 10% is the test set.

A Holt-Winters forecating model is used to forecast future performance based on the 90% training set. The forecated wickets trend is plotted. The test set is also plotted to see how close the forecast and the actual matches

par(mfrow=c(1,3))
par(mar=c(4,4,2,2))
#bowlerPerfForecast("./bowler1.csv","Bowler1")
#bowlerPerfForecast("./bowler2.csv","Bowler2")
#bowlerPerfForecast("./bowler3.csv","Bowler3")
dev.off()
## null device 
##           1

29. Contribution to matches won and lost

As discussed above the next 2 charts require the use of getPlayerDataSp(). This can only be done for Test matches

#bowler1sp <- getPlayerDataSp(xxxx,tdir=".",tfile="bowler1sp.csv",ttype="bowling")
#bowler2sp <- getPlayerDataSp(xxxx,tdir=".",tfile="bowler2sp.csv",ttype="bowling")
#bowler3sp <- getPlayerDataSp(xxxx,tdir=".",tfile="bowler3sp.csv",ttype="bowling")
par(mfrow=c(1,3))
par(mar=c(4,4,2,2))
#bowlerContributionWonLost("bowler1sp","Bowler1")
#bowlerContributionWonLost("bowler2sp","Bowler2")
#bowlerContributionWonLost("bowler3sp","Bowler3")
dev.off()
## null device 
##           1

30. Performance home and overseas.

This can only be done for Test matches

par(mfrow=c(1,3))
par(mar=c(4,4,2,2))
#bowlerPerfHomeAway("bowler1sp","Bowler1")
#bowlerPerfHomeAway("bowler2sp","Bowler2")
#bowlerPerfHomeAway("bowler3sp","Bowler3")
dev.off()
## null device 
##           1

31 Relative Wickets Frequency Percentage

frames <- list("./bowler1.csv","./bowler3.csv","bowler2.csv")
names <- list("Bowler1","Bowler3","Bowler2")
#relativeBowlingPerf(frames,names)

32 Relative Economy Rate against wickets taken

frames <- list("./bowler1.csv","./bowler3.csv","bowler2.csv")
names <- list("Bowler1","Bowler3","Bowler2")
#relativeBowlingER(frames,names)

33 Relative cumulative average wickets of bowlers in career

frames <- list("./bowler1.csv","./bowler3.csv","bowler2.csv")
names <- list("Bowler1","Bowler3","Bowler2")
#relativeBowlerCumulativeAvgWickets(frames,names)

34 Relative cumulative average economy rate of bowlers

frames <- list("./bowler1.csv","./bowler3.csv","bowler2.csv")
names <- list("Bowler1","Bowler3","Bowler2")
#relativeBowlerCumulativeAvgEconRate(frames,names)

35 Check for bowler in-form/out-of-form

The below computation uses Null Hypothesis testing and p-value to determine if the bowler is in-form or out-of-form. For this 90% of the career wickets is chosen as the population and the mean computed. The last 10% is chosen to be the sample set and the sample Mean and the sample Standard Deviation are caculated.

The Null Hypothesis (H0) assumes that the bowler continues to stay in-form where the sample mean is within 95% confidence interval of population mean The Alternative (Ha) assumes that the bowler is out of form the sample mean is beyond the 95% confidence interval of the population mean.

A significance value of 0.05 is chosen and p-value us computed If p-value >= .05 – Batsman In-Form If p-value < 0.05 – Batsman Out-of-Form

Note Ideally the p-value should be done for a population that follows the Normal Distribution. But the runs population is usually left skewed. So some correction may be needed. I will revisit this later

Note: The check for the form status of the bowlers indicate

#checkBowlerInForm("./bowler1.csv","Bowler1")
#checkBowlerInForm("./bowler2.csv","Bowler2")
#checkBowlerInForm("./bowler3.csv","Bowler3")
dev.off()
## null device 
##           1

36. Performing granular analysis of batsmen and bowlers

To perform granular analysis of batsmen and bowlers do the following 2 steps

  1. Step 1: getPlayerDataHA – This function is a wrapper around getPlayerData(), getPlayerDataOD() and getPlayerDataTT(), and adds an extra column ‘homeOrAway’ which says whether the match was played at home/away/neutral venues. A CSV file is created with this new column.
  2. Step2:getPlayerDataOppnHA – This function allows you to slice & dice the data for batsmen and bowlers against specific oppositions, at home/away/neutral venues and between certain periods. This reduced subset of data can be used to perform analyses. A CSV file is created as an output based on the parameters of opposition, home or away and the interval of time

37. GetPlayerDataHA (Batsmen, Tests)

#This saves a file playerTestHA.csv
#df=getPlayerDataHA(<profileNo>,tfile="playerTestHA.csv",type="batting", matchType="Test")

#Use the generate file to create a subset of data
#df1=getPlayerDataOppnHA(infile="playerTestHA.csv",outfile="playerTestFile1.csv",
#                         startDate=<start Date>,endDate=<end Date>)

38. GetPlayerDataHA (Bowlers, Tests)

#This saves a file playerTestHA.csv
#df=getPlayerDataHA(<profileNo>,tfile="playerTestHA.csv",type="bowling", matchType="Test")

#Use the generate file to create a subset of data
#df1=getPlayerDataOppnHA(infile="playerTestHA.csv",outfile="playerTestFile1.csv",
#                         startDate=<start Date>,endDate=<end Date>)

39. GetPlayerDataHA (Batsmen, ODI)

#This saves a file playerTestHA.csv
#df=getPlayerDataHA(<profileNo>,tfile="playerODIHA.csv",type="batting", matchType="ODI")

#Use the generate file to create a subset of data
#df1=getPlayerDataOppnHA(infile="playerODIHA.csv",outfile="playerODIFile1.csv",
#                         startDate=<start Date>,endDate=<end Date>)

40. GetPlayerDataHA (Bowlers, ODI)

#This saves a file playerTestHA.csv
#df=getPlayerDataHA(<profileNo>,tfile="playerODIHA.csv",type="bowling", matchType="ODI")

#Use the generate file to create a subset of data
#df1=getPlayerDataOppnHA(infile="playerODIHA.csv",outfile="playerODIFile1.csv",
#                         startDate=<start Date>,endDate=<end Date>)

41. GetPlayerDataHA (Batsmen, T20)

#This saves a file playerTestHA.csv
#df=getPlayerDataHA(<profileNo>,tfile="playerT20HA.csv",type="batting", matchType="T20")

#Use the generate file to create a subset of data
#df1=getPlayerDataOppnHA(infile="playerT20HA.csv",outfile="playerT20File1.csv",
#                         startDate=<start Date>,endDate=<end Date>)

42. GetPlayerDataHA (Bowlers, T20)

#This saves a file playerTestHA.csv
#df=getPlayerDataHA(<profileNo>,tfile="playerT20HA.csv",type="bowling", matchType="T20")

#Use the generate file to create a subset of data
#df1=getPlayerDataOppnHA(infile="playerT20HA.csv",outfile="playerT20File1.csv",
#                         startDate=<start Date>,endDate=<end Date>)

Important Note Once you get the subset of data for batsmen and bowlers playerTestFile1.csv, playerODIFile1.csv or playerT20File1.csv , you can use any of the cricketr functions on the subset of data for a fine-grained analysis

B. Performances of teams

The following functions will get the team data for Tests, ODI and T20s

1a. Get Test team data

#country1Test= getTeamDataHomeAway(dir=".",teamView="bat",matchType="Test",file="country1Test.csv",save=True,teamName="Country1")
#country2Test= getTeamDataHomeAway(dir=".",teamView="bat",matchType="Test",file="country2Test.csv",save=True,teamName="Country2")
#country3Test= getTeamDataHomeAway(dir=".",teamView="bat",matchType="Test",file="country3Test.csv",save=True,teamName="Country3")

1b. Get ODI team data

#team1ODI=  getTeamDataHomeAway(dir=".",matchType="ODI",file="team1ODI.csv",save=True,teamName="team1")
#team2ODI=  getTeamDataHomeAway(dir=".",matchType="ODI",file="team2ODI.csv",save=True,teamName="team2")
#team3ODI=  getTeamDataHomeAway(dir=".",matchType="ODI",file="team3ODI.csv",save=True,teamName="team3")

1c. Get T20 team data

#team1T20 = getTeamDataHomeAway(matchType="T20",file="team1T20.csv",save=True,teamName="team1")
#team2T20 = getTeamDataHomeAway(matchType="T20",file="team2T20.csv",save=True,teamName="team2")
#team3T20 = getTeamDataHomeAway(matchType="T20",file="team3T20.csv",save=True,teamName="team3")

2a. Test – Analyzing test performances against opposition

# Get the performance of Indian test team against all teams at all venues as a dataframe
#df <- teamWinLossStatusVsOpposition("country1Test.csv",teamName="Country1",opposition=c("all"),homeOrAway=c("all"),matchType="Test",plot=FALSE)
#head(df)

# Plot the performance of Country1 Test team  against all teams at all venues
#teamWinLossStatusVsOpposition("country1Test.csv",teamName="Country1",opposition=c("all"),homeOrAway=c("all"),matchType="Test",plot=TRUE)

# Plot the performance of Country1 Test team  against specific teams at home/away venues
#teamWinLossStatusVsOpposition("country1Test.csv",teamName="Country1",opposition=c("Country2","Country3","Country4"),homeOrAway=c("home","away","neutral"),matchType="Test",plot=TRUE)

2b. Test – Analyzing test performances against opposition at different grounds

# Get the performance of Indian test team against all teams at all venues as a dataframe
#df <- teamWinLossStatusAtGrounds("country1Test.csv",teamName="Country1",opposition=c("all"),homeOrAway=c("all"),matchType="Test",plot=FALSE)
#head(df)

# Plot the performance of Country1 Test team  against all teams at all venues
#teamWinLossStatusAtGrounds("country1Test.csv",teamName="Country1",opposition=c("all"),homeOrAway=c("all"),matchType="Test",plot=TRUE)

# Plot the performance of Country1 Test team  against specific teams at home/away venues
#teamWinLossStatusAtGrounds("country1Test.csv",teamName="Country1",opposition=c("Country2","Country3","Country4"),homeOrAway=c("home","away","neutral"),matchType="Test",plot=TRUE)

2c. Test – Plot time lines of wins and losses

#plotTimelineofWinsLosses("country1Test.csv",team="Country1",opposition=c("all"), #startDate="1970-01-01",endDate="2017-01-01")
#plotTimelineofWinsLosses("country1Test.csv",team="Country1",opposition=c("Country2","Count#ry3","Country4"), homeOrAway=c("home",away","neutral"), startDate=<start Date> #,endDate=<endDate>)

3a. ODI – Analyzing test performances against opposition

#df <- teamWinLossStatusVsOpposition("team1ODI.csv",teamName="Team1",opposition=c("all"),homeOrAway=c("all"),matchType="ODI",plot=FALSE)
#head(df)

# Plot the performance of team1  in ODIs against Sri Lanka, India at all venues
#teamWinLossStatusVsOpposition("team1ODI.csv",teamName="Team1",opposition=c("all"),homeOrAway=c(all"),matchType="ODI",plot=TRUE)

# Plot the performance of Team1 ODI team  against specific teams at home/away venues
#teamWinLossStatusVsOpposition("team1ODI.csv",teamName="Team1",opposition=c("Team2","Team3","Team4"),homeOrAway=c("home","away","neutral"),matchType="ODI",plot=TRUE)

3b. ODI – Analyzing test performances against opposition at different venues

#df <- teamWinLossStatusAtGrounds("team1ODI.csv",teamName="Team1",opposition=c("all"),homeOrAway=c("all"),matchType="ODI",plot=FALSE)
#head(df)

# Plot the performance of Team1s in ODIs specific ODI teams at all venues
#teamWinLossStatusAtGrounds("team1ODI.csv",teamName="Team1",opposition=c("all"),homeOrAway=c(all"),matchType="ODI",plot=TRUE)

# Plot the performance of Team1 against specific ODI teams at home/away venues
#teamWinLossStatusAtGrounds("team1ODI.csv",teamName="Team1",opposition=c("Team2","Team3","Team4"),homeOrAway=c("home","away","neutral"),matchType="ODI",plot=TRUE)

3c. ODI – Plot time lines of wins and losses

#Plot the time line of wins/losses of Bangladesh ODI team between 2 dates all venues
#plotTimelineofWinsLosses("team1ODI.csv",team="Team1",startDate=<start date> ,endDa#te=<end date>,matchType="ODI")

#Plot the time line of wins/losses against specific opposition between 2 dates
#plotTimelineofWinsLosses("team1ODI.csv",team="Team1",opposition=c("Team2","Team2"), homeOrAway=c("home",away","neutral"), startDate=<start date>,endDate=<end date> ,matchType="ODI")

4a. T20 – Analyzing test performances against opposition

#df <- teamWinLossStatusVsOpposition("teamT20.csv",teamName="Team1",opposition=c("all"),homeOrAway=c("all"),matchType="T20",plot=FALSE)
#head(df)

# Plot the performance of Team1 in T20s  against  all opposition at all venues
#teamWinLossStatusVsOpposition("teamT20.csv",teamName="Team1",opposition=c("all"),homeOrAway=c(all"),matchType="T20",plot=TRUE)

# Plot the performance of T20 Test team  against specific teams at home/away venues
#teamWinLossStatusVsOpposition("teamT20.csv",teamName="Team1",opposition=c("Team2","Team3","Team4"),homeOrAway=c("home","away","neutral"),matchType="T20",plot=TRUE)

4b. T20 – Analyzing test performances against opposition at different venues

#df <- teamWinLossStatusAtGrounds("teamT20.csv",teamName="Team1",opposition=c("all"),homeOrAway=c("all"),matchType="T20",plot=FALSE)
#head(df)

# Plot the performance of Team1s in ODIs specific ODI teams at all venues
#teamWinLossStatusAtGrounds("teamT20.csv",teamName="Team1",opposition=c("all"),homeOrAway=c(all"),matchType="T20",plot=TRUE)

# Plot the performance of Team1 against specific ODI teams at home/away venues
#teamWinLossStatusAtGrounds("teamT20.csv",teamName="Team1",opposition=c("Team2","Team3","Team4"),homeOrAway=c("home","away","neutral"),matchType="T20",plot=TRUE)

4c. T20 – Plot time lines of wins and losses

#Plot the time line of wins/losses of Bangladesh ODI team between 2 dates all venues
#plotTimelineofWinsLosses("teamT20.csv",team="Team1",startDate=<start date> ,endDa#te=<end date>,matchType="T20")

#Plot the time line of wins/losses against specific opposition between 2 dates
#plotTimelineofWinsLosses("teamT20.csv",team="Team1",opposition=c("Team2","Team2"), homeOrAway=c("home",away","neutral"), startDate=<start date>,endDate=<end date> ,matchType="T20")

Key Findings

Analysis of batsman

Analysis of bowlers

Analysis of teams

Conclusion

Using the above template, analysis can be done for both batsmen and bowlers in Test, ODI and T20. Also analysis of any any team in Test, ODI and T20 against other specific opposition, at home/away and neutral venues can be performed.

Have fun with cricketr!!

Also see
1. Practical Machine Learning with R and Python – Part 5
2. Using Linear Programming (LP) for optimizing bowling change or batting lineup in T20 cricket
3. yorkr crashes the IPL party ! – Part 1
4. Deep Learning from first principles in Python, R and Octave – Part 6
5. Cricpy takes a swing at the ODIs
6. Bull in a china shop – Behind the scenes in Android
7. Eliminating the Performance Drag
To see all posts click Index of posts

Cricketr adds team analytics to its repertoire!!!

And she’s got brains enough for two, which is the exact quantity the girl who marries you will need.

“I’m not absolutely certain of the facts, but I rather fancy it’s Shakespeare who says that it’s always just when a fellow is feeling particularly braced with things in general that Fate sneaks up behind him with the bit of lead piping.”

“A melancholy-looking man, he had the appearance of one who has searched for the leak in life’s gas-pipe with a lighted candle.”

“It isn’t often that Aunt Dahlia lets her angry passions rise, but when she does, strong men climb trees and pull them up after them.”

“Some minds are like soup in a poor restaurant – better left unstirred.”

                                      P.G. Wodehouse

Introduction

My R package cricketr had its genesis about 4 years ago, sometime around June 2015. There were some minor updates afterwards and the package performed analytics on cricketers (Test, ODI and T20) based on data from ESPN Cricinfo see Re-introducing cricketr! : An R package to analyze performances of cricketers. Now, in the latest release of cricketr, I have included 8 functions which can perform Team analytics. Team analysis can be done for Test, ODI and T20 teams.

This package uses the statistics info available in ESPN Cricinfo Statsguru. The current version of this package can handle all formats of the game including Test, ODI and Twenty20 cricket for players (batsmen & bowlers) and also teams (Test, ODI and T20)

You should be able to install the package directly from CRAN. Please be mindful of ESPN Cricinfo Terms of Use

A total of 8 new functions which deal with team analytics has been included in the latest release.

There are 5 functions which are used internally 1) getTeamData b) getTeamNumber c) getMatchType d) getTeamDataHomeAway e) cleanTeamData

and the external functions which are
a) teamWinLossStatusVsOpposition
b) teamWinLossStatusAtGrounds
c) plotTimelineofWinsLosses

All the above functions are common to Test, ODI and T20 teams

The data for a particular Team can be obtained with the getTeamDataHomeAway() function from the package. This will return a dataframe of the team’s win/loss status at home and away venues over a period of time. This can be saved as a CSV file. Once this is done, you can use this CSV file for all subsequent analysis

As before you can get the help for any of the cricketr functions as below

#help(teamWinLossStatusVsOpposition)
Compute the wins/losses/draw/tied etc for a Team in Test, ODI or T20 against opposition
Description
This function computes the won,lost,draw,tied or no result for a team against other teams in home/away or neutral venues and either returns a dataframe or plots it against opposition
Usage
teamWinLossStatusVsOpposition(file,teamName,opposition=c("all"),homeOrAway=c("all"),
      matchType="Test",plot=FALSE)
Arguments
file	
The CSV file for which the plot is required
teamName	
The name of the team for which plot is required
opposition	
Opposition is a vector namely c("all") or c("Australia", "India", "England")
homeOrAway	
This parameter is a vector which is either c("all") or a vector of venues c("home","away","neutral")
matchType	
Match type - Test, ODI or T20
plot	
If plot=FALSE then a data frame is returned, If plot=TRUE then a plot is generated
Value
None
Note
Maintainer: Tinniam V Ganesh tvganesh.85@gmail.com
Author(s)
Tinniam V Ganesh
References

http://www.espncricinfo.com/ci/content/stats/index.html
https://gigadom.in/
See Also
teamWinLossStatusVsOpposition teamWinLossStatusAtGrounds plotTimelineofWinsLosses
Examples
## Not run: 
#Get the team data for India for Tests
df <- getTeamDataHomeAway(teamName="India",file="indiaOD.csv",matchType="ODI")
teamWinLossStatusAtGrounds("india.csv",teamName="India",opposition=c("Australia","England","India"),
                          homeOrAway=c("home","away"),plot=TRUE)
## End(Not run)

This post has been published at RPubs and is available at TeamAnalyticsWithCricketr

You can download PDF version of this post at TeamAnalyticsWithCricketr

You can download the latest PDF version of the book  at  ‘Cricket analytics with cricketr and cricpy: Analytics harmony with R and Python-6th edition

1. Get team data

1a. Test

The teams in Test cricket are included below

  1. Afghanistan 2.Bangladesh 3. England 4. World 5. India 6. Ireland 7. New Zealand 8. Pakistan 9. South Africa 10.Sri Lanka 11. West Indies 12.Zimbabwe

You can use this for the teamName paramater. This will return a dataframe and also save the file as a CSV , if save=TRUE

Note: – Since I have already got the data as CSV files I am not executing the lines below

# Get the data for the teams. Save as CSV
#indiaTest <-getTeamDataHomeAway(dir=".",teamView="bat",matchType="Test",file="indiaTest.csv",save=TRUE,teamName="India")
#australiaTest <- getTeamDataHomeAway(matchType="Test",file="australiaTest.csv",save=TRUE,teamName="Australia")
#pakistanTest <- getTeamDataHomeAway(matchType="Test",file="pakistanTest.csv",save=TRUE,teamName="Pakistan")
#newzealandTest <- getTeamDataHomeAway(matchType="Test",file="newzealandTest.csv",save=TRUE,teamName="New Zealand")

1b. ODI

The ODI teams in the world are below. The data for these teams can be got by names as shown below

  1. Afghanistan 2. Africa XI 3. Asia XI 4.Australia 5.Bangladesh
  2. Bermuda 7. England 8. ICC World X1 9. India 11.Ireland 12. New Zealand
  3. Pakistan 14. South Africa 15. Sri Lanka 17. West Indies 18. Zimbabwe
  4. Canada 21. East Africa 22. Hong Kong 23.Ireland 24. Kenya 25. Namibia
  5. Nepal 27.Netherlands 28. Oman 29.Papua New Guinea 30. Scotland
  6. United Arab Emirates 32. United States of America
#indiaODI <- getTeamDataHomeAway(matchType="ODI",file="indiaODI.csv",save=TRUE,teamName="India")
#englandODI <- getTeamDataHomeAway(matchType="ODI",file="englandODI.csv",save=TRUE,teamName="England")
#westindiesODI <- getTeamDataHomeAway(matchType="ODI",file="westindiesODI.csv",save=TRUE,teamName="West Indies")
#irelandODI <- getTeamDataHomeAway(matchType="ODI",file="irelandODI.csv",save=TRUE,teamName="Ireland")

1c T20

The T20 teams in the world are
1.Afghanistan 2. Australia 3. Bahrain 4. Bangladesh 5. Belgium 6. Belize
2.Bermuda 8.Botswana 9. Canada 11. Costa Rica 12. Germany 13. Ghana
14.Guernsey 15. Hong Kong 16. ICC World X1 17.India 18. Ireland 19.Italy
20.Jersey 21. Kenya 22.Kuwait 23.Maldives 24.Malta 25.Mexico 26.Namibia
27.Nepal 28.Netherlands 29. New Zealand 30.Nigeria 31.Oman 32. Pakistan
33.Panama 34.Papua New Guinea 35. Philippines 36.Qatar 37.Saudi Arabia
38.Scotland 39.South Africa 40.Spain 41.Sri Lanka 42.Uganda
43.United Arab Emirates United States of America 44.Vanuatu 45.West Indies

#southafricaT20 <- getTeamDataHomeAway(matchType="T20",file="southafricaT20.csv",save=TRUE,teamName="South Africa")
#srilankaT20 <- getTeamDataHomeAway(matchType="T20",file="srilankaT20.csv",save=TRUE,teamName="Sri Lanka")
#canadaT20 <- getTeamDataHomeAway(matchType="T20",file="canadaT20.csv",save=TRUE,teamName="Canada")
#afghanistanT20 <- getTeamDataHomeAway(matchType="T20",file="afghanistanT20.csv",save=TRUE,teamName="Afghanistan")

2 Analysis of Test matches

The functions below perform analysis of Test teams

2a. Wins vs Loss against opposition

This function performs analysis of Test teams against other teams at home/away or neutral venue. Note:- The opposition can be a vector of opposition teams. Similarly homeOrAway can also be a vector of home/away/neutral venues.

# Get the performance of Indian test team against all teams at all venues as a dataframe
df <- teamWinLossStatusVsOpposition("india.csv",teamName="India",opposition=c("all"),homeOrAway=c("all"),matchType="Test",plot=FALSE)
head(df)
## # A tibble: 6 x 4
## # Groups:   Opposition, Result [4]
##   Opposition  Result ha    count
##   <chr>       <chr>  <chr> <int>
## 1 Afghanistan won    home      1
## 2 Australia   draw   away     20
## 3 Australia   draw   home     23
## 4 Australia   lost   away     58
## 5 Australia   lost   home     26
## 6 Australia   tied   home      2
# Plot the performance of Indian Test team  against all teams at all venues
teamWinLossStatusVsOpposition("indiaTest.csv",teamName="India",opposition=c("all"),homeOrAway=c("all"),matchType="Test",plot=TRUE)

# Get the performance of Australia against India, England and New Zealand at all venues in Tests
df <-teamWinLossStatusVsOpposition("australiaTest.csv",teamName="Australia",opposition=c("India","England","New Zealand"),homeOrAway=c("all"),matchType="Test",plot=FALSE)

#Plot the performance of Australia against England, India and New Zealand only at home (Australia) 
teamWinLossStatusVsOpposition("australiaTest.csv",teamName="Australia",opposition=c("India","England","New Zealand"),homeOrAway=c("home"),matchType="Test",plot=TRUE)

If you are passionate about cricket, and love analyzing cricket performances, then check out my racy book on cricket ‘Cricket analytics with cricketr and cricpy – Analytics harmony with R & Python’! This book discusses and shows how to use my R package ‘cricketr’ and my Python package ‘cricpy’ to analyze batsmen and bowlers in all formats of the game (Test, ODI and T20). The paperback is available on Amazon at $21.99 and  the kindle version at $9.99/Rs 449/-. A must read for any cricket lover! Check it out!!

Untitled

2b Wins vs losses of Test teams against opposition at different venues

# Get the  performance of Pakistan against India, West Indies, South Africa at all venues in Tests and show performances at the venues
df <- teamWinLossStatusAtGrounds("pakistanTest.csv",teamName="Pakistan",opposition=c("India","West Indies","South Africa"),homeOrAway=c("all"),matchType="Test",plot=FALSE)
head(df)
## # A tibble: 6 x 4
## # Groups:   Ground, Result [6]
##   Ground     Result ha      count
##   <chr>      <chr>  <chr>   <int>
## 1 Abu Dhabi  draw   neutral     2
## 2 Abu Dhabi  won    neutral     4
## 3 Ahmedabad  draw   away        2
## 4 Bahawalpur draw   home        1
## 5 Basseterre won    away        2
## 6 Bengaluru  draw   away        5
# Plot the performance of New Zealand Test team against England, Sri Lanka and Bangladesh at all grounds playes 
teamWinLossStatusAtGrounds("newzealandTest.csv",teamName="New Zealand",opposition=c("England","Sri Lanka","Bangladesh"),homeOrAway=c("all"),matchType="Test",plot=TRUE)

2c. Plot the time line of wins vs losses of Test teams against opposition at different venues during an interval

# Plot the time line of wins/losses of India against Australia, West Indies, South Africa in away/neutral venues
#from 2000-01-01 to 2017-01-01
plotTimelineofWinsLosses("indiaTest.csv",team="India",opposition=c("Australia","West Indies","South Africa"),
                         homeOrAway=c("away","neutral"), startDate="2000-01-01",endDate="2017-01-01")

#Plot the time line of wins/losses of Indian Test team from 1970 onwards
plotTimelineofWinsLosses("indiaTest.csv",team="India",startDate="1970-01-01",endDate="2017-01-01")

3 ODI

The functions below perform analysis of ODI teams listed above

3a. Wins vs Loss against opposition ODI teams

This function performs analysis of ODI teams against other teams at home/away or neutral venue. Note:- The opposition can be a vector of opposition teams. Similarly homeOrAway can also be a vector of home/away/neutral venues.

# Get the performance of West Indies in ODIs against all other ODI teams at all venues and retirn as a dataframe
df <- teamWinLossStatusVsOpposition("westindiesODI.csv",teamName="West Indies",opposition=c("all"),homeOrAway=c("all"),matchType="ODI",plot=FALSE)
head(df)
## # A tibble: 6 x 4
## # Groups:   Opposition, Result [3]
##   Opposition  Result ha      count
##   <chr>       <chr>  <chr>   <int>
## 1 Afghanistan lost   home        1
## 2 Afghanistan lost   neutral     2
## 3 Afghanistan won    home        1
## 4 Australia   lost   away       41
## 5 Australia   lost   home       25
## 6 Australia   lost   neutral     8
# Plot the performance of West Indies in ODIs against Sri Lanka, India at all venues
teamWinLossStatusVsOpposition("westindiesODI.csv",teamName="West Indies",opposition=c("Sri Lanka", "India"),homeOrAway=c("all"),matchType="ODI",plot=TRUE)

#Plot the performance of Ireland in ODIs against Zimbabwe, Kenya, bermuda, UAE, Oman and Scotland at all venues
teamWinLossStatusVsOpposition("irelandODI.csv",teamName="Ireland",opposition=c("Zimbabwe","Kenya","Bermuda","U.A.E.","Oman","Scotland"),homeOrAway=c("all"),matchType="ODI",plot=TRUE)

3b Wins vs losses of ODI teams against opposition at different venues

# Plot the performance of England ODI team against Bangladesh, West Indies and Australia at all venues
teamWinLossStatusAtGrounds("englandODI.csv",teamName="England",opposition=c("Bangladesh","West Indies","Australia"),homeOrAway=c("all"),matchType="ODI",plot=TRUE)

#Plot the performance of India against South Africa, West Indies and Australia at 'home' venues
teamWinLossStatusAtGrounds("indiaODI.csv",teamName="India",opposition=c("South Africa","West Indies","Australia"),homeOrAway=c("home"),matchType="ODI",plot=TRUE)

3c. Plot the time line of wins vs losses of ODI teams against opposition at different venues during an interval

#Plot the time line of wins/losses of Bangladesh ODI team between 2015 and 2019 against all other teams and at
# all venues
plotTimelineofWinsLosses("bangladeshOD.csv",team="Bangladesh",startDate="2015-01-01",endDate="2019-01-01",matchType="ODI")

#Plot the time line of wins/losses of India ODI against Sri Lanka, Bangladesh from 2016 to 2019
plotTimelineofWinsLosses("indiaODI.csv",team="India",opposition=c("Sri Lanka","Bangladesh"),startDate="2016-01-01",endDate="2019-01-01",matchType="ODI")

4 Twenty 20

The functions below perform analysis of Twenty 20 teams listed above

4a. Wins vs Loss against opposition ODI teams

This function performs analysis of T20 teams against other T20 teams at home/away or neutral venue. Note:- The opposition can be a vector of opposition teams. Similarly homeOrAway can also be a vector of home/away/neutral venues.

# Get the performance of South Africa T20 team against England, India and Sri Lanka at home grounds at England
df <- teamWinLossStatusVsOpposition("southafricaT20.csv",teamName="South Africa",opposition=c("England","India","Sri Lanka"),homeOrAway=c("home"),matchType="T20",plot=FALSE)

#Plot the performance of South Africa T20 against England, India and Sri Lanka at all venues
teamWinLossStatusVsOpposition("southafricaT20.csv",teamName="South Africa",opposition=c("England","India","Sri Lanka"),homeOrAway=c("all"),matchType="T20",plot=TRUE)

#Plot the performance of Afghanistan T20 teams against all oppositions
teamWinLossStatusVsOpposition("afghanistanT20.csv",teamName="Afghanistan",opposition=c("all"),homeOrAway=c("all"),matchType="T20",plot=TRUE)

4b Wins vs losses of T20 teams against opposition at different venues

# Compute the performance of Canada against all opposition at all venues and show by grounds. Return as dataframe
df <-teamWinLossStatusAtGrounds("canadaT20.csv",teamName="Canada",opposition=c("all"),homeOrAway=c("all"),matchType="T20",plot=FALSE)
head(df)
## # A tibble: 6 x 4
## # Groups:   Ground, Result [6]
##   Ground        Result ha      count
##   <chr>         <chr>  <chr>   <int>
## 1 Abu Dhabi     lost   neutral     1
## 2 Belfast       lost   neutral     1
## 3 Belfast       won    neutral     2
## 4 Colombo (SSC) lost   neutral     1
## 5 Colombo (SSC) won    neutral     1
## 6 Dubai (DSC)   lost   neutral     5
# Plot the performance of Sri Lanka T20 team against India and Bangladesh in different venues at home/away and neutral
teamWinLossStatusAtGrounds("srilankaT20.csv",teamName="Sri Lanka",opposition=c("India", "Bangladesh"), homeOrAway=c("all"), matchType="T20", plot=TRUE)

4c. Plot the time line of wins vs losses of T20 teams against opposition at different venues during an interval

#Plot the time line of Sri Lanka T20 team agaibst all opposition
plotTimelineofWinsLosses("srilankaT20.csv",team="Sri Lanka",opposition=c("Australia", "Pakistan"), startDate="2013-01-01", endDate="2019-01-01",  matchType="T20")

# Plot the time line of South Africa T20 between 2010 and 2015 against West Indies and Pakistan
plotTimelineofWinsLosses("southafricaT20.csv",team="South Africa",opposition=c("West Indies", "Pakistan"), startDate="2010-01-01", endDate="2015-01-01",  matchType="T20")

My book ‘Cricket analytics with cricketr and cricpy’ is now on Amazon

‘Cricket analytics with cricketr and cricpy – Analytics harmony with R and Python’ is now available on Amazon in both paperback ($21.99) and kindle ($9.99/Rs 449) versions. The book includes analysis of cricketers using both my R package ‘cricketr’ and my python package ‘cricpy’ for all formats of the game namely Test, ODI and T20. Both packages use data from ESPN Cricinfo Statsguru. The paperback is available on Amazon for $21.99 and the kindle version is available for $9.99/Rs 449

Pick up your copy today!

The book includes the following chapters

CONTENTS

Introduction 7
1. Cricket analytics with cricketr 9
1.1. Introducing cricketr! : An R package to analyze performances of cricketers 10
1.2. Taking cricketr for a spin – Part 1 48
1.2. cricketr digs the Ashes! 69
1.3. cricketr plays the ODIs! 97
1.4. cricketr adapts to the Twenty20 International! 139
1.5. Sixer – R package cricketr’s new Shiny avatar 168
1.6. Re-introducing cricketr! : An R package to analyze performances of cricketers 178
1.7. cricketr sizes up legendary All-rounders of yesteryear 233
1.8. cricketr flexes new muscles: The final analysis 277
1.9. The Clash of the Titans in Test and ODI cricket 300
1.10. Analyzing performances of cricketers using cricketr template 338
2. Cricket analytics with cricpy 352
2.1 Introducing cricpy:A python package to analyze performances of cricketers 353
2.2 Cricpy takes a swing at the ODIs 405
Analysis of Top 4 batsman 448
2.3 Cricpy takes guard for the Twenty20s 449
2.4 Analyzing batsmen and bowlers with cricpy template 490
9. Average runs against different opposing teams 493
3. Other cricket posts in R 500
3.1 Analyzing cricket’s batting legends – Through the mirage with R 500
3.2 Mirror, mirror … the best batsman of them all? 527
4. Appendix 541
Cricket analysis with Machine Learning using Octave 541
4.1 Informed choices through Machine Learning – Analyzing Kohli, Tendulkar and Dravid 542
4.2 Informed choices through Machine Learning-2 Pitting together Kumble, Kapil, Chandra 555
Further reading 569
Important Links 570

You can download the latest PDF version of the book  at  ‘Cricket analytics with cricketr and cricpy: Analytics harmony with R and Python-6th edition

Also see
1. My book “Deep Learning from first principles” now on Amazon
2. Practical Machine Learning with R and Python – Part 1
3. Revisiting World Bank data analysis with WDI and gVisMotionChart
4. Natural language processing: What would Shakespeare say?
5. Optimal Cloud Computing
6. Pitching yorkpy … short of good length to IPL – Part 1
7. Computer Vision: Ramblings on derivatives, histograms and contours

To see all posts click Index of posts
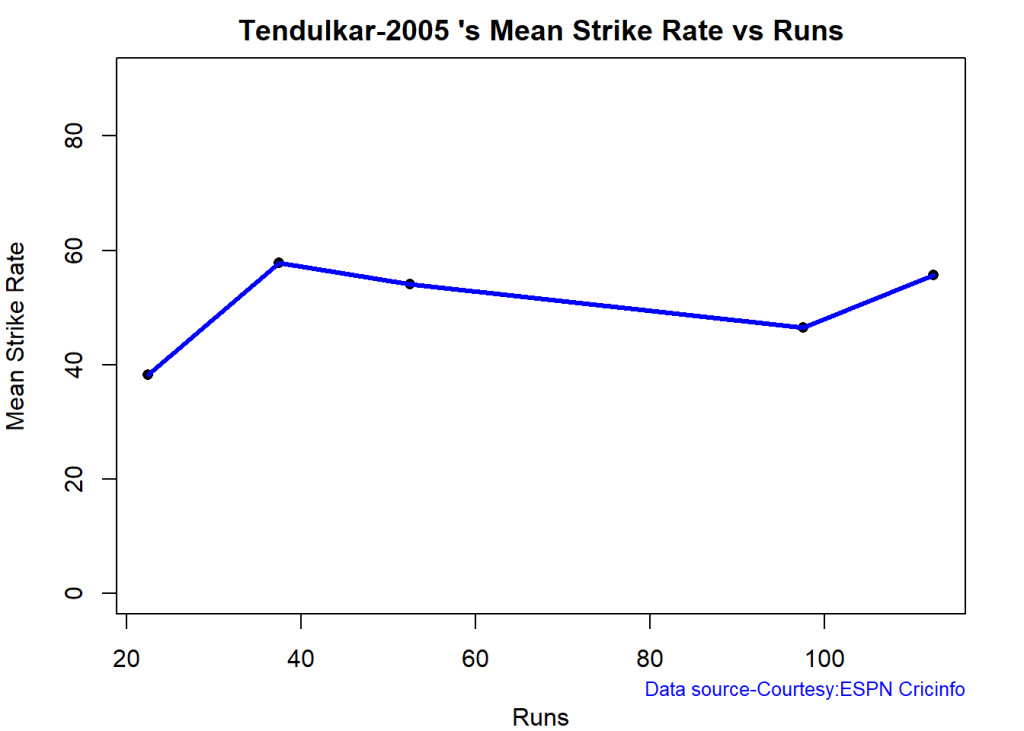
Analyzing performances of cricketers using cricketr template

This post includes a template which you can use for analyzing the performances of cricketers, both batsmen and bowlers in Test, ODI and Twenty 20 cricket using my R package cricketr. To see actual usage of functions in the R package cricketr see Introducing cricketr! : An R package to analyze performances of cricketers.

This template can be downloaded from Github at cricketer-template

The ‘cricketr’ package uses the statistics info available in ESPN Cricinfo Statsguru. The current version of this package supports all formats of the game including Test, ODI and Twenty20 versions.

You should be able to install the package from GitHub and use the many functions available in the package. Please mindful of the ESPN Cricinfo Terms of Use

Take a look at my short video tutorial on my R package cricketr on Youtube – R package cricketr – A short tutorial

Do check out my interactive Shiny app implementation using the cricketr package – Sixer – R package cricketr’s new Shiny avatar

Important note 1: The latest release of ‘cricketr’ now includes the ability to analyze performances of teams now!!  See Cricketr adds team analytics to its repertoire!!!

Important note 2 : Cricketr can now do a more fine-grained analysis of players, see Cricketr learns new tricks : Performs fine-grained analysis of players

Important note 3: Do check out the python avatar of cricketr, ‘cricpy’ in my post ‘Introducing cricpy:A python package to analyze performances of cricketers

You can download the latest PDF version of the book  at  ‘Cricket analytics with cricketr and cricpy: Analytics harmony with R and Python-6th edition

The cricketr package

The cricketr package has several functions that perform several different analyses on both batsman and bowlers. The package has function that plot percentage frequency runs or wickets, runs likelihood for a batsman, relative run/strike rates of batsman and relative performance/economy rate for bowlers are available.

Other interesting functions include batting performance moving average, forecast and a function to check whether the batsmans in in-form or out-of-form.

The data for a particular player can be obtained with the getPlayerData() function. To do you will need to go to ESPN CricInfo Player and type in the name of the player for e.g Ricky Ponting, Sachin Tendulkar etc. This will bring up a page which have the profile number for the player e.g. for Sachin Tendulkar this would be http://www.espncricinfo.com/india/content/player/35320.html. Hence, Sachin’s profile is 35320. This can be used to get the data for Tendulkar as shown below

The cricketr package is now available from CRAN!!! You should be able to install directly with

1. Install the cricketr package

if (!require("cricketr")){
    install.packages("cricketr",lib = "c:/test")
}
library(cricketr)

The cricketr package includes some pre-packaged sample (.csv) files. You can use these sample to test functions as shown below

# Retrieve the file path of a data file installed with cricketr
#pathToFile <- system.file("data", "tendulkar.csv", package = "cricketr")
#batsman4s(pathToFile, "Sachin Tendulkar")

# The general format is pkg-function(pathToFile,par1,...)
#batsman4s(<path-To-File>,"Sachin Tendulkar")

“` The pre-packaged files can be accessed as shown above. To get the data of any player use the function in Test, ODI and Twenty20 use the following

2. For Test cricket

#tendulkar <- getPlayerData(35320,dir="..",file="tendulkar.csv",type="batting",homeOrAway=c(1,2), result=c(1,2,4))

2a. For ODI cricket

#tendulkarOD <- getPlayerDataOD(35320,dir="..",file="tendulkarOD.csv",type="batting")

2b For Twenty 20 cricket

#tendulkarT20 <- getPlayerDataTT(35320,dir="..",file="tendulkarT20.csv",type="batting")

Analysis of batsmen

Important Note This needs to be done only once for a player. This function stores the player’s data in a CSV file (for e.g. tendulkar.csv as above) which can then be reused for all other functions. Once we have the data for the players many analyses can be done. This post will use the stored CSV file obtained with a prior getPlayerData for all subsequent analyses

Sachin Tendulkar’s performance – Basic Analyses

The 3 plots below provide the following for Tendulkar

  1. Frequency percentage of runs in each run range over the whole career
  2. Mean Strike Rate for runs scored in the given range
  3. A histogram of runs frequency percentages in runs ranges For example

3. Basic analyses

par(mfrow=c(1,3))
par(mar=c(4,4,2,2))
#batsmanRunsFreqPerf("./tendulkar.csv","Tendulkar")
#batsmanMeanStrikeRate("./tendulkar.csv","Tendulkar")
#batsmanRunsRanges("./tendulkar.csv","Tendulkar")
dev.off()
## null device 
##           1
  1. Player 1
  2. Player 2
  3. Player 3
  4. Player 4

4. More analyses

par(mfrow=c(1,3))
par(mar=c(4,4,2,2))
#batsman4s("./player1.csv","Player1")
#batsman6s("./player1.csv","Player1")
#batsmanMeanStrikeRate("./player1.csv","Player1")

# For ODI and T20
#batsmanScoringRateODTT("./player1.csv","Player1")
dev.off()
## null device 
##           1
par(mfrow=c(1,3))
par(mar=c(4,4,2,2))
#batsman4s("./player2.csv","Player2")
#batsman6s("./player2.csv","Player2")
#batsmanMeanStrikeRate("./player2.csv","Player2")
# For ODI and T20
#batsmanScoringRateODTT("./player1.csv","Player1")
dev.off()
## null device 
##           1
par(mfrow=c(1,3))
par(mar=c(4,4,2,2))
#batsman4s("./player3.csv","Player3")
#batsman6s("./player3.csv","Player3")
#batsmanMeanStrikeRate("./player3.csv","Player3")
# For ODI and T20
#batsmanScoringRateODTT("./player1.csv","Player1")

dev.off()
## null device 
##           1
par(mfrow=c(1,3))
par(mar=c(4,4,2,2))
#batsman4s("./player4.csv","Player4")
#batsman6s("./player4.csv","Player4")
#batsmanMeanStrikeRate("./player4.csv","Player4")
# For ODI and T20
#batsmanScoringRateODTT("./player1.csv","Player1")
dev.off()
## null device 
##           1

Note: For mean strike rate in ODI and Twenty20 use the function batsmanScoringRateODTT()

5.Boxplot histogram plot

This plot shows a combined boxplot of the Runs ranges and a histogram of the Runs Frequency

#batsmanPerfBoxHist("./player1.csv","Player1")
#batsmanPerfBoxHist("./player2.csv","Player2")
#batsmanPerfBoxHist("./player3.csv","Player3")
#batsmanPerfBoxHist("./player4.csv","Player4")

6. Contribution to won and lost matches

For the 2 functions below you will have to use the getPlayerDataSp() function. I have commented this as I already have these files. This function can only be used for Test matches

#player1sp <- getPlayerDataSp(xxxx,tdir=".",tfile="player1sp.csv",ttype="batting")
#player2sp <- getPlayerDataSp(xxxx,tdir=".",tfile="player2sp.csv",ttype="batting")
#player3sp <- getPlayerDataSp(xxxx,tdir=".",tfile="player3sp.csv",ttype="batting")
#player4sp <- getPlayerDataSp(xxxx,tdir=".",tfile="player4sp.csv",ttype="batting")
par(mfrow=c(2,2))
par(mar=c(4,4,2,2))
#batsmanContributionWonLost("player1sp.csv","Player1")
#batsmanContributionWonLost("player2sp.csv","Player2")
#batsmanContributionWonLost("player3sp.csv","Player3")
#batsmanContributionWonLost("player4sp.csv","Player4")
dev.off()
## null device 
##           1

7, Performance at home and overseas

This function also requires the use of getPlayerDataSp() as shown above. This can only be used for Test matches

par(mfrow=c(2,2))
par(mar=c(4,4,2,2))
#batsmanPerfHomeAway("player1sp.csv","Player1")
#batsmanPerfHomeAway("player2sp.csv","Player2")
#batsmanPerfHomeAway("player3sp.csv","Player3")
#batsmanPerfHomeAway("player4sp.csv","Player4")
dev.off()
## null device 
##           1

8. Batsman average at different venues

par(mfrow=c(2,2))
par(mar=c(4,4,2,2))
#batsmanAvgRunsGround("./player1.csv","Player1")
#batsmanAvgRunsGround("./player2.csv","Player2")
#batsmanAvgRunsGround("./player3.csv","Ponting")
#batsmanAvgRunsGround("./player4.csv","Player4")
dev.off()
## null device 
##           1

9. Batsman average against different opposition

par(mfrow=c(2,2))
par(mar=c(4,4,2,2))
#batsmanAvgRunsOpposition("./player1.csv","Player1")
#batsmanAvgRunsOpposition("./player2.csv","Player2")
#batsmanAvgRunsOpposition("./player3.csv","Ponting")
#batsmanAvgRunsOpposition("./player4.csv","Player4")
dev.off()
## null device 
##           1

10. Runs Likelihood of batsman

par(mfrow=c(2,2))
par(mar=c(4,4,2,2))
#batsmanRunsLikelihood("./player1.csv","Player1")
#batsmanRunsLikelihood("./player2.csv","Player2")
#batsmanRunsLikelihood("./player3.csv","Ponting")
#batsmanRunsLikelihood("./player4.csv","Player4")
dev.off()
## null device 
##           1

11. Moving Average of runs in career

par(mfrow=c(2,2))
par(mar=c(4,4,2,2))
#batsmanMovingAverage("./player1.csv","Player1")
#batsmanMovingAverage("./player2.csv","Player2")
#batsmanMovingAverage("./player3.csv","Ponting")
#batsmanMovingAverage("./player4.csv","Player4")
dev.off()
## null device 
##           1

12. Cumulative Average runs of batsman in career

par(mfrow=c(2,2))
par(mar=c(4,4,2,2))
#batsmanCumulativeAverageRuns("./player1.csv","Player1")
#batsmanCumulativeAverageRuns("./player2.csv","Player2")
#batsmanCumulativeAverageRuns("./player3.csv","Ponting")
#batsmanCumulativeAverageRuns("./player4.csv","Player4")
dev.off()
## null device 
##           1

13. Cumulative Average strike rate of batsman in career

par(mfrow=c(2,2))
par(mar=c(4,4,2,2))
#batsmanCumulativeStrikeRate("./player1.csv","Player1")
#batsmanCumulativeStrikeRate("./player2.csv","Player2")
#batsmanCumulativeStrikeRate("./player3.csv","Ponting")
#batsmanCumulativeStrikeRate("./player4.csv","Player4")
dev.off()
## null device 
##           1

14. Future Runs forecast

Here are plots that forecast how the batsman will perform in future. In this case 90% of the career runs trend is uses as the training set. the remaining 10% is the test set.

A Holt-Winters forecating model is used to forecast future performance based on the 90% training set. The forecated runs trend is plotted. The test set is also plotted to see how close the forecast and the actual matches

Take a look at the runs forecasted for the batsman below.

par(mfrow=c(2,2))
par(mar=c(4,4,2,2))
#batsmanPerfForecast("./player1.csv","Player1")
#batsmanPerfForecast("./player2.csv","Player2")
#batsmanPerfForecast("./player3.csv","Player3")
#batsmanPerfForecast("./player4.csv","Player4")
dev.off()
## null device 
##           1

15. Relative Mean Strike Rate plot

The plot below compares the Mean Strike Rate of the batsman for each of the runs ranges of 10 and plots them. The plot indicate the following

frames <- list("./player1.csv","./player2.csv","player3.csv","player4.csv")
names <- list("Player1","Player2","Player3","Player4")
#relativeBatsmanSR(frames,names)

16. Relative Runs Frequency plot

The plot below gives the relative Runs Frequency Percetages for each 10 run bucket. The plot below show

frames <- list("./player1.csv","./player2.csv","player3.csv","player4.csv")
names <- list("Player1","Player2","Player3","Player4")
#relativeRunsFreqPerf(frames,names)

17. Relative cumulative average runs in career

frames <- list("./player1.csv","./player2.csv","player3.csv","player4.csv")
names <- list("Player1","Player2","Player3","Player4")
#relativeBatsmanCumulativeAvgRuns(frames,names)

18. Relative cumulative average strike rate in career

frames <- list("./player1.csv","./player2.csv","player3.csv","player4.csv")
names <- list("Player1","Player2","Player3","player4")
#relativeBatsmanCumulativeStrikeRate(frames,names)

19. Check Batsman In-Form or Out-of-Form

The below computation uses Null Hypothesis testing and p-value to determine if the batsman is in-form or out-of-form. For this 90% of the career runs is chosen as the population and the mean computed. The last 10% is chosen to be the sample set and the sample Mean and the sample Standard Deviation are caculated.

The Null Hypothesis (H0) assumes that the batsman continues to stay in-form where the sample mean is within 95% confidence interval of population mean The Alternative (Ha) assumes that the batsman is out of form the sample mean is beyond the 95% confidence interval of the population mean.

A significance value of 0.05 is chosen and p-value us computed If p-value >= .05 – Batsman In-Form If p-value < 0.05 – Batsman Out-of-Form

Note Ideally the p-value should be done for a population that follows the Normal Distribution. But the runs population is usually left skewed. So some correction may be needed. I will revisit this later

This is done for the Top 4 batsman

#checkBatsmanInForm("./player1.csv","Player1")
#checkBatsmanInForm("./player2.csv","Player2")
#checkBatsmanInForm("./player3.csv","Player3")
#checkBatsmanInForm("./player4.csv","Player4")

20. 3D plot of Runs vs Balls Faced and Minutes at Crease

The plot is a scatter plot of Runs vs Balls faced and Minutes at Crease. A prediction plane is fitted

par(mfrow=c(1,2))
par(mar=c(4,4,2,2))
#battingPerf3d("./player1.csv","Player1")
#battingPerf3d("./player2.csv","Player2")
par(mfrow=c(1,2))
par(mar=c(4,4,2,2))
#battingPerf3d("./player3.csv","Player3")
#battingPerf3d("./player4.csv","player4")
dev.off()
## null device 
##           1

21. Predicting Runs given Balls Faced and Minutes at Crease

A multi-variate regression plane is fitted between Runs and Balls faced +Minutes at crease.

BF <- seq( 10, 400,length=15)
Mins <- seq(30,600,length=15)
newDF <- data.frame(BF,Mins)
#Player1 <- batsmanRunsPredict("./player1.csv","Player1",newdataframe=newDF)
#Player2 <- batsmanRunsPredict("./player2.csv","Player2",newdataframe=newDF)
#ponting <- batsmanRunsPredict("./player3.csv","Player3",newdataframe=newDF)
#sangakkara <- batsmanRunsPredict("./player4.csv","Player4",newdataframe=newDF)
#batsmen <-cbind(round(Player1$Runs),round(Player2$Runs),round(Player3$Runs),round(Player4$Runs))
#colnames(batsmen) <- c("Player1","Player2","Player3","Player4")
#newDF <- data.frame(round(newDF$BF),round(newDF$Mins))
#colnames(newDF) <- c("BallsFaced","MinsAtCrease")
#predictedRuns <- cbind(newDF,batsmen)
#predictedRuns

Analysis of bowlers

  1. Bowler1
  2. Bowler2
  3. Bowler3
  4. Bowler4

player1 <- getPlayerData(xxxx,dir=“..”,file=“player1.csv”,type=“bowling”) Note For One day you will have to use getPlayerDataOD() and for Twenty20 it is getPlayerDataTT()

21. Wicket Frequency Plot

This plot below computes the percentage frequency of number of wickets taken for e.g 1 wicket x%, 2 wickets y% etc and plots them as a continuous line

par(mfrow=c(1,3))
par(mar=c(4,4,2,2))
#bowlerWktsFreqPercent("./bowler1.csv","Bowler1")
#bowlerWktsFreqPercent("./bowler2.csv","Bowler2")
#bowlerWktsFreqPercent("./bowler3.csv","Bowler3")
dev.off()
## null device 
##           1

22. Wickets Runs plot

par(mfrow=c(1,3))
par(mar=c(4,4,2,2))
#bowlerWktsRunsPlot("./bowler1.csv","Bowler1")
#bowlerWktsRunsPlot("./bowler2.csv","Bowler2")
#bowlerWktsRunsPlot("./bowler3.csv","Bowler3")
dev.off()
## null device 
##           1

23. Average wickets at different venues

#bowlerAvgWktsGround("./bowler3.csv","Bowler3")

24. Average wickets against different opposition

#bowlerAvgWktsOpposition("./bowler3.csv","Bowler3")

25. Wickets taken moving average

par(mfrow=c(1,3))
par(mar=c(4,4,2,2))
#bowlerMovingAverage("./bowler1.csv","Bowler1")
#bowlerMovingAverage("./bowler2.csv","Bowler2")
#bowlerMovingAverage("./bowler3.csv","Bowler3")

dev.off()
## null device 
##           1

26. Cumulative Wickets taken

par(mfrow=c(1,3))
par(mar=c(4,4,2,2))
#bowlerCumulativeAvgWickets("./bowler1.csv","Bowler1")
#bowlerCumulativeAvgWickets("./bowler2.csv","Bowler2")
#bowlerCumulativeAvgWickets("./bowler3.csv","Bowler3")
dev.off()
## null device 
##           1

27. Cumulative Economy rate

par(mfrow=c(1,3))
par(mar=c(4,4,2,2))
#bowlerCumulativeAvgEconRate("./bowler1.csv","Bowler1")
#bowlerCumulativeAvgEconRate("./bowler2.csv","Bowler2")
#bowlerCumulativeAvgEconRate("./bowler3.csv","Bowler3")
dev.off()
## null device 
##           1

28. Future Wickets forecast

Here are plots that forecast how the bowler will perform in future. In this case 90% of the career wickets trend is used as the training set. the remaining 10% is the test set.

A Holt-Winters forecating model is used to forecast future performance based on the 90% training set. The forecated wickets trend is plotted. The test set is also plotted to see how close the forecast and the actual matches

par(mfrow=c(1,3))
par(mar=c(4,4,2,2))
#bowlerPerfForecast("./bowler1.csv","Bowler1")
#bowlerPerfForecast("./bowler2.csv","Bowler2")
#bowlerPerfForecast("./bowler3.csv","Bowler3")
dev.off()
## null device 
##           1

29. Contribution to matches won and lost

As discussed above the next 2 charts require the use of getPlayerDataSp(). This can only be done for Test matches

#bowler1sp <- getPlayerDataSp(xxxx,tdir=".",tfile="bowler1sp.csv",ttype="bowling")
#bowler2sp <- getPlayerDataSp(xxxx,tdir=".",tfile="bowler2sp.csv",ttype="bowling")
#bowler3sp <- getPlayerDataSp(xxxx,tdir=".",tfile="bowler3sp.csv",ttype="bowling")
par(mfrow=c(1,3))
par(mar=c(4,4,2,2))
#bowlerContributionWonLost("bowler1sp","Bowler1")
#bowlerContributionWonLost("bowler2sp","Bowler2")
#bowlerContributionWonLost("bowler3sp","Bowler3")
dev.off()
## null device 
##           1

30. Performance home and overseas.

This can only be done for Test matches

par(mfrow=c(1,3))
par(mar=c(4,4,2,2))
#bowlerPerfHomeAway("bowler1sp","Bowler1")
#bowlerPerfHomeAway("bowler2sp","Bowler2")
#bowlerPerfHomeAway("bowler3sp","Bowler3")
dev.off()
## null device 
##           1

31 Relative Wickets Frequency Percentage

frames <- list("./bowler1.csv","./bowler3.csv","bowler2.csv")
names <- list("Bowler1","Bowler3","Bowler2")
#relativeBowlingPerf(frames,names)

32 Relative Economy Rate against wickets taken

frames <- list("./bowler1.csv","./bowler3.csv","bowler2.csv")
names <- list("Bowler1","Bowler3","Bowler2")
#relativeBowlingER(frames,names)

33 Relative cumulative average wickets of bowlers in career

frames <- list("./bowler1.csv","./bowler3.csv","bowler2.csv")
names <- list("Bowler1","Bowler3","Bowler2")
#relativeBowlerCumulativeAvgWickets(frames,names)

34 Relative cumulative average economy rate of bowlers

frames <- list("./bowler1.csv","./bowler3.csv","bowler2.csv")
names <- list("Bowler1","Bowler3","Bowler2")
#relativeBowlerCumulativeAvgEconRate(frames,names)

35 Check for bowler in-form/out-of-form

The below computation uses Null Hypothesis testing and p-value to determine if the bowler is in-form or out-of-form. For this 90% of the career wickets is chosen as the population and the mean computed. The last 10% is chosen to be the sample set and the sample Mean and the sample Standard Deviation are caculated.

The Null Hypothesis (H0) assumes that the bowler continues to stay in-form where the sample mean is within 95% confidence interval of population mean The Alternative (Ha) assumes that the bowler is out of form the sample mean is beyond the 95% confidence interval of the population mean.

A significance value of 0.05 is chosen and p-value us computed If p-value >= .05 – Batsman In-Form If p-value < 0.05 – Batsman Out-of-Form

Note Ideally the p-value should be done for a population that follows the Normal Distribution. But the runs population is usually left skewed. So some correction may be needed. I will revisit this later

Note: The check for the form status of the bowlers indicate

#checkBowlerInForm("./bowler1.csv","Bowler1")
#checkBowlerInForm("./bowler2.csv","Bowler2")
#checkBowlerInForm("./bowler3.csv","Bowler3")
dev.off()
## null device 
##           1

The Clash of the Titans in Test and ODI cricket

Who looks outside, dreams; who looks inside, awakes.
Show me a sane man and I will cure him for you.

            Carl Jung 


We’re made of star stuff. We are a way for the cosmos to know itself.
If you want to make an apple pie from scratch, you must first create the universe.

            Carl Sagan

Introduction

The biggest nag in the collective psyche of cricketing fraternity these days, is whether Virat Kohli has surpassed Sachin Tendulkar. This question has been troubling cricket lovers the world over and particularly in India, for quite a while. This nagging question has only grown stronger with Kohli’s 41st ODI century and with Michael Vaughan bestowing the GOAT title to Virat Kohli for ODI cricket. Hence, I decided to do my bit in addressing this, by doing analysis of Kohli’s and Tendulkar’s performance in ODI cricket. I also wanted to address the the best among the cricketing idols of India in Test cricket, namely Sunil Gavaskar, Sachin Tendulkar and Virat Kohli. Hence this post has 2 parts

  1. Analysis of Tendulkar, Gavaskar and Kohli in Test cricket
  2. Analysis of Tendulkar and Kohli in ODIs

In this post, I analyze the performances of these titans in Test and ODI cricket using my R package cricketr. While some may feel that comparisons are not possible as these batsmen are from different eras. To some extent this is true. I would give some leeway to Gavaskar as he had to bat in a pre-helmet era. But with Tendulkar and Kohli a fair and objective comparison is possible. There were pre-eminient bowlers in the times of Tendulkar as there are now.

From the analysis below, it can be seen that Tendulkar is ahead  of everybody else in Test cricket. However it must be noted that Tendulkar’s performance deteriorated towards the end of his career. Such was not the case with Gavaskar. Kohli has some catching up to do and he still has a lot of Test cricket in him.

In ODI Kohli can be seen to pulling ahead of Tendulkar in several aspects.

My R package cricketr can be installed directly from CRAN and you can use it analyze cricketers.

This package uses the statistics info available in ESPN Cricinfo Statsguru. The current version of this package supports all formats of the game including Test, ODI and Twenty20 versions.

You should be able to install the package from GitHub and use the many functions available in the package. Please mindful of the ESPN Cricinfo Terms of Use

Important note 1: The latest release of ‘cricketr’ now includes the ability to analyze performances of teams now!!  See Cricketr adds team analytics to its repertoire!!!

Important note 2 : Cricketr can now do a more fine-grained analysis of players, see Cricketr learns new tricks : Performs fine-grained analysis of players

Important note 3: Do check out the python avatar of cricketr, ‘cricpy’ in my post ‘Introducing cricpy:A python package to analyze performances of cricketers

Take a look at my short video tutorial on my R package cricketr on Youtube – R package cricketr – A short tutorial

Do check out my interactive Shiny app implementation using the cricketr package – Sixer – R package cricketr’s new Shiny avatar

Note 1: If you would like to do a similar analysis for a different set of batsman and bowlers, you can clone/download my skeleton cricketr templatefrom Github (which is the R Markdown file I have used for the analysis below).

Note 2: I sprinkle the charts with my observations. Feel free to look at them more closely and come to your conclusions.

If you are passionate about cricket, and love analyzing cricket performances, then check out my racy book on cricket ‘Cricket analytics with cricketr and cricpy – Analytics harmony with R & Python’! This book discusses and shows how to use my R package ‘cricketr’ and my Python package ‘cricpy’ to analyze batsmen and bowlers in all formats of the game (Test, ODI and T20). The paperback is available on Amazon at $21.99 and  the kindle version at $9.99/Rs 449/-. A must read for any cricket lover! Check it out!!

Untitled

Important note: Do check out the python avatar of cricketr, ‘cricpy’ in my post Introducing cricpy:A python package to analyze performances of cricketers

1 Load the cricketr package

if (!require("cricketr")){
    install.packages("cricketr",lib = "c:/test")
}
library(cricketr)

A Test cricket  – Analysis of Gavaskar, Tendulkar and Kohli

2. Get player data

tendulkar <- getPlayerData(35320,dir=".",file="tendulkar.csv",type="batting")
kohli <- getPlayerData(253802,dir=".",file="kohli.csv",type="batting")
gavaskar <- getPlayerData(28794,dir=".",file="gavaskar.csv",type="batting")

3a. Basic analyses for Tendulkar

par(mfrow=c(1,3))
par(mar=c(4,4,2,2))
batsmanRunsFreqPerf("./tendulkar.csv","Tendulkar")
batsmanMeanStrikeRate("./tendulkar.csv","Tendulkar")
batsmanRunsRanges("./tendulkar.csv","Tendulkar")
dev.off()

3b Basic analyses for Kohli

par(mfrow=c(1,3))
par(mar=c(4,4,2,2))
batsmanRunsFreqPerf("./kohli.csv","Kohli")
batsmanMeanStrikeRate("./kohli.csv","Kohli")
batsmanRunsRanges("./kohli.csv","Kohli")
dev.off()

3c Basic analyses for Gavaskar

par(mfrow=c(1,3))
par(mar=c(4,4,2,2))
batsmanRunsFreqPerf("./gavaskar.csv","Gavaskar")
batsmanMeanStrikeRate("./gavaskar.csv","Gavaskar")
batsmanRunsRanges("./gavaskar.csv","Gavaskar")
dev.off()

4a.More analyses for Tendulkar

It can be seen that Tendulkar and Gavaskar has been bowled more often than Kohli. Also Kohli does not have as many sixes in Test cricket as Tendulkar and Gavaskar

par(mfrow=c(1,3))
par(mar=c(4,4,2,2))
batsman4s("./tendulkar.csv","Tendulkar")
batsman6s("./tendulkar.csv","Tendulkar")
batsmanDismissals("./tendulkar.csv","Tendulkar")
dev.off()

4b. More analyses for Kohli

par(mfrow=c(1,3))
par(mar=c(4,4,2,2))
batsman4s("./kohli.csv","Kohli")
batsman6s("./kohli.csv","Kohli")
batsmanDismissals("./kohli.csv","Kohli")
dev.off()

4c More analyses for Gavaskar

par(mfrow=c(1,3))
par(mar=c(4,4,2,2))
batsman4s("./gavaskar.csv","Gavaskar")
batsman6s("./gavaskar.csv","Gavaskar")
batsmanDismissals("./gavaskar.csv","Gavaskar")
dev.off()

5 Performance of batsmen on different grounds

par(mar=c(4,4,2,2))
batsmanAvgRunsGround("./tendulkar.csv","Tendulkar")
batsmanAvgRunsGround("./kohli.csv","Kohli")
batsmanAvgRunsGround("./gavaskar.csv","Gavaskar")

a

#dev.off()

6. Performance if batsmen against different Opposition

  1. Tendulkar averages 50 against the following countries – Australia, Bangladesh, England, Sri Lanka, West Indies and Zimbabwe
  2. Kohli average almost 50 against all the nations he has played – Australia, Bangladesh, England, New Zealand, Sri Lanka and West Indies
  3. Gavaskar averages 50 against Australia, Pakistan, West Indies, Sri Lanka
par(mar=c(4,4,2,2))
batsmanAvgRunsOpposition("./tendulkar.csv","Tendulkar")
batsmanAvgRunsOpposition("./kohli.csv","Kohli")
batsmanAvgRunsOpposition("./gavaskar.csv","Gavaskar")

7. Get player data special

This is required for the next 2 function calls

tendulkarsp <- getPlayerDataSp(35320,tdir=".",tfile="tendulkarsp.csv",ttype="batting")
kohlisp <- getPlayerDataSp(253802,tdir=".",tfile="kohlisp.csv",ttype="batting")
gavaskarsp <- getPlayerDataSp(28794,tdir=".",tfile="gavaskarsp.csv",ttype="batting")

#dev.off()

8 Get contribution of batsmen in matches won and lost

Kohli contribution has had an equal contribution in won and lost matches. Tendulkar’s runs seem to have not helped in winning as much as only 50% of matches he has played have been won

par(mfrow=c(2,2))
par(mar=c(4,4,2,2))

batsmanContributionWonLost("tendulkarsp.csv","Tendulkar")
batsmanContributionWonLost("./kohlisp.csv","Kohli")
batsmanContributionWonLost("./gavaskarsp.csv","Gavaskar")
  

a

9 Performance of batsmen at home and overseas

The boxplots show that Kohli performs better overseas than at home. The 3rd quartile is higher, though the median seems to lower overseas. For Tendulkar the performance is similar both ways. Gavaskar’s median runs scored overseas is higher.

par(mfrow=c(2,2))
par(mar=c(4,4,2,2))


batsmanPerfHomeAway("tendulkarsp.csv","Tendulkar")
batsmanPerfHomeAway("./kohlisp.csv","Kohli")
batsmanPerfHomeAway("./gavaskarsp.csv","Gavaskar")

10. Moving average of runs

Gavaskar’s moving average was very good at the time of his retirement. Kohli seems to be going very strong. Tendulkar’s performance shows signs of deterioration around the time of his retirement.

par(mfrow=c(2,2))
par(mar=c(4,4,2,2))

batsmanMovingAverage("./tendulkar.csv","Tendulkar")
batsmanMovingAverage("./kohli.csv","Kohli")
batsmanMovingAverage("./gavaskar.csv","Gavaskar")

#dev.off()

11 Boxplot and histogram of runs

Kohli has a marginally higher average (50.69) than Tendulkar (48.65) while Gavaskar 46. The median runs are same for Tendulkar and Kohli at 32

par(mfrow=c(2,2))
par(mar=c(4,4,2,2))
batsmanPerfBoxHist("./tendulkar.csv","Sachin Tendulkar")
batsmanPerfBoxHist("./kohli.csv","Kohli")
batsmanPerfBoxHist("./gavaskar.csv","Gavaskar")

12 Cumulative average Runs for batsmen

Looking at the cumulative average runs we can see a gradual drop in the cumulative average for Tendulkar while Kohli and Gavaskar’s performance seems to be getting better

par(mfrow=c(2,2))
par(mar=c(4,4,2,2))
batsmanCumulativeAverageRuns("./tendulkar.csv","Tendulkar")
batsmanCumulativeAverageRuns("./kohli.csv","Kohli")
batsmanCumulativeAverageRuns("./gavaskar.csv","Gavaskar")

13. Cumulative average strike rate of batsmen

Tendulkar’s strike rate is better than Kohli and Gavaskar

par(mfrow=c(2,2))
par(mar=c(4,4,2,2))
batsmanCumulativeStrikeRate("./tendulkar.csv","Tendulkar")
batsmanCumulativeStrikeRate("./kohli.csv","Kohli")
batsmanCumulativeStrikeRate("./gavaskar.csv","Gavaskar")

14 Performance forecast of batsmen

The forecasted performance for Kohli and Gavaskar is higher than that of Tendulkar

par(mfrow=c(2,2))
par(mar=c(4,4,2,2))
batsmanPerfForecast("./tendulkar.csv","Sachin Tendulkar")
batsmanPerfForecast("./kohli.csv","Kohli")
batsmanPerfForecast("./gavaskar.csv","Gavaskar")

#dev.off()

15. Relative strike rate of batsmen

par(mar=c(4,4,2,2))

frames <- list("./tendulkar.csv","./kohli.csv","gavaskar.csv")
names <- list("Tendulkar","Kohli","Gavaskar")
relativeBatsmanSR(frames,names)
#dev.off()

16. Relative Runs frequency of batsmen

par(mar=c(4,4,2,2))
frames <- list("./tendulkar.csv","./kohli.csv","gavaskar.csv")
names <- list("Tendulkar","Kohli","Gavaskar")
relativeRunsFreqPerf(frames,names)
#dev.off()

17. Relative cumulative average runs of batsmen

Tendulkar leads the way here, but it can be seem Kohli catching up.

par(mar=c(4,4,2,2))
frames <- list("./tendulkar.csv","./kohli.csv","gavaskar.csv")
names <- list("Tendulkar","Kohli","Gavaskar")
relativeBatsmanCumulativeAvgRuns(frames,names)
#dev.off()

18. Relative cumulative average strike rate

Tendulkar has better strike rate than the other two.

par(mar=c(4,4,2,2))
frames <- list("./tendulkar.csv","./kohli.csv","gavaskar.csv")
names <- list("Tendulkar","Kohli","Gavaskar")
relativeBatsmanCumulativeStrikeRate(frames,names)
#dev.off()

19. Check batsman in form

As in the moving average and performance forecast and cumulative average runs, Kohli and Gavaskar are in-form while Tendulkar was out-of-form towards the end.

checkBatsmanInForm("./tendulkar.csv","Sachin Tendulkar")
## [1] "**************************** Form status of Sachin Tendulkar ****************************
\n\n Population size: 294  Mean of population: 50.48 \n Sample size: 33  Mean of sample: 32.42 SD of 
sample: 29.8 \n\n Null hypothesis H0 : Sachin Tendulkar 's sample average is within 95% confidence interval 
of population average\n Alternative hypothesis Ha : Sachin Tendulkar 's sample average is below 
the 95% confidence interval of population average\n\n 
Sachin Tendulkar 's Form Status: Out-of-Form because the p value: 0.000713  is less than alpha=  0.05 \n *******************************************************************************************\n\n"
checkBatsmanInForm("./kohli.csv","Kohli")
## [1] "**************************** Form status of Kohli ****************************\n\n Population size: 117
  Mean of population: 50.35 \n Sample size: 13  Mean of sample: 53.77 SD of sample: 46.15 \n\n Null 
hypothesis H0 : Kohli 's sample average is within 95% confidence interval of population average\n 
Alternative hypothesis Ha : Kohli 's sample average is below the 95% confidence interval of population
 average\n\n Kohli 's Form Status: In-Form because the p value: 0.603244  is greater than alpha=  0.05 \n *******************************************************************************************\n\n"
checkBatsmanInForm("./gavaskar.csv","Gavaskar")
## [1] "**************************** Form status of Gavaskar ****************************\n\n 
Population size: 125  Mean of population: 44.67 \n Sample size: 14  Mean of sample: 57.86 SD of sample:
 58.55 \n\n Null hypothesis H0 : Gavaskar 's sample average is within 95% confidence interval of population
 average\n Alternative hypothesis Ha : Gavaskar 's sample average is below the 95% confidence interval of 
population average\n\n Gavaskar 's Form Status: In-Form because the p value: 0.793276  is greater 
than alpha=  0.05 \n *******************************************************************************************\n\n"
#dev.off()

20. Performance 3D

A 3D regression plane is fitted between the the Balls faced, Minutes at crease and Runs scored

par(mfrow=c(2,2))
par(mar=c(4,4,2,2))
battingPerf3d("./tendulkar.csv","Sachin Tendulkar")
battingPerf3d("./kohli.csv","Kohli")
battingPerf3d("./gavaskar.csv","Gavaskar")
#dev.off()

20. Runs likelihood

This functions computes the K-Means and determines the runs the batsmen are likely to score.

par(mar=c(4,4,2,2))
batsmanRunsLikelihood("./tendulkar.csv","Tendulkar")
## Summary of  Tendulkar 's runs scoring likelihood
## **************************************************
## 
## There is a 16.51 % likelihood that Tendulkar  will make  139 Runs in  251 balls over 353  Minutes 
## There is a 25.08 % likelihood that Tendulkar  will make  66 Runs in  122 balls over  167  Minutes 
## There is a 58.41 % likelihood that Tendulkar  will make  16 Runs in  31 balls over 44  Minutes
batsmanRunsLikelihood("./kohli.csv","Kohli")
## Summary of  Kohli 's runs scoring likelihood
## **************************************************
## 
## There is a 20 % likelihood that Kohli  will make  143 Runs in  232 balls over 330  Minutes 
## There is a 33.85 % likelihood that Kohli  will make  51 Runs in  92 balls over  127  Minutes 
## There is a 46.15 % likelihood that Kohli  will make  11 Runs in  24 balls over 31  Minutes
batsmanRunsLikelihood("./gavaskar.csv","Gavaskar")
## Summary of  Gavaskar 's runs scoring likelihood
## **************************************************
## 
## There is a 33.81 % likelihood that Gavaskar  will make  69 Runs in  159 balls over 214  Minutes 
## There is a 8.63 % likelihood that Gavaskar  will make  172 Runs in  364 balls over  506  Minutes 
## There is a 57.55 % likelihood that Gavaskar  will make  13 Runs in  35 balls over 48  Minutes

21. Predict runs for a random combination of Balls faced and runs scored

BF <- seq( 10, 400,length=15)
Mins <- seq(30,600,length=15)
newDF <- data.frame(BF,Mins)
tendulkar <- batsmanRunsPredict("./tendulkar.csv","Tendulkar",newdataframe=newDF)
kohli <- batsmanRunsPredict("./kohli.csv","Kohli",newdataframe=newDF)
gavaskar <- batsmanRunsPredict("./gavaskar.csv","Gavaskar",newdataframe=newDF)
batsmen <-cbind(round(tendulkar$Runs),round(kohli$Runs),round(gavaskar$Runs))
colnames(batsmen) <- c("Tendulkar","Kohli","Gavaskar")
newDF <- data.frame(round(newDF$BF),round(newDF$Mins))
colnames(newDF) <- c("BallsFaced","MinsAtCrease")
predictedRuns <- cbind(newDF,batsmen)
predictedRuns
##    BallsFaced MinsAtCrease Tendulkar Kohli Gavaskar
## 1          10           30         7     6        4
## 2          38           71        23    24       17
## 3          66          111        39    42       30
## 4          94          152        54    60       43
## 5         121          193        70    78       56
## 6         149          234        86    96       69
## 7         177          274       102   114       82
## 8         205          315       118   132       95
## 9         233          356       134   150      108
## 10        261          396       150   168      121
## 11        289          437       165   186      134
## 12        316          478       181   204      147
## 13        344          519       197   222      160
## 14        372          559       213   240      173
## 15        400          600       229   258      186
#dev.off()

Key findings

  1. Kohli has a marginally higher average than Tendulkar
  2. Tendulkar has the best strike rate of all the 3.
  3. The cumulative average runs and the performance forecast for Kohli and Gavaskar show an improving trend, while Tendulkar’s numbers deteriorate towards the end of his career
  4. Kohli is fast catching up Tendulkar on cumulative average runs vs innings in career.

B ODI Cricket – Analysis of Tendulkar and Kohli

The functions below get the ODI data for Tendulkar and Kohli as CSV files so that the analyses can be done

22 Get player data for ODIs

tendulkarOD <- getPlayerDataOD(35320,dir=".",file="tendulkarOD.csv",type="batting")
kohliOD <- getPlayerDataOD(253802,dir=".",file="kohliOD.csv",type="batting")

#dev.off()

23a Basic performance of Tendulkar in ODI

par(mfrow=c(3,2))
par(mar=c(4,4,2,2))
batsmanRunsFreqPerf("./tendulkarOD.csv","Tendulkar")
batsmanRunsRanges("./tendulkarOD.csv","Tendulkar")
batsman4s("./tendulkarOD.csv","Tendulkar")
batsman6s("./tendulkarOD.csv","Tendulkar")
batsmanScoringRateODTT("./tendulkarOD.csv","Tendulkar")
#dev.off()

23b. Basic performance of Kohli in ODI

par(mfrow=c(3,2))
par(mar=c(4,4,2,2))
batsmanRunsFreqPerf("./kohliOD.csv","Kohli")
batsmanRunsRanges("./kohliOD.csv","Kohli")
batsman4s("./kohliOD.csv","Kohli")
batsman6s("./kohliOD.csv","Kohli")
batsmanScoringRateODTT("./kohliOD.csv","Kohli")
#dev.off()

24. Performance forecast in ODIs

Kohli’s forecasted runs are much higher than Tendulkar’s in ODIs

par(mar=c(4,4,2,2))
batsmanPerfForecast("./tendulkarOD.csv","Tendulkar")
batsmanPerfForecast("./kohliOD.csv","Kohli")

25. Batting performance

A 3D regression plane is fitted between Balls faced, Minutes at crease and Runs scored.

par(mar=c(4,4,2,2))
battingPerf3d("./tendulkarOD.csv","Tendulkar")
battingPerf3d("./kohliOD.csv","Kohli")

26. Predicting runs scored for the ODI batsmen

Kohli will score runs than Tendulkar for the same minutes at crease and balls faced.

BF <- seq( 10, 200,length=10)
Mins <- seq(30,220,length=10)
newDF <- data.frame(BF,Mins)
tendulkarDF <- batsmanRunsPredict("./tendulkarOD.csv","Tendulkar",newdataframe=newDF)
kohliDF <- batsmanRunsPredict("./kohliOD.csv","Kohli",newdataframe=newDF)
batsmen <-cbind(round(tendulkarDF$Runs),round(kohliDF$Runs))
colnames(batsmen) <- c("Tendulkar","Kohli")
newDF <- data.frame(round(newDF$BF),round(newDF$Mins))
colnames(newDF) <- c("BallsFaced","MinsAtCrease")
predictedRuns <- cbind(newDF,batsmen)
predictedRuns
##    BallsFaced MinsAtCrease Tendulkar Kohli
## 1          10           30         7     8
## 2          31           51        26    28
## 3          52           72        45    48
## 4          73           93        64    68
## 5          94          114        83    88
## 6         116          136       102   108
## 7         137          157       121   128
## 8         158          178       140   149
## 9         179          199       159   169
## 10        200          220       178   189

27. Runs likelihood for the ODI batsmen

Tendulkar has clusters around 13, 53 and 111 runs while Kohli has clusters around 13, 63,116. So it more likely that Kohli will tend to score higher

par(mar=c(4,4,2,2))
batsmanRunsLikelihood("./tendulkarOD.csv","Tendulkar")
## Summary of  Tendulkar 's runs scoring likelihood
## **************************************************
## 
## There is a 18.09 % likelihood that Tendulkar  will make  111 Runs in  118 balls over 172  Minutes 
## There is a 28.39 % likelihood that Tendulkar  will make  53 Runs in  63 balls over  95  Minutes 
## There is a 53.52 % likelihood that Tendulkar  will make  13 Runs in  18 balls over 27  Minutes
batsmanRunsLikelihood("./kohliOD.csv","Kohli")
## Summary of  Kohli 's runs scoring likelihood
## **************************************************
## 
## There is a 31.41 % likelihood that Kohli  will make  63 Runs in  69 balls over 97  Minutes 
## There is a 49.74 % likelihood that Kohli  will make  13 Runs in  18 balls over  24  Minutes 
## There is a 18.85 % likelihood that Kohli  will make  116 Runs in  113 balls over 163  Minutes

28. Runs in different venues for the ODI batsmen

par(mar=c(4,4,2,2))
batsmanAvgRunsGround("./tendulkarOD.csv","Tendulkar")
batsmanAvgRunsGround("./kohliOD.csv","Kohli")

28. Runs against different opposition for the ODI batsmen

Tendulkar’s has 50+ average against Bermuda, Kenya and Namibia. While Kohli has a 50+ average against New Zealand, West Indies, South Africa, Zimbabwe and Bangladesh

par(mar=c(4,4,2,2))
batsmanAvgRunsOpposition("./tendulkarOD.csv","Tendulkar")
batsmanAvgRunsOpposition("./kohliOD.csv","Kohli")

29. Moving average of runs for the ODI batsmen

Tendulkar’s moving average shows an improvement (50+) towards the end of his career, but Kohli shows a marked increase 60+ currently

par(mar=c(4,4,2,2))
batsmanMovingAverage("./tendulkarOD.csv","Tendulkar")
batsmanMovingAverage("./kohliOD.csv","Kohli")

30. Cumulative average runs of ODI batsmen

Tendulkar plateaus at 40+ while Kohli’s cumulative average runs goes up and up!!!

par(mar=c(4,4,2,2))
batsmanCumulativeAverageRuns("./tendulkarOD.csv","Tendulkar")
batsmanCumulativeAverageRuns("./kohliOD.csv","Kohli")

31 Cumulative strike rate of ODI batsmen

par(mar=c(4,4,2,2))
batsmanCumulativeStrikeRate("./tendulkarOD.csv","Tendulkar")
batsmanCumulativeStrikeRate("./kohliOD.csv","Kohli")

32. Relative batsmen strike rate

par(mar=c(4,4,2,2))

frames <- list("./tendulkarOD.csv","./kohliOD.csv")
names <- list("Tendulkar","Kohli")
relativeBatsmanSRODTT(frames,names)
#dev.off()

33. Relative Run Frequency percentages

par(mar=c(4,4,2,2))

frames <- list("./tendulkarOD.csv","./kohliOD.csv")
names <- list("Tendulkar","Kohli")
relativeRunsFreqPerfODTT(frames,names)
#dev.off()

34. Relative cumulative average runs of ODI batsmen

Kohli breaks away from Tendulkar in cumulative average runs after 100 innings

par(mar=c(4,4,2,2))

frames <- list("./tendulkarOD.csv","./kohliOD.csv")
names <- list("Tendulkar","Kohli")
relativeBatsmanCumulativeAvgRuns(frames,names)
#dev.off()

35. Relative cumulative strike rate of ODI batsmen

This seems to be tussle with Kohli having an edge till about 40 innings and then from 40+ to 180 innings Tendulkar leads. Kohli just seems to be edging forward.

par(mar=c(4,4,2,2))

frames <- list("./tendulkarOD.csv","./kohliOD.csv")
names <- list("Tendulkar","Kohli")
relativeBatsmanCumulativeStrikeRate(frames,names)
#dev.off()

36. Batsmen 4s and 6s

par(mar=c(4,4,2,2))

frames <- list("./tendulkarOD.csv","./kohliOD.csv")
names <- list("Tendulkar","Kohli")
batsman4s6s(frames,names)
##                Tendulkar Kohli
## Runs(1s,2s,3s)     66.29 69.67
## 4s                 29.65 25.90
## 6s                  4.06  4.43
#dev.off()

37. Check ODI batsmen form

par(mar=c(4,4,2,2))

checkBatsmanInForm("./tendulkar.csv","Tendulkar")
## [1] "**************************** Form status of Tendulkar ********
********************\n\n Population size: 294  Mean of population: 50.48 \n
 Sample size: 33  Mean of sample: 32.42 SD of sample: 29.8 \n\n 
Null hypothesis H0 : Tendulkar 's sample average is within 95% confidence
 interval of population average\n Alternative hypothesis 
Ha : Tendulkar 's sample average is below the 95% confidence interval 
of population average\n\n Tendulkar 's Form Status: Out-of-Form because the p value: 0.000713  is less than alpha=  0.05 \n *******************************************************************************************\n\n"
checkBatsmanInForm("./kohli.csv","Kohli")
## [1] "**************************** Form status of Kohli ***********
*****************\n\n Population size: 117  Mean of population: 50.35 \n
 Sample size: 13  Mean of sample: 53.77 SD of sample: 46.15 \n\n 
Null hypothesis H0 : Kohli 's sample average is within 95% confidence 
interval of population average\n Alternative hypothesis 
Ha : Kohli 's sample average is below the 95% confidence interval 
of population average\n\n Kohli 's Form Status: In-Form because 
the p value: 0.603244  is greater than alpha=  0.05 \n *******************************************************************************************\n\n"
#dev.off()

Key Findings

  1. Kohli has a better performance against oppositions like West Indies, South Africa and New Zealand
  2. Kohli breaks away from Tendulkar in cumulative average runs
  3. Tendulkar has been leading the strike rate rate but Kohli in recent times seems to be breaking loose.

Check out some other players with my R package cricketr

Important note: Do check out my other posts using cricketr at cricketr-posts

Also see

  1. My book ‘Practical Machine Learning in R and Python: Third edition’ on Amazon
  2. A primer on Qubits, Quantum gates and Quantum Operations
  3. De-blurring revisited with Wiener filter using OpenCV
  4. Deep Learning from first principles in Python, R and Octave – Part 4
  5. The Many Faces of Latency
  6. Fun simulation of a Chain in Android
  7. Presentation on Wireless Technologies – Part 1
  8. yorkr crashes the IPL party ! – Part 1

To see all posts click Index of posts
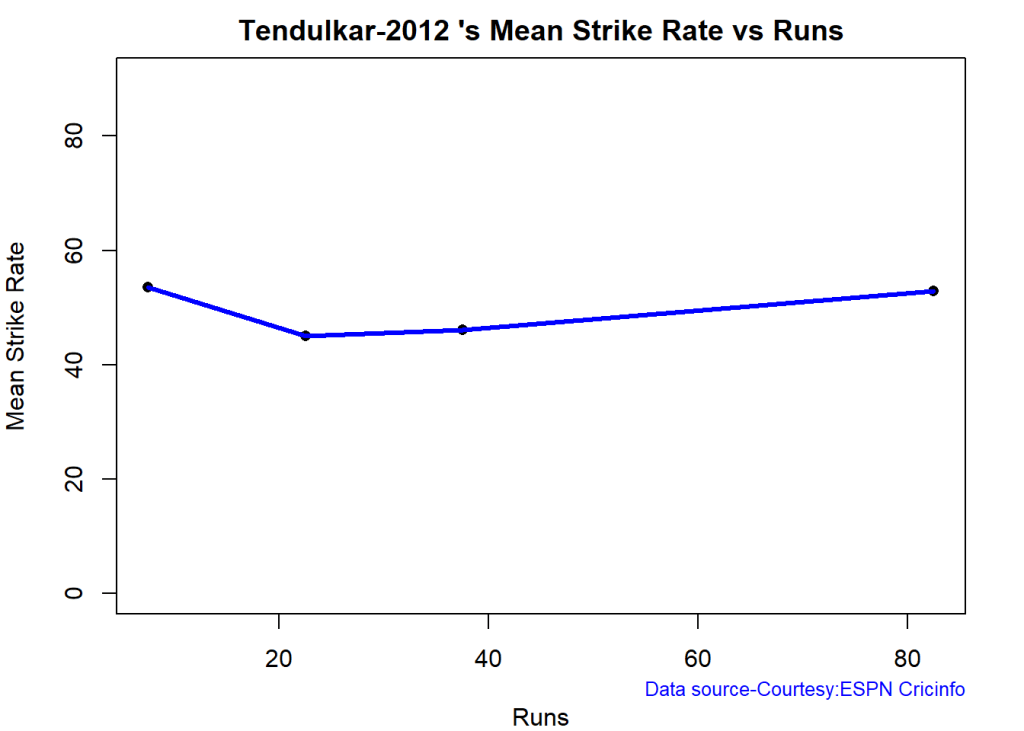
yorkpy takes a hat-trick, bowls out Intl. T20s, BBL and Natwest T20!!!

“Dear, dear! How queer everything is to-day! And yesterday things went on just as usual. I wonder if I’ve been changed in the night? Let me think: was I the same when I got up this morning? I almost think I can remember feeling a little different. But if I’m not the same, the next question is ’Who in the world am I? Ah, that’s the great puzzle!”

             Alice's adventures  in Wonderland, Lewis Carroll

1. Introduction

In this post, yorkpy clean bowls the following T20 formats namely International T20s, Big Bash League and Natwest T20 Blast. I take yorkpy on a spin through these T20 leagues. In the post below,I choose a random set of about 10-12 of the overall 63 functions that yorkpy has, and execute them for each of the different T20 leagues – Intl T20s, BBL and Natwest T20s. yorkpy, is the python avatar of my R package yorkr, see Introducing cricket package yorkr: Part 1- Beaten by sheer pace!

There were a couple of new functions that needed to be added for each of the T20 leagues – Intl T20, BBL and Natwest T20 to take into account the different teams in each of these leagues. Further some bugs were also ironed out in tje latest version of yorkpy. yorkpy uses data from Cricsheet . The match data is in the form of YAML files. yorkpy converts these YAML files to dataframes. YAML files are very detailed and include a ball-by-ball account of the match.

– You can clone/fork the latest code for yorkpy from github yorkpy
– This post has also been published in RPubs at yorkpy takes a hat-trick
– You can download the PDF version of this post at yorkpy takes a hat-trick

The data for IPL, Intl. T20, BBL and Natwest T20 have already been converted into pandas dataframes and saved as CSVs. You can download the converted files from Github at [allYorkpyT20Data])(https://github.com/tvganesh/allYorkpyT20Data)

yorkpy has the following 4 main classes of functions

A.Functions analyzing individual T20 match (Class 1)

This was demonstrated in Pitching yorkpy . short of good length to IPL – Part 1 The functions deal with individual T20 matches. The functions are

  1. convertYaml2PandasDataframeT20()
  2. convertAllYaml2PandasDataframesT20()
  3. teamBattingScorecardMatch()
  4. teamBatsmenPartnershipMatch()
  5. teamBatsmenVsBowlersMatch()
  6. teamBowlingScorecardMatch()
  7. teamBowlingWicketKindMatch()
  8. teamBowlingWicketRunsMatch()
  9. teamBowlingWicketMatch()
  10. teamBowlersVsBatsmenMatch()
  11. matchWormChart()

B. Functions that analyze all matches between 2 T20 teams (Class 2

Pitching yorkpy.on the middle and outside off-stump to IPL – Part 2 included functions that analyze head-to-head confrontation between any 2 T20 teams The functions are

  1. getAllMatchesBetweenTeams()
  2. saveAllMatchesBetween2IPLTeams()
  3. getAllMatchesBetweenTeams()
  4. saveAllMatchesBetween2IPLTeams()
  5. teamBatsmenPartnershiOppnAllMatches()
  6. teamBatsmenPartnershipOppnAllMatchesChart()
  7. teamBatsmenVsBowlersOppnAllMatches()
  8. teamBattingScorecardOppnAllMatches()
  9. teamBowlingScorecardOppnAllMatches()
  10. teamBowlingWicketKindOppositionAllMatches()
  11. teamBowlersVsBatsmenOppnAllMatches()
  12. plotWinLossBetweenTeams()
  13. plotWinsByRunOrWickets() 23.plotWinsbyTossDecision()

C. Functions that analyze the performance of a T20 team against all other teams (Class 3)

The post Pitching yorkpy.swinging away from the leg stump to IPL – Part 3 is based on Class C set of functions shown below

  1. getAllMatchesAllOpposition()
  2. saveAllMatchesAllOppositionIPLT20(dir1)
  3. getAllMatchesAllOpposition()
  4. saveAllMatchesAllOppositionIPLT20()
  5. teamBatsmenPartnershiAllOppnAllMatches()
  6. teamBatsmenPartnershipAllOppnAllMatchesChart()
  7. teamBatsmenVsBowlersAllOppnAllMatches()
  8. teamBattingScorecardAllOppnAllMatches()
  9. teamBowlingScorecardAllOppnAllMatches()
  10. teamBowlingWicketKindAllOppnAllMatches()
  11. teamBowlersVsBatsmenAllOppnAllMatches()
  12. plotWinLossByTeamAllOpposition()
  13. plotWinsByRunOrWicketsAllOpposition()
  14. plotWinsbyTossDecisionAllOpposition()

D. Functions that analyze performances of T20 batsmen and bowlers (Class 4)

These set of functions analyze individual batsmen and bowlers and have been used in Pitching yorkpy . in the block hole – Part 4 The functions are

  1. getTeamBattingDetails()
  2. getBatsmanDetails()
  3. batsmanRunsVsDeliveries()
  4. batsmanFoursSixes()
  5. batsmanDismissals()
  6. batsmanRunsVsStrikeRate()
  7. batsmanMovingAverage()
  8. batsmanCumulativeAverageRuns()
  9. batsmanCumulativeStrikeRate()
  10. batsmanRunsAgainstOpposition()
  11. batsmanRunsVenue
  12. getTeamBowlingDetails()
  13. getBowlerWicketDetails()
  14. bowlerMeanEconomyRate()
  15. bowlerMeanRunsConceded()
  16. bowlerMovingAverage()
  17. bowlerCumulativeAvgWickets()
  18. bowlerCumulativeAvgEconRate()
  19. bowlerWicketPlot()
  20. bowlerWicketsAgainstOpposition()
  21. bowlerWicketsVenue()

Additional new functions were added to handle Intl T20s, Big Bash League and Natwest T20 Blast, since the teams are different. They are

59. saveAllMatchesBetween2IntlT20s()
60. saveAllMatchesAllOppositionIntlT20()
61. saveAllMatchesBetween2BBLTeams()
62 saveAllMatchesAllOppositionBBLT20()
63. saveAllMatchesBetween2NWBTeams()
64. saveAllMatchesAllOppositionNWBT20()

All other functions can be used as is! You can get the help of any function in yorkpy using

import yorkpy.analytics as yka
help(yka.teamBatsmenPartnershiOppnAllMatches)
## Help on function teamBatsmenPartnershiOppnAllMatches in module yorkpy.analytics:
## 
## teamBatsmenPartnershiOppnAllMatches(matches, theTeam, report='summary', top=5)
##     Team batting partnership against a opposition all IPL matches
##     
##     Description
##     
##     This function computes the performance of batsmen against all bowlers of an oppositions in 
##     all matches. This function returns a dataframe
##     
##     Usage
##     
##     teamBatsmenPartnershiOppnAllMatches(matches,theTeam,report="summary")
##     Arguments
##     
##     matches     
##     All the matches of the team against the oppositions
##     theTeam     
##     The team for which the the batting partnerships are sought
##     report      
##     If the report="summary" then the list of top batsmen with the highest partnerships 
##     is displayed. If report="detailed" then the detailed break up of partnership is returned 
##     as a dataframe
##     top
##     The number of players to be displayed from the top
##     Value
##     
##     partnerships The data frame of the partnerships
##     
##     Note
##     
##     Maintainer: Tinniam V Ganesh tvganesh.85@gmail.com
##     
##     Author(s)
##     
##     Tinniam V Ganesh
##     
##     References
##     
##     http://cricsheet.org/
##     https://gigadom.wordpress.com/
##     
##     
##     See Also
##     
##     teamBatsmenVsBowlersOppnAllMatchesPlot
##     teamBatsmenPartnershipOppnAllMatchesChart

As I mentioned above I will be randomly choosing a set of 12 functions from Class 1,2,3,4 for each of the T20 leagues (Intl T20, BBL and NWB T20) for analysis

2. International T20s

The following functions were added for handling Intl. T20s

  1. saveAllMatchesBetween2IntlT20s()
  2. saveAllMatchesAllOppositionIntlT20()

To handle the countries in Intl. T20s below

Afghanistan, Australia, Bangladesh, Bermuda, Canada, England,Hong Kong,India, Ireland, Kenya, Nepal, Netherlands, “New Zealand, Oman,Pakistan,Scotland,South Africa, Sri Lanka, United Arab Emirates,West Indies, Zimbabwe

import os
#os.chdir('C:\\software\\cricket-package\\yorkpyT20\\t20s')
#import yorkpy.analytics as yka
#1.  Convert all YAML files to dataframes and CSV
#yka.convertAllYaml2PandasDataframesT20(".", "..\\data1")
#dir1='C:\\software\\cricket-package\\yorkpyT20\\IntlT20-Matches'
#2. Save all matches between 2 T20 teams
#yka.saveAllMatchesBetween2IntlT20s(dir1)
#3. Save all matches between a T20 team and all other teams
#dir1='C:\\software\\cricket-package\\yorkpyT20\\IntlT20-Matches'
#yka.saveAllMatchesAllOppositionIntlT20(dir1)
#4. Get batting details
#dir1='C:\\software\\cricket-package\\yorkpyT20\\IntlT20-Matches
#yka.getTeamBattingDetails("Afghanistan",dir=dir1, save=True)
#yka.getTeamBattingDetails("Australia",dir=dir1,save=True)
#yka.getTeamBattingDetails("Bangladesh",dir=dir1,save=True)
#...
#5. Get bowling details
#dir1='C:\\software\\cricket-package\\yorkpyT20\\IntlT20-Matches
#yka.getTeamBowlingDetails("Afghanistan",dir=dir1, save=True)
#yka.getTeamBowlingDetails("Australia",dir=dir1,save=True)
#yka.getTeamBowlingDetails("Bangladesh",dir=dir1,save=True)
# ...

Once the data is converted you can use the yorkpy functions. The data has been converted for Intl T20 and is available at Github at IntlT20

To use the yorkpy functions for a new league we need to initial convert the YAML files into appropriate format for processing by yorkpy functions

This will create the necessary files which are are used in the functions below

2.2 2.1 Intl. T20 – Team score card  (Class 1)

import os
import pandas as pd
import yorkpy.analytics as yka
dir1="C:\\software\\cricket-package\\yorkpyT20\\IntlT20-Matches"
path=os.path.join(dir1,".\\India-New Zealand-2007-09-16.csv")
ind_nz=pd.read_csv(path)
scorecard,extras=yka.teamBattingScorecardMatch(ind_nz,"India")
print(scorecard)
##             batsman  runs  balls  4s  6s          SR
## 0         G Gambhir    51     34   5   2  150.000000
## 1          V Sehwag    40     18   6   2  222.222222
## 2        RV Uthappa     0      2   0   0    0.000000
## 3          MS Dhoni    24     20   2   0  120.000000
## 4      Yuvraj Singh     5      7   0   0   71.428571
## 5        KD Karthik    17     12   3   0  141.666667
## 6         IK Pathan    11     10   2   0  110.000000
## 7        AB Agarkar     1      2   0   0   50.000000
## 8   Harbhajan Singh     7      6   1   0  116.666667
## 9       S Sreesanth    19     10   4   0  190.000000
## 10         RP Singh     1      1   0   0  100.000000
print(extras)
##    total  wides  noballs  legbyes  byes  penalty  extras
## 0    370      6        0        8     0        0      14

2.2 Intl. T20 -Team batsmen partnership (Class 1)

import os
import pandas as pd
import yorkpy.analytics as yka
dir1="C:\\software\\cricket-package\\yorkpyT20\\IntlT20-Matches"
path=os.path.join(dir1,".\\South Africa-Australia-2009-03-27.csv")
sa_aus=pd.read_csv(path)
yka.teamBatsmenPartnershipMatch(sa_aus,'Australia','New Zealand',plot=True)

2.3 Intl. T20 -Team bowling scorecard match (Class 1)

import os
import pandas as pd
import yorkpy.analytics as yka
dir1="C:\\software\\cricket-package\\yorkpyT20\\IntlT20-Matches"
path=os.path.join(dir1,".\\Sri Lanka-West Indies-2012-09-28.csv")
sl_wi=pd.read_csv(path)
a=yka.teamBowlingScorecardMatch(sl_wi,'Sri Lanka')
print(a)
##          bowler  overs  runs  maidens  wicket  econrate
## 0    A Mohammed      2    13        0       0       6.5
## 1  SA Campbelle      1     8        0       1       8.0
## 2     SC Selman      1     3        0       0       3.0
## 3      SF Daley      2     5        0       1       2.5
## 4     SR Taylor      2     4        0       1       2.0
## 5     TD Smartt      2    17        0       0       8.5

2.4 Intl. T20 -Match Worm chart (Class 1)

import os
import pandas as pd
import yorkpy.analytics as yka
dir1="C:\\software\\cricket-package\\yorkpyT20\\IntlT20-Matches"
path=os.path.join(dir1,".\\England-India-2012-09-29.csv")
eng_ind=pd.read_csv(path)
yka.matchWormChart(eng_ind,"England", "India")

path=os.path.join(dir1,".\\Bangladesh-Ireland-2015-12-05.csv")
ban_ire=pd.read_csv(path)
yka.matchWormChart(ban_ire,"Bangladesh", "Ireland")

2.5 Intl. T20 -Team Batting partnerships all matches 2 teams (Class 2)

import os
import pandas as pd
import yorkpy.analytics as yka
dir1="C:\\software\\cricket-package\\yorkpyT20\\IntlT20-allMatchesBetween2Teams"
path=os.path.join(dir1,"India-England-allMatches.csv")
dc_mi_matches = pd.read_csv(path)
theTeam='India'
m=yka.teamBatsmenPartnershiOppnAllMatches(dc_mi_matches,theTeam,report="detailed", top=4)
print(m)
##      batsman  totalPartnershipRuns    non_striker  partnershipRuns
## 0   SK Raina                   265      G Gambhir                2
## 1   SK Raina                   265       KL Rahul               40
## 2   SK Raina                   265      MK Tiwary               24
## 3   SK Raina                   265       MS Dhoni              124
## 4   SK Raina                   265        P Kumar                0
## 5   SK Raina                   265      PP Chawla                4
## 6   SK Raina                   265       R Ashwin                1
## 7   SK Raina                   265      RG Sharma               16
## 8   SK Raina                   265        V Kohli               47
## 9   SK Raina                   265   Yuvraj Singh                7
## 10  MS Dhoni                   264       A Mishra                1
## 11  MS Dhoni                   264      AT Rayudu               18
## 12  MS Dhoni                   264      HH Pandya                8
## 13  MS Dhoni                   264      IK Pathan                2
## 14  MS Dhoni                   264      JJ Bumrah                2
## 15  MS Dhoni                   264      MK Pandey                3
## 16  MS Dhoni                   264  Parvez Rasool               21
## 17  MS Dhoni                   264       R Ashwin               11
## 18  MS Dhoni                   264      RA Jadeja               11
## 19  MS Dhoni                   264      RG Sharma                9
## 20  MS Dhoni                   264        RR Pant                6
## 21  MS Dhoni                   264     RV Uthappa                5
## 22  MS Dhoni                   264       SK Raina               98
## 23  MS Dhoni                   264      YK Pathan               36
## 24  MS Dhoni                   264   Yuvraj Singh               33
## 25   V Kohli                   236      AM Rahane                3
## 26   V Kohli                   236      G Gambhir               78
## 27   V Kohli                   236       KL Rahul               46
## 28   V Kohli                   236      RG Sharma                2
## 29   V Kohli                   236     RV Uthappa                4
## 30   V Kohli                   236       S Dhawan               45
## 31   V Kohli                   236       SK Raina               48
## 32   V Kohli                   236   Yuvraj Singh               10
## 33     M Raj                   176       A Sharma                2
## 34     M Raj                   176         H Kaur               18
## 35     M Raj                   176      J Goswami                6
## 36     M Raj                   176        KV Jain                5
## 37     M Raj                   176       L Kumari                5
## 38     M Raj                   176    N Niranjana                3
## 39     M Raj                   176       N Tanwar               17
## 40     M Raj                   176        PG Raut               41
## 41     M Raj                   176     R Malhotra                5
## 42     M Raj                   176     S Mandhana                8
## 43     M Raj                   176         S Naik               10
## 44     M Raj                   176       S Pandey               19
## 45     M Raj                   176       SK Naidu               37

2.6 Intl. T20 -Team Batsmen vs Bowlers all matches 2 teams (Class 2)

import os
import pandas as pd
import yorkpy.analytics as yka
dir1="C:\\software\\cricket-package\\yorkpyT20\\IntlT20-allMatchesBetween2Teams"
path=os.path.join(dir1,"Ireland-Netherlands-allMatches.csv")
ire_nl_matches = pd.read_csv(path)
yka.teamBatsmenVsBowlersOppnAllMatches(ire_nl_matches,'Ireland',"Netherlands",plot=True,top=3,runsScored=10)

2.7 Intl. T20 -Team Bowling scorecard all matches 2 teams (Class 2)

import os
import pandas as pd
import yorkpy.analytics as yka
dir1="C:\\software\\cricket-package\\yorkpyT20\\IntlT20-allMatchesBetween2Teams"
path=os.path.join(dir1,"Bangladesh-Nepal-allMatches.csv")
bang_nep_matches = pd.read_csv(path)
scorecard=yka.teamBowlingScorecardOppnAllMatches(bang_nep_matches,'Bangladesh',"Nepal")
print(scorecard)
##         bowler  overs  runs  maidens  wicket   econrate
## 0      B Regmi      3    14        0       1   4.666667
## 3   SP Gauchan      4    40        0       1  10.000000
## 1   JK Mukhiya      2    16        0       0   8.000000
## 2     P Khadka      3    23        0       0   7.666667
## 4    Sagar Pun      1    16        0       0  16.000000
## 5  Sompal Kami      2    21        0       0  10.500000

2.8 Intl. T20 -Team Batsmen vs Bowlers all Oppositions (Class 3)

import os
import pandas as pd
import yorkpy.analytics as yka
dir1="C:\\software\\cricket-package\\yorkpyT20\\\IntlT20-allMatchesAllOpposition\\"
path=os.path.join(dir1,"Australia-allMatchesAllOpposition.csv")
aus_matches = pd.read_csv(path)
yka.teamBatsmenVsBowlersAllOppnAllMatches(aus_matches,"Australia",plot=True,top=3,runsScored=40)

2.9 Intl. T20 -Wins vs Losses of a team against all other teams (Class 3)

import os
import pandas as pd
import yorkpy.analytics as yka
dir1="C:\\software\\cricket-package\\yorkpyT20\\\IntlT20-allMatchesAllOpposition\\"
path=os.path.join(dir1,"South Africa-allMatchesAllOpposition.csv")
sa_matches = pd.read_csv(path)
team1='South Africa'
yka.plotWinLossByTeamAllOpposition(sa_matches,team1,plot="detailed")

2.10 Intl. T20 -Batsmen analysis (Class 4)

import os
import pandas as pd
import yorkpy.analytics as yka
dir1="C:\\software\\cricket-package\\yorkpyT20\\\IntlT20-BattingBowlingDetails\\"
# Rohit Sharma
name="RG Sharma"
team='India'
df=yka.getBatsmanDetails(team,name,dir=dir1)
yka.batsmanCumulativeAverageRuns(df,name)

# MJ Guptill
name="MJ Guptill"
team='New Zealand'
df=yka.getBatsmanDetails(team,name,dir=dir1)
yka.batsmanCumulativeStrikeRate(df,name)

2.11 Intl. T20 -Bowler analysis (Class 4)

import os
import pandas as pd
import yorkpy.analytics as yka
dir1="C:\\software\\cricket-package\\yorkpyT20\\\IntlT20-BattingBowlingDetails\\"
# Shakib Al Hasan
name="Shakib Al Hasan"
team='Bangladesh'
df=yka.getBowlerWicketDetails(team,name,dir=dir1)
yka.bowlerMeanEconomyRate(df,name)

# Rashid Khan
name="SL Malinga"
team='Sri Lanka'
df=yka.getBowlerWicketDetails(team,name,dir=dir1)
yka.bowlerWicketsAgainstOpposition(df,name)

3. Big Bash League

The following functions for added to handle BBL teams

  1. saveAllMatchesBetween2BBLTeams()
  2. saveAllMatchesAllOppositionBBLT20

The BBL teams are included are Adelaide Strikers, Brisbane Heat, Hobart Hurricanes, Melbourne Renegades, Perth Scorchers, Sydney Sixers, Sydney Thunder

To use the yorkpy functions first the YAML files have to be converted into pandas dataframe and then saved as CSV as shown below

import os
import yorkpy.analytics as yka
os.chdir('C:\\software\\cricket-package\\yorkpyBBL\\bbl')
#1. Convert all YAML files to dataframes and save as CSV
#yka.convertAllYaml2PandasDataframesT20(".", "..\\BBLT20-Matches")
#2. Save all matches between 2 BBL teams
dir1='C:\\software\\cricket-package\\yorkpyBBL\\BBLT20-Matches'
#yka.saveAllMatchesBetween2BBLTeams(dir1)
#3. Save T20 matches between a BBL team and all other teams
dir1='C:\\software\\cricket-package\\yorkpyBBL\\BBLT20-Matches'
#yka.saveAllMatchesAllOppositionBBLT20(dir1)
#4. Get the batting details
dir1='C:\\software\\cricket-package\\yorkpyBBL\\BBLT20-Matches'
#yka.getTeamBattingDetails("Adelaide Strikers",dir=dir1, save=True)
#yka.getTeamBattingDetails("Brisbane Heat",dir=dir1,save=True)
#yka.getTeamBattingDetails("Hobart Hurricanes",dir=dir1,save=True)
#...
# Get the bowling details
dir1='C:\\software\\cricket-package\\yorkpyBBL\\BBLT20-Matches'
#yka.getTeamBowlingDetails("Adelaide Strikers",dir=dir1, save=True)
#yka.getTeamBowlingDetails("Brisbane Heat",dir=dir1,save=True)
#yka.getTeamBowlingDetails("Hobart Hurricanes",dir=dir1,save=True)
#...

The functions below perform analysis on the generated files from above. The YAML files have already been converted and are available at Github at BBL

3.1 Big Bash League – Team score card (Class 1)

import os
import pandas as pd
import yorkpy.analytics as yka
dir1="C:\\software\\cricket-package\\yorkpyBBL\\BBLT20-Matches"
path=os.path.join(dir1,".\\Adelaide Strikers-Brisbane Heat-2012-12-13.csv")
as_bh=pd.read_csv(path)
scorecard,extras=yka.teamBattingScorecardMatch(as_bh,"Brisbane Heat")
print(scorecard)
##          batsman  runs  balls  4s  6s          SR
## 0  LA Pomersbach    65     42   8   2  154.761905
## 1       JR Hopes     1      2   0   0   50.000000
## 2       JA Burns    37     31   2   2  119.354839
## 3   DT Christian    12     15   0   0   80.000000
## 4    NLTC Perera    12      4   0   2  300.000000
## 5        CA Lynn    19     18   1   1  105.555556
## 6    BCJ Cutting    13      5   0   2  260.000000
## 7     PJ Forrest    12      8   0   1  150.000000
## 8     CD Hartley     5      2   1   0  250.000000
print(extras)
##    total  wides  noballs  legbyes  byes  penalty  extras
## 0    371     10        2        5     0        0      17

3.2 Big Bash League -Team batsmen vs Bowlers (Class 1)

import os
import pandas as pd
import yorkpy.analytics as yka
dir1="C:\\software\\cricket-package\\yorkpyBBL\\BBLT20-Matches"
path=os.path.join(dir1,".\\Hobart Hurricanes-Melbourne Renegades-2012-01-18.csv")
hh_mr=pd.read_csv(path)
yka.teamBatsmenVsBowlersMatch(hh_mr,'Hobart Hurricanes','Melbourne Renegades',plot=True)

3.3 Big Bash League -Team bowling scorecard match (Class 1)

import os
import pandas as pd
import yorkpy.analytics as yka
dir1="C:\\software\\cricket-package\\yorkpyBBL\\BBLT20-Matches"
path=os.path.join(dir1,".\\Melbourne Stars-Sydney Thunder-2016-01-24.csv")
ms_st=pd.read_csv(path)
a=yka.teamBowlingScorecardMatch(ms_st,'Sydney Thunder')
print(a)
##           bowler  overs  runs  maidens  wicket   econrate
## 0        A Zampa      4    32        0       2   8.000000
## 1  BW Hilfenhaus      2    21        0       0  10.500000
## 2      DJ Hussey      1     9        0       1   9.000000
## 3     DJ Worrall      3    42        0       0  14.000000
## 4      EP Gulbis      2    19        0       0   9.500000
## 5        MA Beer      3    25        0       1   8.333333
## 6     MP Stoinis      4    30        0       3   7.500000

3.4 Big Bash League – Match Worm chart (Class 1)

import os
import pandas as pd
import yorkpy.analytics as yka
dir1="C:\\software\\cricket-package\\yorkpyBBL\\BBLT20-Matches"
path=os.path.join(dir1,".\\Sydney Sixers-Melbourne Stars-2011-12-27.csv")
ss_ms=pd.read_csv(path)
yka.matchWormChart(ss_ms,"Melbourne Stars", "Sydney Sixers")

path=os.path.join(dir1,".\\Hobart Hurricanes-Brisbane Heat-2015-01-02.csv")
hh_bh=pd.read_csv(path)
yka.matchWormChart(hh_bh,"Hobart Hurricanes", "Brisbane Heat")

3.5 Big Bash League -Team Batting partnerships all matches 2 teams (Class 2)

import os
import pandas as pd
import yorkpy.analytics as yka
dir1="C:\\software\\cricket-package\\yorkpyBBL\\BBLT20-allMatchesBetween2Teams"
path=os.path.join(dir1,"Brisbane Heat-Adelaide Strikers-allMatches.csv")
bh_as_matches = pd.read_csv(path)
yka.teamBatsmenPartnershipOppnAllMatchesChart(bh_as_matches,"Brisbane Heat","Adelaide Strikers",plot=True, top=4, partnershipRuns=20)

3.6 Big Bash League -Team Bowling wicket kind all matches 2 teams (Class 2)

import os
import pandas as pd
import yorkpy.analytics as yka
dir1="C:\\software\\cricket-package\\yorkpyBBL\\BBLT20-allMatchesBetween2Teams"
path=os.path.join(dir1,"Sydney Sixers-Perth Scorchers-allMatches.csv")
ss_ps_matches = pd.read_csv(path)
yka.teamBowlingWicketKindOppositionAllMatches(ss_ps_matches,'Perth Scorchers','Sydney Sixers',plot=True,top=5,wickets=1)

3.7 Big Bash League -Team Bowling scorecard all teams (Class 3)

import os
import pandas as pd
import yorkpy.analytics as yka
dir1="C:\\software\\cricket-package\\yorkpyBBL\\BBLT20-allMatchesAllOpposition"
path=os.path.join(dir1,"Hobart Hurricanes-allMatchesAllOpposition.csv")
hh_matches = pd.read_csv(path)
scorecard=yka.teamBowlingScorecardAllOppnAllMatches(hh_matches,"Hobart Hurricanes")
print(scorecard)
##              bowler  overs  runs  maidens  wicket   econrate
## 16            B Lee     20   132        0       9   6.600000
## 30         CJ McKay     13   110        0       9   8.461538
## 88    NJ Rimmington     16   103        1       9   6.437500
## 67      JW Hastings     15    88        0       8   5.866667
## 63      JP Faulkner     15   146        0       7   9.733333
## 27        CJ Gannon     17   147        1       7   8.647059
## 93          NM Lyon      8    51        0       7   6.375000
## 20      BCJ Cutting     27   226        0       7   8.370370
## 48          GB Hogg     22   167        0       7   7.590909
## 107       SM Boland     12    96        0       7   8.000000
## 15       B Laughlin     13    99        0       7   7.615385
## 87      MT Steketee     15   134        0       5   8.933333
## 121    Yasir Arafat      9    48        0       4   5.333333
## 96       PJ Cummins      8    83        0       4  10.375000
## 46      Fawad Ahmed     11    64        0       4   5.818182
## 76          MA Beer     12    63        0       4   5.250000
## 108     SNJ O'Keefe     15   104        0       4   6.933333
## 75   M Muralitharan      7    31        0       4   4.428571
## 10           AJ Tye     16   127        0       4   7.937500
## 52          J Botha     13    94        0       4   7.230769
## 56     JL Pattinson      7    71        0       4  10.142857
## 62   JP Behrendorff     16   119        0       4   7.437500
## 3           AC Agar     12    87        0       4   7.250000
## 24     BM Edmondson      4    40        0       4  10.000000
## 37        DJ Hussey      8    47        0       3   5.875000
## 49       GJ Maxwell      8    65        0       3   8.125000
## 84       MN Samuels      4    22        0       3   5.500000
## 81         MG Neser      5    54        0       3  10.800000
## 44     DT Christian      9   114        0       3  12.666667
## 50        GS Sandhu      7    51        0       3   7.285714
## ..              ...    ...   ...      ...     ...        ...
## 43        DP Nannes      8    58        0       1   7.250000
## 51         IA Moran      4    25        0       1   6.250000
## 55         JK Lalor     10    82        0       1   8.200000
## 54        JH Kallis      3    18        0       1   6.000000
## 73   LR Butterworth      4    25        0       1   6.250000
## 4      AC McDermott      2    28        0       1  14.000000
## 70         LA Doran      4    38        0       1   9.500000
## 69    KW Richardson      6    44        0       1   7.333333
## 119     WD Sheridan      2     6        0       0   3.000000
## 2       AB McDonald      1    15        0       0  15.000000
## 115      TD Andrews      3    23        0       0   7.666667
## 11          AK Heal      4    33        0       0   8.250000
## 7        AD Russell      4    40        0       0  10.000000
## 8          AJ Finch      2    15        0       0   7.500000
## 9         AJ Turner      3    28        0       0   9.333333
## 60        JM Mennie      1    20        0       0  20.000000
## 18        BA Stokes      1     9        0       0   9.000000
## 26         CH Gayle      1    16        0       0  16.000000
## 28         CJ Green      4    44        0       0  11.000000
## 95   PD Collingwood      2    20        0       0  10.000000
## 31       CJ Simmons      4    21        0       0   5.250000
## 59       JM Holland      3    34        0       0  11.333333
## 36         DJ Bravo      6    64        0       0  10.666667
## 38     DJ Pattinson      2    16        0       0   8.000000
## 41       DJ Worrall      8    90        0       0  11.250000
## 72      LN O'Connor      6    56        0       0   9.333333
## 71        LJ Wright      3    27        0       0   9.000000
## 68       KA Pollard      1     7        0       0   7.000000
## 58       JM Herrick      4    23        0       0   5.750000
## 92       NM Hauritz      5    42        0       0   8.400000
## 
## [122 rows x 6 columns]

3.8 Big Bash League -Plot wins vs losses against all teams(Class 3)

import os
import pandas as pd
import yorkpy.analytics as yka
dir1="C:\\software\\cricket-package\\yorkpyBBL\\BBLT20-allMatchesAllOpposition"
path=os.path.join(dir1,"Sydney Sixers-allMatchesAllOpposition.csv")
ss_matches = pd.read_csv(path)
yka.plotWinLossByTeamAllOpposition(ss_matches,'Sydney Sixers')

3.9 Big Bash League -Wins vs losses by toss decision (Class 3)

import os
import pandas as pd
import yorkpy.analytics as yka
dir1="C:\\software\\cricket-package\\yorkpyBBL\\BBLT20-allMatchesAllOpposition"
path=os.path.join(dir1,"Adelaide Strikers-allMatchesAllOpposition.csv")
as_matches = pd.read_csv(path)
yka.plotWinsByRunOrWicketsAllOpposition(as_matches,'Adelaide Strikers')

3.10 Big Bash League -Batsmen Analysis (Class 4)

import os
import pandas as pd
import yorkpy.analytics as yka
dir1="C:\\software\\cricket-package\\yorkpyBBL\\BBLT20-BattingBowlingDetails"
# CA Lynn
name="CA Lynn"
team='Brisbane Heat'
df=yka.getBatsmanDetails(team,name,dir=dir1)
yka.batsmanRunsVsStrikeRate(df,name)

# UT Khawaja
name="UT Khawaja"
team='Sydney Thunder'
df=yka.getBatsmanDetails(team,name,dir=dir1)
yka.batsmanRunsAgainstOpposition(df,name)

3.11Big Bash League – Bowler analysis (Class 4)

import os
import pandas as pd
import yorkpy.analytics as yka
dir1="C:\\software\\cricket-package\\yorkpyBBL\\BBLT20-BattingBowlingDetails"
# CJ McKay
name="CJ McKay"
team='Sydney Thunder'
df=yka.getBowlerWicketDetails(team,name,dir=dir1)
yka.bowlerCumulativeAvgWickets(df,name)

# AU Rashid
name="AU Rashid"
team='Adelaide Strikers'
df=yka.getBowlerWicketDetails(team,name,dir=dir1)
yka.bowlerCumulativeAvgEconRate(df,name)

4. Natwest T20 Blast

The following functions for added to handle Natwest T20 teams

  1. saveAllMatchesBetween2NWBTeams()
  2. saveAllMatchesAllOppositionNWBT20

The Natwest teams are
Derbyshire, Durham, Essex, Glamorgan, Gloucestershire, Hampshire, Kent,Lancashire, Leicestershire, Middlesex,Northamptonshire, Nottinghamshire, Somerset, Surrey, Sussex, Warwickshire, Worcestershire,Yorkshire

In order to perform analysis with yorkpy, the YAML data has to be converted to pandas dataframe and saves as CSV as shown

#import os
#import yorkpy.analytics as yka
#os.chdir('C:\\software\\cricket-package\\yorkpyNWB\\nwb')
#1. Convert YAML to dataframes and save as CSV
#yka.convertAllYaml2PandasDataframesT20(".", "..\\NWBT20-Matches")
#2. Save all matches between 2 NWBT20 teams
#dir1='C:\\software\\cricket-package\\yorkpyNWB\\NWBT20-Matches'
#yka.saveAllMatchesBetween2NWBTeams(dir1)
#3. Save all matches between a NWB T20 team and all other teams
#dir1='C:\\software\\cricket-package\\yorkpyNWB\\NWBT20-Matches'
#yka.saveAllMatchesAllOppositionNWBT20(dir1)
#4. Compute the batting details
dir1='C:\\software\\cricket-package\\yorkpyNWB\\NWBT20-Matches'
#yka.getTeamBattingDetails("Derbyshire",dir=dir1, save=True)
#yka.getTeamBattingDetails("Durham",dir=dir1,save=True)
#yka.getTeamBattingDetails("Essex",dir=dir1,save=True)
#..
#5. Compute bowling details
dir1='C:\\software\\cricket-package\\yorkpyNWB\\NWBT20-Matches'
#yka.getTeamBowlingDetails("Derbyshire",dir=dir1, save=True)
#yka.getTeamBowlingDetails("Durham",dir=dir1,save=True)
#yka.getTeamBowlingDetails("Essex",dir=dir1,save=True)
#...

Once the data is converted all yorkpy functions can be used. This has already been done and is available at github NWB

4.1 Natwest T20 Blast – Team score card (Class 1)

import os
import pandas as pd
import yorkpy.analytics as yka
dir1="C:\\software\\cricket-package\\\yorkpyNWB\\NWBT20-Matches"
path=os.path.join(dir1,".\\Durham-Yorkshire-2016-08-20.csv")
d_y=pd.read_csv(path)
scorecard,extras=yka.teamBattingScorecardMatch(d_y,"Durham")
print(scorecard)
##           batsman  runs  balls  4s  6s          SR
## 0     MD Stoneman    25     20   4   0  125.000000
## 1     KK Jennings    11     13   1   0   84.615385
## 2       BA Stokes    56     37   4   3  151.351351
## 3   MJ Richardson    29     23   4   1  126.086957
## 4     JTA Burnham    17     15   1   1  113.333333
## 5      RD Pringle    10      9   1   0  111.111111
## 6  PD Collingwood     2      3   0   0   66.666667
## 7        U Arshad     1      1   0   0  100.000000
print(extras)
##    total  wides  noballs  legbyes  byes  penalty  extras
## 0    305      2        0        5     0        0       7

4.2 Natwest T20 Blast -Team batsmen vs Bowlers (Class 1)

import os
import pandas as pd
import yorkpy.analytics as yka
dir1="C:\\software\\cricket-package\\\yorkpyNWB\\NWBT20-Matches"
path=os.path.join(dir1,".\\Derbyshire-Lancashire-2016-07-13.csv")
d_l=pd.read_csv(path)
yka.teamBatsmenVsBowlersMatch(d_l,'Lancashire','Derbyshire',plot=True)

4.3 Natwest T20 Blast -Team bowling scorecard match (Class 1)

import os
import pandas as pd
import yorkpy.analytics as yka
dir1="C:\\software\\cricket-package\\\yorkpyNWB\\NWBT20-Matches"
path=os.path.join(dir1,".\\Essex-Surrey-2016-05-20.csv")
e_s=pd.read_csv(path)
a=yka.teamBowlingScorecardMatch(e_s,'Essex')
print(a)
##           bowler  overs  runs  maidens  wicket   econrate
## 0  Azhar Mahmood      3    38        0       4  12.666667
## 1       GJ Batty      4    33        0       1   8.250000
## 2       JE Burke      1    18        0       0  18.000000
## 3     MW Pillans      3    28        0       0   9.333333
## 4      SM Curran      4    23        0       2   5.750000
## 5      TK Curran      4    21        0       3   5.250000

4.4 Natwest T20 Blast -Match Worm chart (Class 1)

import os
import pandas as pd
import yorkpy.analytics as yka
dir1="C:\\software\\cricket-package\\\yorkpyNWB\\NWBT20-Matches"
path=os.path.join(dir1,".\\Gloucestershire-Glamorgan-2016-06-10.csv")
ss_ms=pd.read_csv(path)
yka.matchWormChart(ss_ms,"Gloucestershire", "Glamorgan")

path=os.path.join(dir1,".\\Leicestershire-Northamptonshire-2016-05-20.csv")
hh_bh=pd.read_csv(path)
yka.matchWormChart(hh_bh,"Northamptonshire", "Leicestershire")

4.5 Natwest T20 Blast -Team Batting partnerships all matches 2 teams (Class 2)

import os
import pandas as pd
import yorkpy.analytics as yka
dir1="C:\\software\\cricket-package\\yorkpyNWB\\NWBT20-allMatchesBetween2Teams"
path=os.path.join(dir1,"Hampshire-Sussex-allMatches.csv")
h_s_matches = pd.read_csv(path)
yka.teamBatsmenPartnershipOppnAllMatchesChart(h_s_matches,"Hampshire","Sussex",plot=True, top=4, partnershipRuns=10)

4.6 Natwest T20 Blast -Team Bowling wicket kind all matches 2 teams (Class 2)

import os
import pandas as pd
import yorkpy.analytics as yka
dir1="C:\\software\\cricket-package\\yorkpyNWB\\NWBT20-allMatchesBetween2Teams"
path=os.path.join(dir1,"Kent-Somerset-allMatches.csv")
k_s_matches = pd.read_csv(path)
yka.teamBowlersVsBatsmenOppnAllMatches(k_s_matches,'Kent','Somerset',plot=True,
top=5,runsConceded=10)

4.7 Natwest T20 Blast -Team Bowling scorecard all teams (Class 3)

import os
import pandas as pd
import yorkpy.analytics as yka
dir1="C:\\software\\cricket-package\\yorkpyNWB\\NWBT20-allMatchesAllOpposition"
path=os.path.join(dir1,"Middlesex-allMatchesAllOpposition.csv")
m_matches = pd.read_csv(path)
scorecard=yka.teamBowlingScorecardAllOppnAllMatches(m_matches,"Middlesex")
print(scorecard)
##               bowler  overs  runs  maidens  wicket   econrate
## 1             AJ Tye      8    75        0       6   9.375000
## 5         BAC Howell      8    41        0       5   5.125000
## 26         GR Napier      7    65        0       5   9.285714
## 15        DI Stevens      4    31        0       4   7.750000
## 19       DW Lawrence      6    37        0       4   6.166667
## 32       JW Dernbach      4    33        0       3   8.250000
## 7          BTJ Wheal      4    43        0       3  10.750000
## 18         DR Briggs      4    24        0       3   6.000000
## 50     RK Kleinveldt      4    24        0       3   6.000000
## 46         R McLaren      7    59        0       3   8.428571
## 47         R Rampaul      3    21        0       3   7.000000
## 34         L Gregory      6    51        0       2   8.500000
## 33   KMDN Kulasekara      2    24        0       2  12.000000
## 40          MG Hogan      3    17        0       2   5.666667
## 43        MTC Waller      4    31        0       2   7.750000
## 49        RJ Gleeson      4    20        0       2   5.000000
## 48  RE van der Merwe      5    24        0       2   4.800000
## 51  RN ten Doeschate      4    32        0       2   8.000000
## 53        S Prasanna      4    20        0       2   5.000000
## 56           SW Tait      3    17        0       2   5.666667
## 57     Shahid Afridi      8    55        0       2   6.875000
## 59  T van der Gugten      3    13        1       2   4.333333
## 64          TS Mills      3    34        0       2  11.333333
## 65          WAT Beer      4    23        0       2   5.750000
## 31          JH Davey      4    28        0       2   7.000000
## 68         ZS Ansari      3    16        0       2   5.333333
## 25         GM Andrew      3    19        0       2   6.333333
## 23          GJ Batty      6    55        0       2   9.166667
## 16          DJ Bravo      3    27        0       2   9.000000
## 41          MR Quinn      6    65        0       1  10.833333
## ..               ...    ...   ...      ...     ...        ...
## 24     GL van Buuren      7    49        0       1   7.000000
## 37           MD Hunn      3    35        0       1  11.666667
## 36        LC Norwell      6    62        0       1  10.333333
## 29       JC Tredwell      4    35        0       1   8.750000
## 35         LA Dawson      6    53        0       1   8.833333
## 62           TL Best      4    51        0       0  12.750000
## 58         T Westley      2    12        0       0   6.000000
## 4         Azharullah      3    24        0       0   8.000000
## 60     TD Groenewald      1    21        0       0  21.000000
## 61         TK Curran      4    35        0       0   8.750000
## 38         MD Taylor      3    30        0       0  10.000000
## 30        JG Myburgh      1     5        0       0   5.000000
## 8          C Overton      2    18        0       0   9.000000
## 2        Ashar Zaidi      1     5        0       0   5.000000
## 66          WR Smith      2    25        0       0  12.500000
## 28         J Overton      2    24        0       0  12.000000
## 6          BJ Taylor      1     6        0       0   6.000000
## 22          GG White      4    31        0       0   7.750000
## 55          SP Crook      1     9        0       0   9.000000
## 39        ME Claydon      4    40        0       0  10.000000
## 52         RS Bopara      4    32        0       0   8.000000
## 10           CD Nash      2    19        0       0   9.500000
## 11         CH Morris      4    36        0       0   9.000000
## 12         DA Cosker      3    32        0       0  10.666667
## 13      DA Griffiths      4    39        0       0   9.750000
## 45          PD Trego      1    11        0       0  11.000000
## 44   PA van Meekeren      2    19        0       0   9.500000
## 42          MS Crane      2    25        0       0  12.500000
## 20        FK Cowdrey      1    19        0       0  19.000000
## 14        DD Masters      2    16        0       0   8.000000
## 
## [69 rows x 6 columns]

4.8 Natwest T20 Blast -Plot wins vs losses against all teams(Class 3)

import os
import pandas as pd
import yorkpy.analytics as yka
dir1="C:\\software\\cricket-package\\yorkpyNWB\\NWBT20-allMatchesAllOpposition"
path=os.path.join(dir1,"Warwickshire-allMatchesAllOpposition.csv")
w_matches = pd.read_csv(path)
yka.plotWinLossByTeamAllOpposition(w_matches,'Warwickshire')

4.9 Natwest T20 Blast -Batsmen Analysis (Class 4)

import os
import pandas as pd
import yorkpy.analytics as yka
dir1="C:\\software\\cricket-package\\yorkpyNWB\\NWBT20-BattingBowlingDetails"
# M Klinger
name="M Klinger"
team='Gloucestershire'
df=yka.getBatsmanDetails(team,name,dir=dir1)
yka.batsmanRunsAgainstOpposition(df,name)

# CA Ingram
name="CA Ingram"
team='Glamorgan'
df=yka.getBatsmanDetails(team,name,dir=dir1)
yka.batsmanCumulativeStrikeRate(df,name)

4.11 Natwest T20 Blast -Bowler analysis (Class 4)

import os
import pandas as pd
import yorkpy.analytics as yka
dir1="C:\\software\\cricket-package\\yorkpyNWB\\NWBT20-BattingBowlingDetails"
# BAC Howell
name="BAC Howell"
team='Gloucestershire'
df=yka.getBowlerWicketDetails(team,name,dir=dir1)
yka.bowlerCumulativeAvgEconRate(df,name)

# GR Napier
name="GR Napier"
team='Essex'
df=yka.getBowlerWicketDetails(team,name,dir=dir1)
yka.bowlerWicketsVenue(df,name)

Note: yorkpy will work for all T20 leagues which are in YAML format as specified in Cricsheet.

You can clone/fork the latest code for yorkpy from github yorkpy

The data for IPL, Intl. T20, BBL and Natwest T20 have already been converted into pandas dataframes and saved as CSVs. You can download the converted files from Github at [allYorkpyT20Data])(https://github.com/tvganesh/allYorkpyT20Data)

Conclusion This post shows the kind of detailed analysis that can be performed with yorkpy. In fact with all the converted data it should be possible to also train a Machine Learning model, which I will probably keep for another day. You could go ahead and use the data in other innovative ways. Do keep me posted if you do!!

Important note: Do check out my other posts using yorkpy at yorkpy-posts

Have fun with yorkpy!!

See also
1. Take 4+: Presentations on ‘Elements of Neural Networks and Deep Learning’ – Parts 1-8
2. My book ‘Practical Machine Learning in R and Python: Third edition’ on Amazon
3. Hand detection through Haartraining: A hands-on approach
4.My book ‘Deep Learning from first principles:Second Edition’ now on Amazon
5. Introducing QCSimulator: A 5-qubit quantum computing simulator in R
6. The 3rd paperback & kindle editions of my books on Cricket, now on Amazon

To see all posts click Index of posts
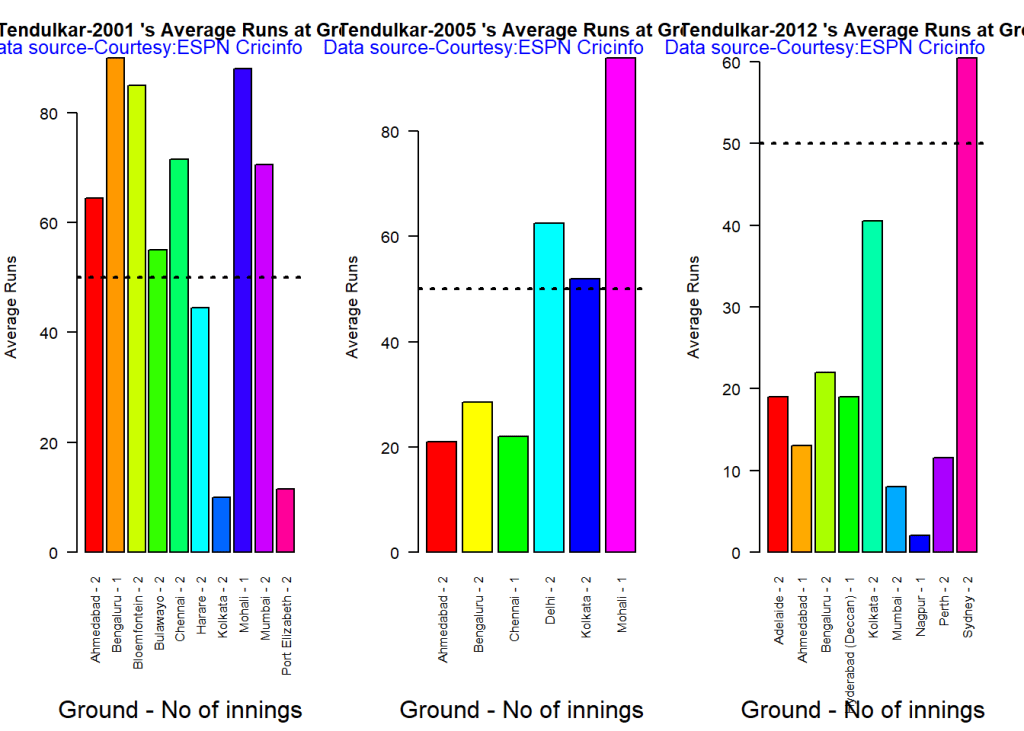
Pitching yorkpy … in the block hole – Part 4

A good programmer is someone who always looks both ways before crossing a one-way street.  Doug Linder

There are two ways to write error-free programs; only the third one works. Alan J. Perlis

In order to understand recursion, one must first understand recursion. Anonymous

This is the fourth and final part of my Python package yorkpy. In this part yorkpy, the python avatar of my R package yorkr see Introducing cricket package yorkr: Part 1- Beaten by sheer pace!, develops wings and is prepared for take-off. The yorkpy package uses data from Cricsheet

You can clone/download the code at Github yorkpy
This post has been published to RPubs at yorkpy-Part4
You can download this post as PDF at IPLT20-yorkpy-part4
You can download all the data used in this post and the previous post at yorkpyData

This post is a continuation of the earlier posts on yorkpy
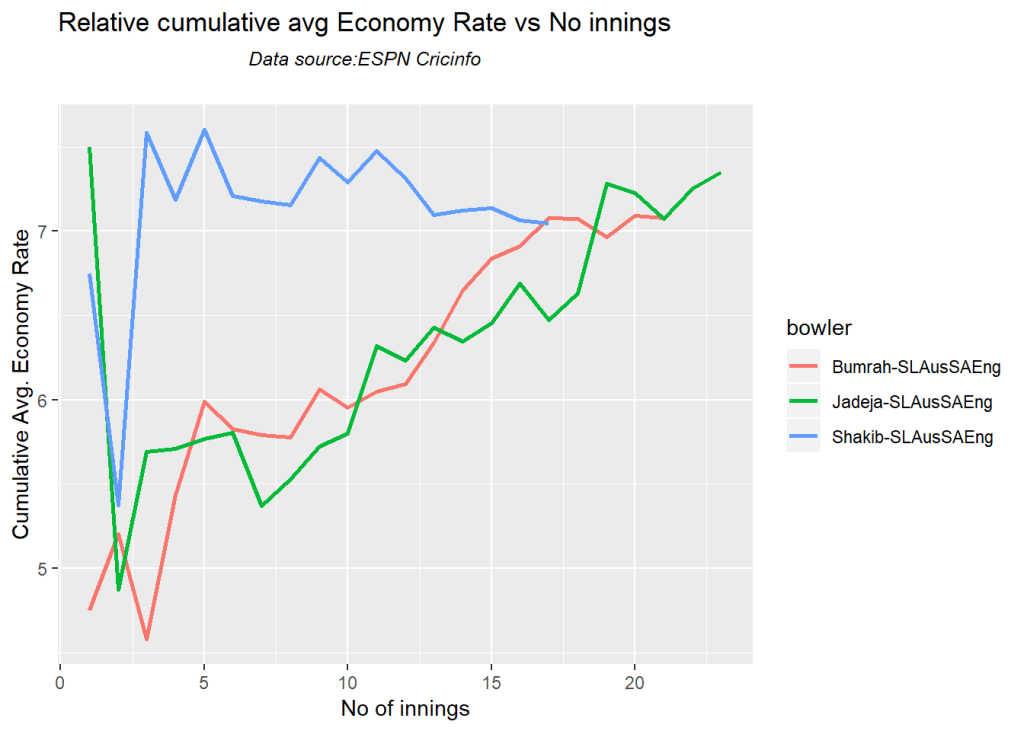
1. Pitching yorkpy . short of good length to IPL – Part 1 In this part I included functions that convert the yaml data of IPL matches into Pandas dataframe which are then saved as CSV. This part can perform analysis of individual IPL matches. Note The converted data is available at yorkpyData
2. Pitching yorkpy.on the middle and outside off-stump to IPL – Part 2 This part included functions to create a large data frame for head-to-head confrontation between any 2IPL teams says CSK-MI, DD-KKR etc, which can be saved as CSV. Analysis is then performed on these team-2-team confrontations. Note The converted data is available at yorkpyData
3. Pitching yorkpy.swinging away from the leg stump to IPL – Part 3 The 3rd part includes the performance of any IPL team against all other IPL teams. The data can also be saved as CSV.Note The converted data is available at yorkpyData

Note: If you would like to do a similar analysis for a different set of batsman and bowlers, you can clone/download my skeleton yorkpy-template from Github (which is the R Markdown file I have used for the analysis below).

This 4th and final part includes analysis of batting and bowling performances of any IPL player. The batting and bowling details for all teams have already been converted and are available at IPLT20-Batting-BowlingDetails

This part includes the following new functions

Batsman functions

  1. batsmanRunsVsDeliveries
  2. batsmanFoursSixes
  3. batsmanDismissals
  4. batsmanRunsVsStrikeRate
  5. batsmanMovingAverage
  6. batsmanCumulativeAverageRuns
  7. batsmanCumulativeStrikeRate
  8. batsmanRunsAgainstOpposition
  9. batsmanRunsVenue

Bowler functions

  1. bowlerMeanEconomyRate
  2. bowlerMeanRunsConceded
  3. bowlerMovingAverage
  4. bowlerCumulativeAvgWickets
  5. bowlerCumulativeAvgEconRate
  6. bowlerWicketPlot
  7. bowlerWicketsAgainstOpposition
  8. bowlerWicketsVenue

A. Batsman functions

1. Get IPL Team Batting details

The function below gets the overall IPL team batting details based on the CSV files that were saved for IPL T20 matches. This is currently also available in Github at yorkpyData. The batting details of the IPL team in each match is created and a huge data frame is created by combining the batting details from each match. This can be saved as a csv file with name as for e.g. Delhi Daredevils-BattingDetails.csv.

dir1= "C:\\software\\cricket-package\\yorkpyIPLData\\data3"
#csk_details = yka.getTeamBattingDetails("Chennai Super Kings",dir=dir1, save=True)
#dd_details = yka.getTeamBattingDetails("Delhi Daredevils",dir=dir1,save=True)
#kkr_details = yka.getTeamBattingDetails("Kolkata Knight Riders",dir=dir1,save=True)

2. Get IPL batsman details

This function is used to get the individual IPL T20 batting record for a the specified batsman of the team as in the functions below.

For the batsmen functions below I have chosen Rishabh Pant, Kane Williamson and Ambati Rayudu for the analysis as they top the batting lists. You can choose any IPL batsmen for the analysis

import pandas as pd
import os
import yorkpy.analytics as yka
dir1= "C:\\software\\cricket-package\\yorkpyIPLData\\data3"
# 1. Rishabh Pant
name="RR Pant"
team='Delhi Daredevils'
rpant=yka.getBatsmanDetails(team,name,dir=dir1)

3 Batsman Runs vs Deliveries (in IPL matches)

This functions plots the runs vs deliveries faced for batsman

import pandas as pd
import os
import yorkpy.analytics as yka
dir1= "C:\\software\\cricket-package\\yorkpyIPLData\\data3"
# 1. Rishabh Pant
name="RR Pant"
team='Delhi Daredevils'
df=yka.getBatsmanDetails(team,name,dir=dir1)
yka.batsmanRunsVsDeliveries(df,name)

# 2. Kane Williamson
dir1= "C:\\software\\cricket-package\\yorkpyIPLData\\data3"
name="KS Williamson"
team='Sunrisers Hyderabad'
df=yka.getBatsmanDetails(team,name,dir=dir1)
yka.batsmanRunsVsDeliveries(df,name)

#3. Ambati Rayudu
name="AT Rayudu"
team='Mumbai Indians'
df=yka.getBatsmanDetails(team,name,dir=dir1)
yka.batsmanRunsVsDeliveries(df,name)

4. Batsman fours and sixes (in IPL matches)

This plots the fours, sixes and the total runs for a batsman

import pandas as pd
import os
import yorkpy.analytics as yka
dir1= "C:\\software\\cricket-package\\yorkpyIPLData\\data3"
# 1. Rishabh Pant
name="RR Pant"
team='Delhi Daredevils'
df=yka.getBatsmanDetails(team,name,dir=dir1)
yka.batsmanFoursSixes(df,name)


# 2. Kane Williamson
dir1= "C:\\software\\cricket-package\\yorkpyIPLData\\data3"
name="KS Williamson"
team='Sunrisers Hyderabad'
df=yka.getBatsmanDetails(team,name,dir=dir1)
yka.batsmanFoursSixes(df,name)

#3. Ambati Rayudu
name="AT Rayudu"
team='Mumbai Indians'
df=yka.getBatsmanDetails(team,name,dir=dir1)
yka.batsmanFoursSixes(df,name)

5. Batsman dismissals (in IPL matches)

import pandas as pd
import os
import yorkpy.analytics as yka
dir1= "C:\\software\\cricket-package\\yorkpyIPLData\\data3"
# 1. Rishabh Pant
name="RR Pant"
team='Delhi Daredevils'
df=yka.getBatsmanDetails(team,name,dir=dir1)
yka.batsmanDismissals(df,name)

# 2. Kane Williamson
dir1= "C:\\software\\cricket-package\\yorkpyIPLData\\data3"
name="KS Williamson"
team='Sunrisers Hyderabad'
df=yka.getBatsmanDetails(team,name,dir=dir1)
yka.batsmanDismissals(df,name)

#3. Ambati Rayudu
name="AT Rayudu"
team='Mumbai Indians'
df=yka.getBatsmanDetails(team,name,dir=dir1)
yka.batsmanDismissals(df,name)

6. Batsman Runs vs Strike Rate (in IPL matches)

The plots below give the Runs vs Strike rate for batsmen

import pandas as pd
import os
import yorkpy.analytics as yka
dir1= "C:\\software\\cricket-package\\yorkpyIPLData\\data3"
# 1. Rishabh Pant
name="RR Pant"
team='Delhi Daredevils'
df=yka.getBatsmanDetails(team,name,dir=dir1)
yka.batsmanRunsVsStrikeRate(df,name)

# 2. Kane Williamson
dir1= "C:\\software\\cricket-package\\yorkpyIPLData\\data3"
name="KS Williamson"
team='Sunrisers Hyderabad'
df=yka.getBatsmanDetails(team,name,dir=dir1)
yka.batsmanRunsVsStrikeRate(df,name)

#3. Ambati Rayudu
name="AT Rayudu"
team='Mumbai Indians'
df=yka.getBatsmanDetails(team,name,dir=dir1)
yka.batsmanRunsVsStrikeRate(df,name)

7. Batsman Moving average of runs (in IPL matches)

The plots below compute and plot the moving average of batsmen

import pandas as pd
import os
import yorkpy.analytics as yka
dir1= "C:\\software\\cricket-package\\yorkpyIPLData\\data3"
# 1. Rishabh Pant
name="RR Pant"
team='Delhi Daredevils'
df=yka.getBatsmanDetails(team,name,dir=dir1)
yka.batsmanMovingAverage(df,name)

# 2. Kane Williamson
dir1= "C:\\software\\cricket-package\\yorkpyIPLData\\data3"
name="KS Williamson"
team='Sunrisers Hyderabad'
df=yka.getBatsmanDetails(team,name,dir=dir1)
yka.batsmanMovingAverage(df,name)

#3. Ambati Rayudu
name="AT Rayudu"
team='Mumbai Indians'
df=yka.getBatsmanDetails(team,name,dir=dir1)
yka.batsmanMovingAverage(df,name)

8. Batsman Cumulative average of runs (in IPL matches)

The functions below plot the cumulative average of the batsmen

import pandas as pd
import os
import yorkpy.analytics as yka
dir1= "C:\\software\\cricket-package\\yorkpyIPLData\\data3"
# 1. Rishabh Pant
name="RR Pant"
team='Delhi Daredevils'
df=yka.getBatsmanDetails(team,name,dir=dir1)
yka.batsmanCumulativeAverageRuns(df,name)

# 2. Kane Williamson
dir1= "C:\\software\\cricket-package\\yorkpyIPLData\\data3"
name="KS Williamson"
team='Sunrisers Hyderabad'
df=yka.getBatsmanDetails(team,name,dir=dir1)
yka.batsmanCumulativeAverageRuns(df,name)

#3. Ambati Rayudu
name="AT Rayudu"
team='Mumbai Indians'
df=yka.getBatsmanDetails(team,name,dir=dir1)
yka.batsmanCumulativeAverageRuns(df,name)

9. Batsman Cumulative Strike Rate (in IPL matches)

The functions below plot the cumulative strike rate of the batsmen

import pandas as pd
import os
import yorkpy.analytics as yka
dir1= "C:\\software\\cricket-package\\yorkpyIPLData\\data3"
# 1. Rishabh Pant
name="RR Pant"
team='Delhi Daredevils'
df=yka.getBatsmanDetails(team,name,dir=dir1)
yka.batsmanCumulativeStrikeRate(df,name)

# 2. Kane Williamson
dir1= "C:\\software\\cricket-package\\yorkpyIPLData\\data3"
name="KS Williamson"
team='Sunrisers Hyderabad'
df=yka.getBatsmanDetails(team,name,dir=dir1)
yka.batsmanCumulativeStrikeRate(df,name)

#3. Ambati Rayudu
name="AT Rayudu"
team='Mumbai Indians'
df=yka.getBatsmanDetails(team,name,dir=dir1)
yka.batsmanCumulativeStrikeRate(df,name)

10. Batsman performance against opposition (in IPL matches)

The plots below show how the batsmen performed against other IPL teams

import pandas as pd
import os
import yorkpy.analytics as yka
dir1= "C:\\software\\cricket-package\\yorkpyIPLData\\data3"
# 1. Rishabh Pant
name="RR Pant"
team='Delhi Daredevils'
df=yka.getBatsmanDetails(team,name,dir=dir1)
yka.batsmanRunsAgainstOpposition(df,name)

# 2. Kane Williamson
dir1= "C:\\software\\cricket-package\\yorkpyIPLData\\data3"
name="KS Williamson"
team='Sunrisers Hyderabad'
df=yka.getBatsmanDetails(team,name,dir=dir1)
yka.batsmanRunsAgainstOpposition(df,name)

#3. Ambati Rayudu
name="AT Rayudu"
team='Mumbai Indians'
df=yka.getBatsmanDetails(team,name,dir=dir1)
yka.batsmanRunsAgainstOpposition(df,name)

11. Batsman performance at different venues (in IPL matches)

The plots below show how the batsmen performed at different venues

import pandas as pd
import os
import yorkpy.analytics as yka
dir1= "C:\\software\\cricket-package\\yorkpyIPLData\\data3"
# 1. Rishabh Pant
name="RR Pant"
team='Delhi Daredevils'
df=yka.getBatsmanDetails(team,name,dir=dir1)
yka.batsmanRunsVenue(df,name)

# 2. Kane Williamson
dir1= "C:\\software\\cricket-package\\yorkpyIPLData\\data3"
name="KS Williamson"
team='Sunrisers Hyderabad'
df=yka.getBatsmanDetails(team,name,dir=dir1)
yka.batsmanRunsVenue(df,name)

#3. Ambati Rayudu
name="AT Rayudu"
team='Mumbai Indians'
df=yka.getBatsmanDetails(team,name,dir=dir1)
yka.batsmanRunsVenue(df,name)

B. Bowler functions

12. Get bowling details in IPL matches

The function below gets the overall team IPL T20 bowling details based on the RData file available in IPL T20 matches. This is currently also available in Github at yorkpyData. The IPL T20 bowling details of the IPL team in each match is created, and a huge data frame is created by stacking the individual dataframes. This can be saved as a CSV file for e.g. Chennai Super Kings-BowlingDetails.csv

dir1= "C:\\software\\cricket-package\\yorkpyIPLData\\data3"
#kkr_bowling = yka.getTeamBowlingDetails("Kolkata Knight Riders",dir=dir1,save=True)
#csk_bowling = yka.getTeamBowlingDetails("Chennai Super Kings",dir=dir1,save=True)
#kxip_bowling = yka.getTeamBowlingDetails("Kings XI Punjab",dir=dir1,save=True)

13. Get bowling details of the individual IPL bowlers

This function is used to get the individual bowling record for a specified bowler of the country as in the functions below.

The plots below deal with bowler’s performance. For this analysis I have chosen Amit Mishra, Piyush Chawla and Bhuvaneshwar Kumar for the analysis. You can chose any other IPL bowler

import pandas as pd
import os
import yorkpy.analytics as yka
dir1= "C:\\software\\cricket-package\\yorkpyIPLData\\data3"
# 1. Amit Mishra
name="A Mishra"
team='Delhi Daredevils'
#df=yka.getBowlerWicketDetails(team,name,dir=dir1)

14. Bowler Economy Rate (in IPL matches)

The plots below show the economy rate of the selected bowlers

import pandas as pd
import os
import yorkpy.analytics as yka
dir1= "C:\\software\\cricket-package\\yorkpyIPLData\\data3"
# 1. Amit Mishra
name="A Mishra"
team='Delhi Daredevils'
df=yka.getBowlerWicketDetails(team,name,dir=dir1)
yka.bowlerMeanEconomyRate(df,name)

# 2. Piyush Chawla
dir1= "C:\\software\\cricket-package\\yorkpyIPLData\\data3"
name="PP Chawla"
team='Kolkata Knight Riders'
df=yka.getBowlerWicketDetails(team,name,dir=dir1)
yka.bowlerMeanEconomyRate(df,name)

#3. Bhuvneshwar Kumar
name="B Kumar"
team='Sunrisers Hyderabad'
df=yka.getBowlerWicketDetails(team,name,dir=dir1)
yka.bowlerMeanEconomyRate(df,name)

15. Bowler Mean Runs conceded (in IPL matches)

The plots below show the mean runs conceded by the selected bowlers

import pandas as pd
import os
import yorkpy.analytics as yka
dir1= "C:\\software\\cricket-package\\yorkpyIPLData\\data3"
# 1. Amit Mishra
name="A Mishra"
team='Delhi Daredevils'
df=yka.getBowlerWicketDetails(team,name,dir=dir1)
yka.bowlerMeanRunsConceded(df,name)

# 2. Piyush Chawla
dir1= "C:\\software\\cricket-package\\yorkpyIPLData\\data3"
name="PP Chawla"
team='Kolkata Knight Riders'
df=yka.getBowlerWicketDetails(team,name,dir=dir1)
yka.bowlerMeanRunsConceded(df,name)

#3. Bhuvneshwar Kumar
name="B Kumar"
team='Sunrisers Hyderabad'
df=yka.getBowlerWicketDetails(team,name,dir=dir1)
yka.bowlerMeanRunsConceded(df,name)

16. Moving average of wickets for bowler (in IPL matches)

The moving average of the bowlers are plotted below

import pandas as pd
import os
import yorkpy.analytics as yka
dir1= "C:\\software\\cricket-package\\yorkpyIPLData\\data3"
# 1. Amit Mishra
name="A Mishra"
team='Delhi Daredevils'
df=yka.getBowlerWicketDetails(team,name,dir=dir1)
yka.bowlerMovingAverage(df,name)

# 2. Piyush Chawla
dir1= "C:\\software\\cricket-package\\yorkpyIPLData\\data3"
name="PP Chawla"
team='Kolkata Knight Riders'
df=yka.getBowlerWicketDetails(team,name,dir=dir1)
yka.bowlerMovingAverage(df,name)

#3. Bhuvneshwar Kumar
name="B Kumar"
team='Sunrisers Hyderabad'
df=yka.getBowlerWicketDetails(team,name,dir=dir1)
yka.bowlerMovingAverage(df,name)

17. Cumulative average wickets for bowler (in IPL matches)

The cumulative average wickets for each bowler is computed and plotted

import pandas as pd
import os
import yorkpy.analytics as yka
dir1= "C:\\software\\cricket-package\\yorkpyIPLData\\data3"
# 1. Amit Mishra
name="A Mishra"
team='Delhi Daredevils'
df=yka.getBowlerWicketDetails(team,name,dir=dir1)
yka.bowlerCumulativeAvgWickets(df,name)

# 2. Piyush Chawla
dir1= "C:\\software\\cricket-package\\yorkpyIPLData\\data3"
name="PP Chawla"
team='Kolkata Knight Riders'
df=yka.getBowlerWicketDetails(team,name,dir=dir1)
yka.bowlerCumulativeAvgWickets(df,name)

#3. Bhuvneshwar Kumar
name="B Kumar"
team='Sunrisers Hyderabad'
df=yka.getBowlerWicketDetails(team,name,dir=dir1)
yka.bowlerCumulativeAvgWickets(df,name)

18. Cumulative average economy rate for bowler (in IPL matches)

The plots below give the cumulative average economy rate for each bowler

import pandas as pd
import os
import yorkpy.analytics as yka
dir1= "C:\\software\\cricket-package\\yorkpyIPLData\\data3"
# 1. Amit Mishra
name="A Mishra"
team='Delhi Daredevils'
df=yka.getBowlerWicketDetails(team,name,dir=dir1)
yka.bowlerCumulativeAvgEconRate(df,name)

# 2. Piyush Chawla
dir1= "C:\\software\\cricket-package\\yorkpyIPLData\\data3"
name="PP Chawla"
team='Kolkata Knight Riders'
df=yka.getBowlerWicketDetails(team,name,dir=dir1)
yka.bowlerCumulativeAvgEconRate(df,name)

#3. Bhuvneshwar Kumar
name="B Kumar"
team='Sunrisers Hyderabad'
df=yka.getBowlerWicketDetails(team,name,dir=dir1)
yka.bowlerCumulativeAvgEconRate(df,name)

19. Bowler wicket plot (in IPL matches)

The plots below give the over vs wickets for bowlers

import pandas as pd
import os
import yorkpy.analytics as yka
dir1= "C:\\software\\cricket-package\\yorkpyIPLData\\data3"
# 1. Amit Mishra
name="A Mishra"
team='Delhi Daredevils'
df=yka.getBowlerWicketDetails(team,name,dir=dir1)
yka.bowlerWicketPlot(df,name)

# 2. Piyush Chawla
dir1= "C:\\software\\cricket-package\\yorkpyIPLData\\data3"
name="PP Chawla"
team='Kolkata Knight Riders'
df=yka.getBowlerWicketDetails(team,name,dir=dir1)
yka.bowlerWicketPlot(df,name)

#3. Bhuvneshwar Kumar
name="B Kumar"
team='Sunrisers Hyderabad'
df=yka.getBowlerWicketDetails(team,name,dir=dir1)
yka.bowlerWicketPlot(df,name)

20. Bowler wicket against opposition (in IPL matches)

The performance of the bowlers against different IPL teams is shown below

import pandas as pd
import os
import yorkpy.analytics as yka
dir1= "C:\\software\\cricket-package\\yorkpyIPLData\\data3"
# 1. Amit Mishra
name="A Mishra"
team='Delhi Daredevils'
df=yka.getBowlerWicketDetails(team,name,dir=dir1)
yka.bowlerWicketsAgainstOpposition(df,name)

# 2. Piyush Chawla
dir1= "C:\\software\\cricket-package\\yorkpyIPLData\\data3"
name="PP Chawla"
team='Kolkata Knight Riders'
df=yka.getBowlerWicketDetails(team,name,dir=dir1)
yka.bowlerWicketsAgainstOpposition(df,name)

#3. Bhuvneshwar Kumar
name="B Kumar"
team='Sunrisers Hyderabad'
df=yka.getBowlerWicketDetails(team,name,dir=dir1)
yka.bowlerWicketsAgainstOpposition(df,name)

21. Bowler wicket in different venues (in IPL matches)

The plots below show how the bowlers perform at different venues

import pandas as pd
import os
import yorkpy.analytics as yka
dir1= "C:\\software\\cricket-package\\yorkpyIPLData\\data3"
# 1. Amit Mishra
name="A Mishra"
team='Delhi Daredevils'
df=yka.getBowlerWicketDetails(team,name,dir=dir1)
yka.bowlerWicketsVenue(df,name)

# 2. Piyush Chawla
dir1= "C:\\software\\cricket-package\\yorkpyIPLData\\data3"
name="PP Chawla"
team='Kolkata Knight Riders'
df=yka.getBowlerWicketDetails(team,name,dir=dir1)
yka.bowlerWicketsVenue(df,name)

#3. Bhuvneshwar Kumar
name="B Kumar"
team='Sunrisers Hyderabad'
df=yka.getBowlerWicketDetails(team,name,dir=dir1)
yka.bowlerWicketsVenue(df,name)

Note:You can clone/download the code at Github yorkpy

Important note: Do check out my other posts using yorkpy at yorkpy-posts
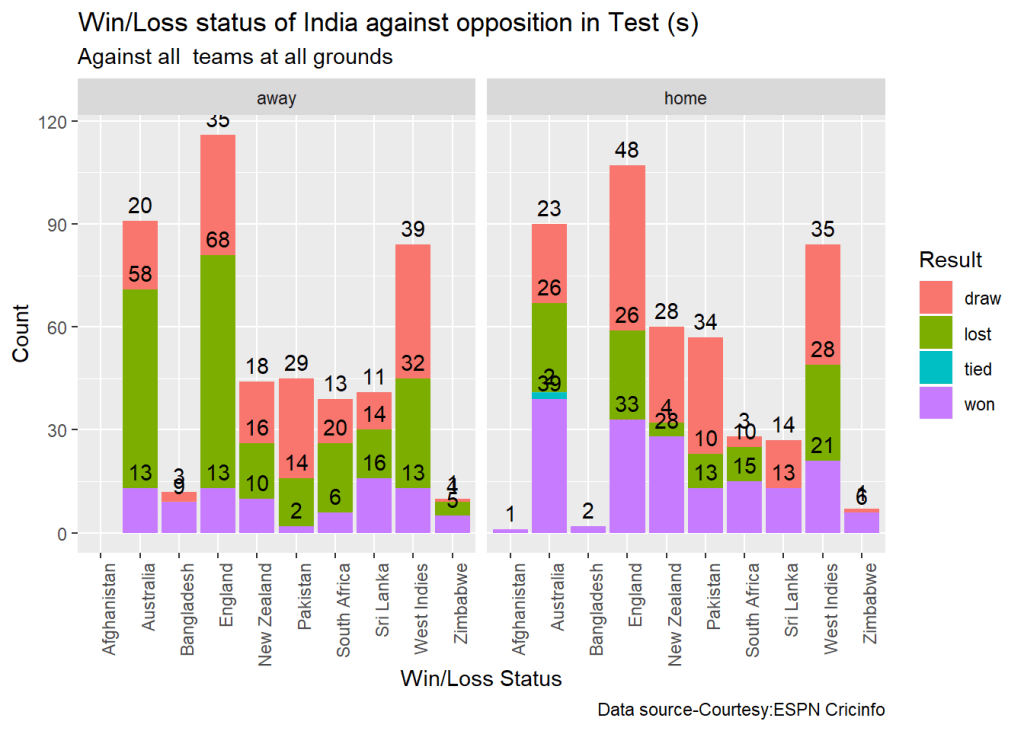
Conclusion: This concludes the python package yorkpy. Go ahead and give yorkpy a spin!

Also see
1. Take 4+: Presentations on ‘Elements of Neural Networks and Deep Learning’ – Parts 1-8
2. My book ‘Practical Machine Learning in R and Python: Third edition’ on Amazon
3. Hand detection through Haartraining: A hands-on approach
4.My book ‘Deep Learning from first principles:Second Edition’ now on Amazon
5. Big Data-1: Move into the big league:Graduate from Python to Pyspark
6. Cricpy takes a swing at the ODIs

To see all posts click Index of posts