It is carnival time again as IPL 2023 is underway!! The new GooglyPlusPlus now includes AI/ML models for computing ball-by-ball Win Probability of matches and each individual player’s Win Probability Contribution (WPC). GooglyPlusPlus uses 2 ML models
- Deep Learning (Tensorflow) – accuracy : 0.8584
- Logistic Regression (glmnet-tidymodels) : 0.728
Besides, as before, GooglyPlusPlus will also include the usual near real-time analytics with the Shiny app being automatically updated with the previous day’s match data.
Note: The Win Probability Computation can also be done on a live feed of streaming data. Since, I don’t have access to live feeds, the app will show how Win Probability changed during the course of completed matches. For more details on Win Probability and Win Probability Contribution see my posts
- Boosting Win Probability accuracy with player embeddings
- GooglyPlusPlus: Win Probability using Deep Learning and player embeddings
- GooglyPlusPlus: Computing T20 player’s Win Probability Contribution
GooglyPlusPlus has been also updated with all the latest T20 league’s match data. It includes data from BBL 2022, NTB 2022, CPL 2022, PSL 2023, ICC T20 2022 and now IPL 2023.
GooglyPlusPlus has the following functionality
- Batsman tab: For detailed analysis of batsmen
- Bowler tab: For detailed analysis of bowlers
- Match tab: Analysis of individual matches, plot of Runs vs SR, Wickets vs ER in power play, middle and death overs, Win Probability Analysis of teams and Win Probability Contribution of players
- Head-to-head tab: Detailed analysis of team-vs-team batting/bowling scorecard, batting, bowling performances, performances in power play, middle and death overs
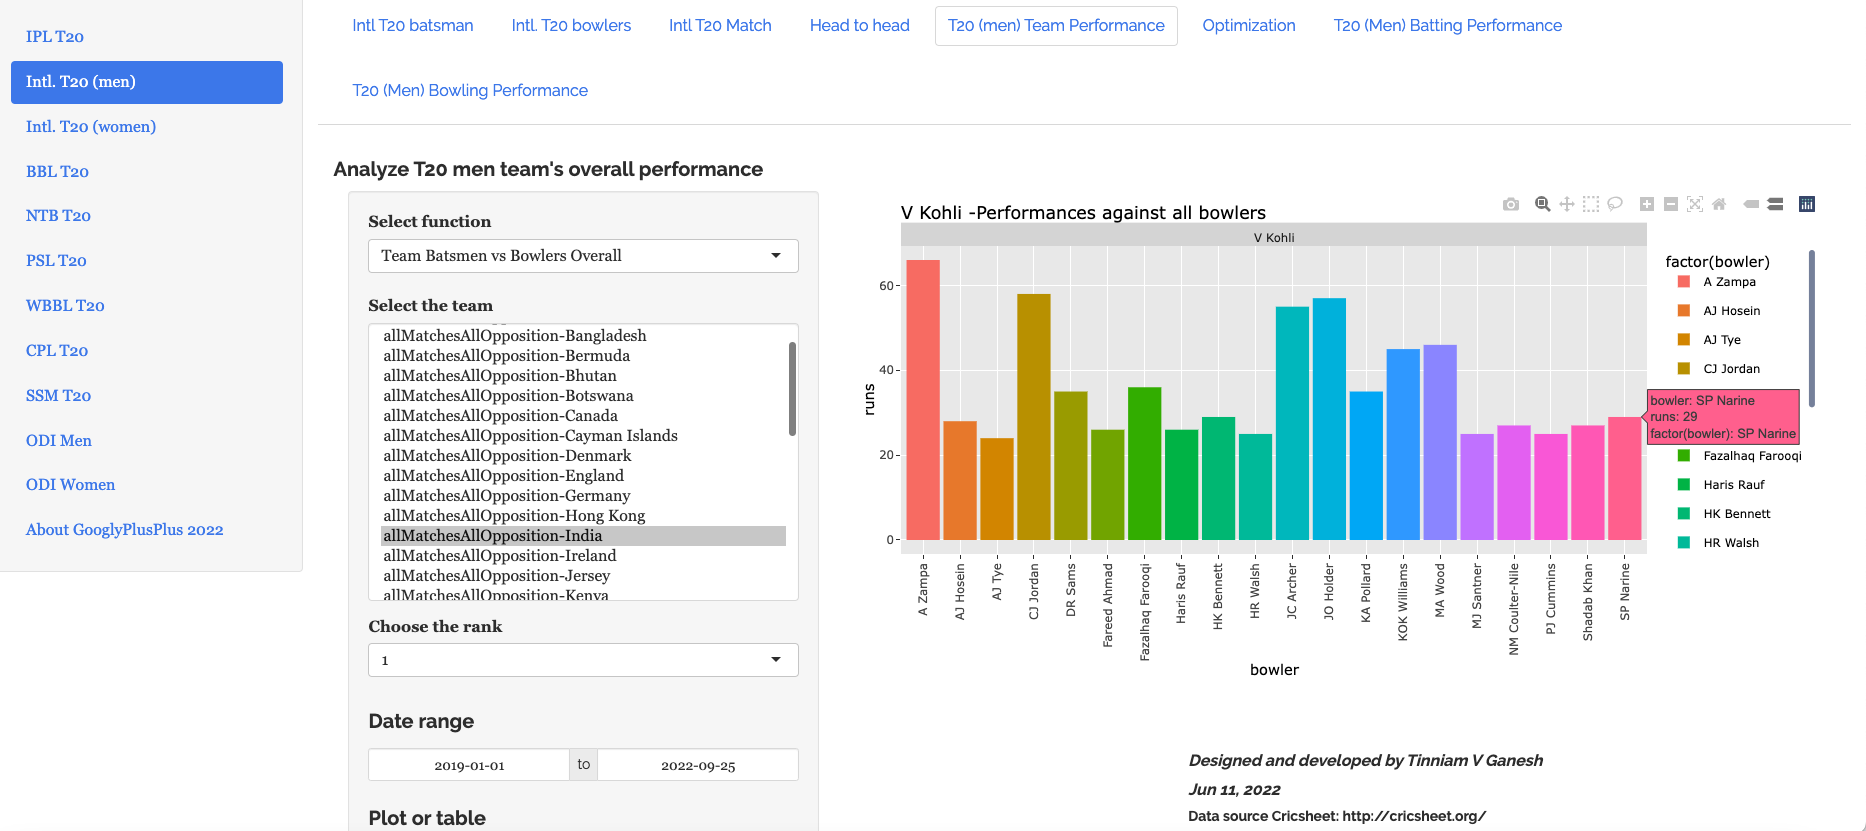
- Team performance tab: Analysis of team-vs-all other teams with batting /bowling scorecard, batting, bowling performances, performances in power play, middle and death overs
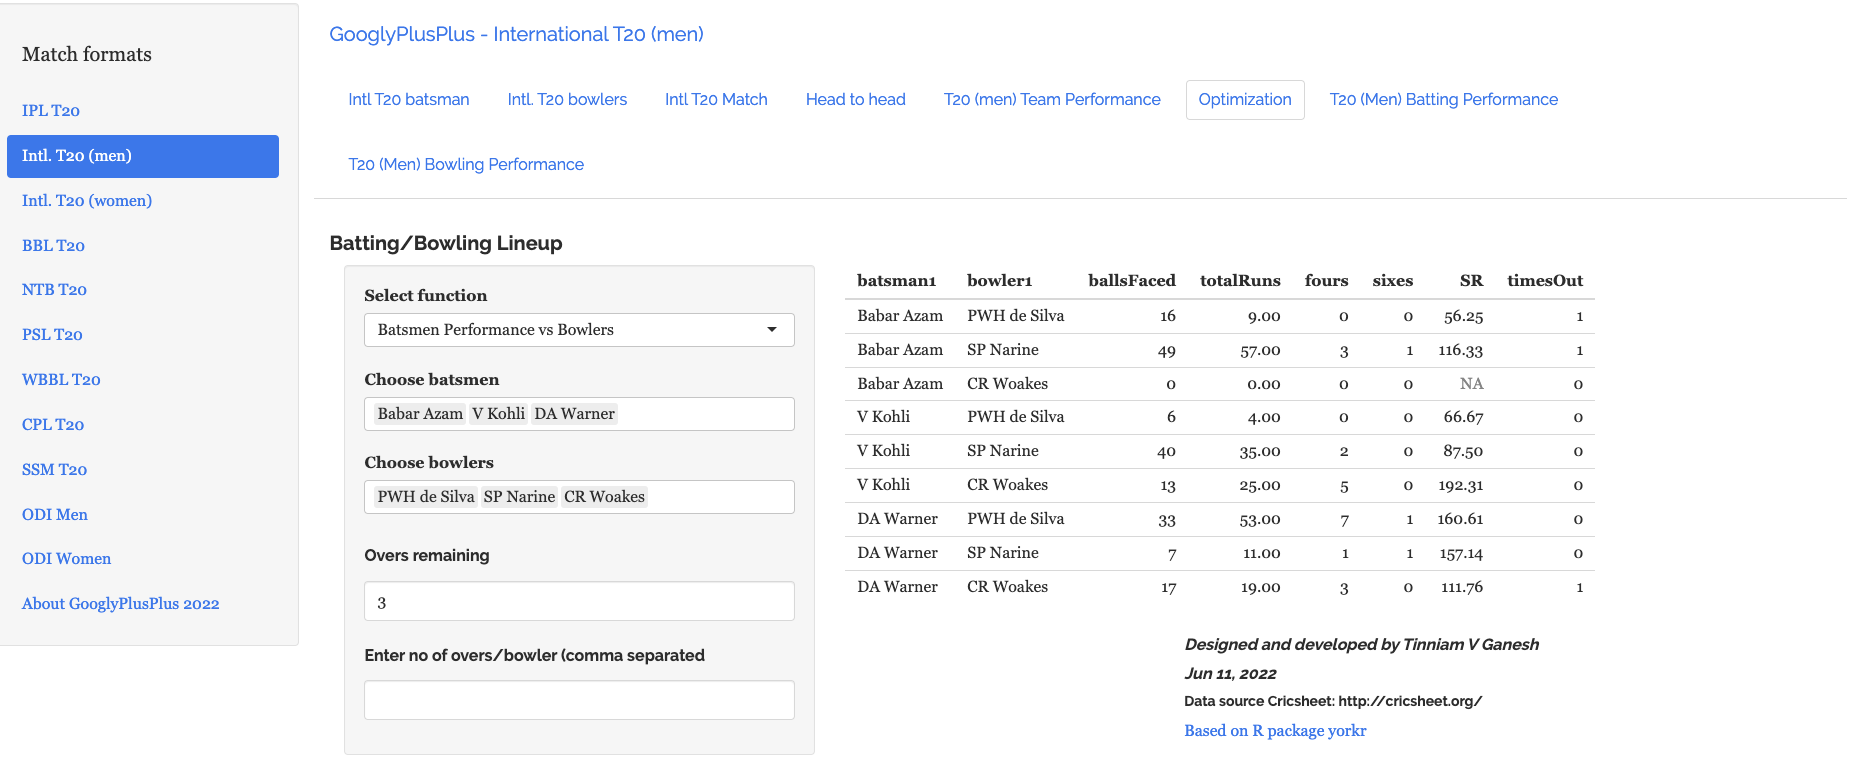
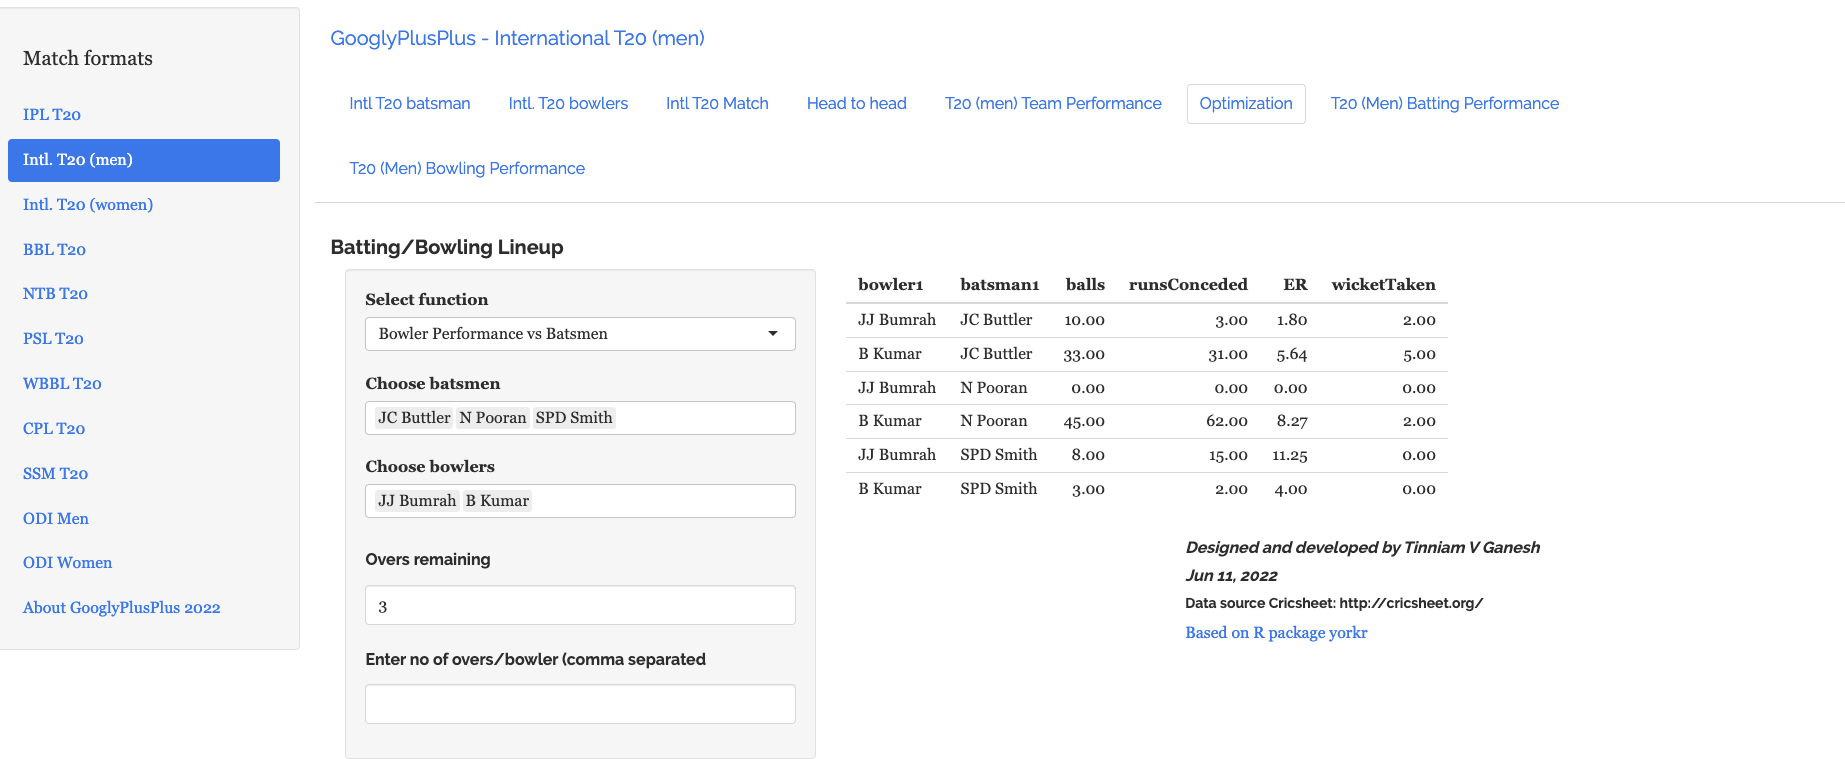
- Optimisation tab: Allows one to pit batsmen vs bowlers and vice-versa. This tab also uses integer programming to optimise batting and bowling lineup
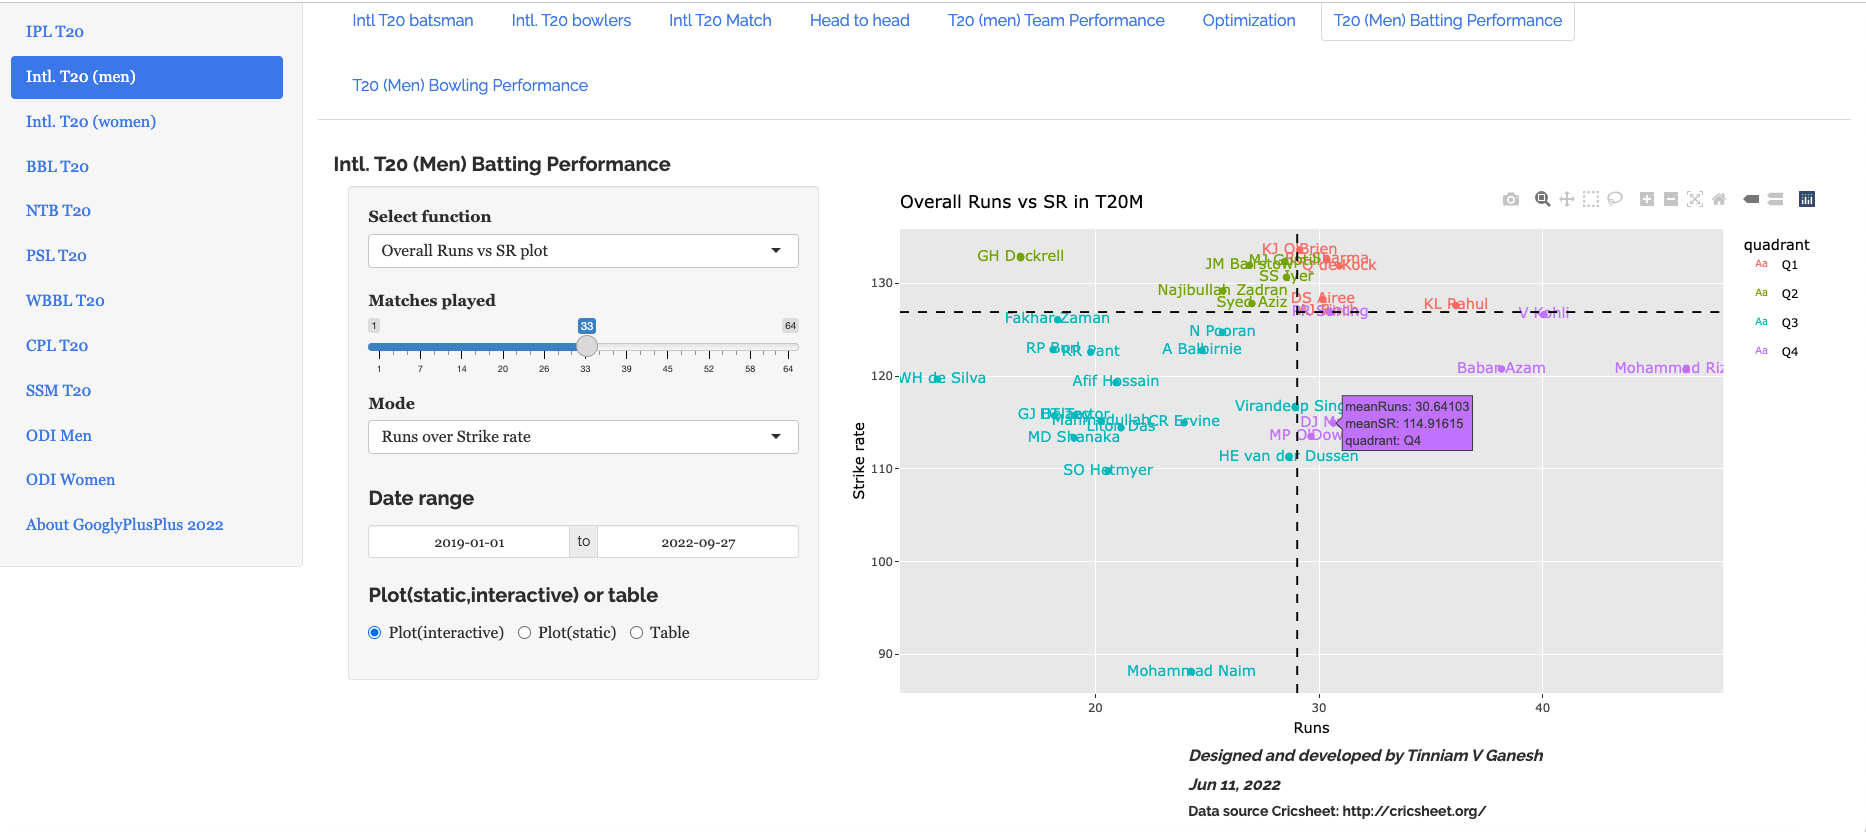
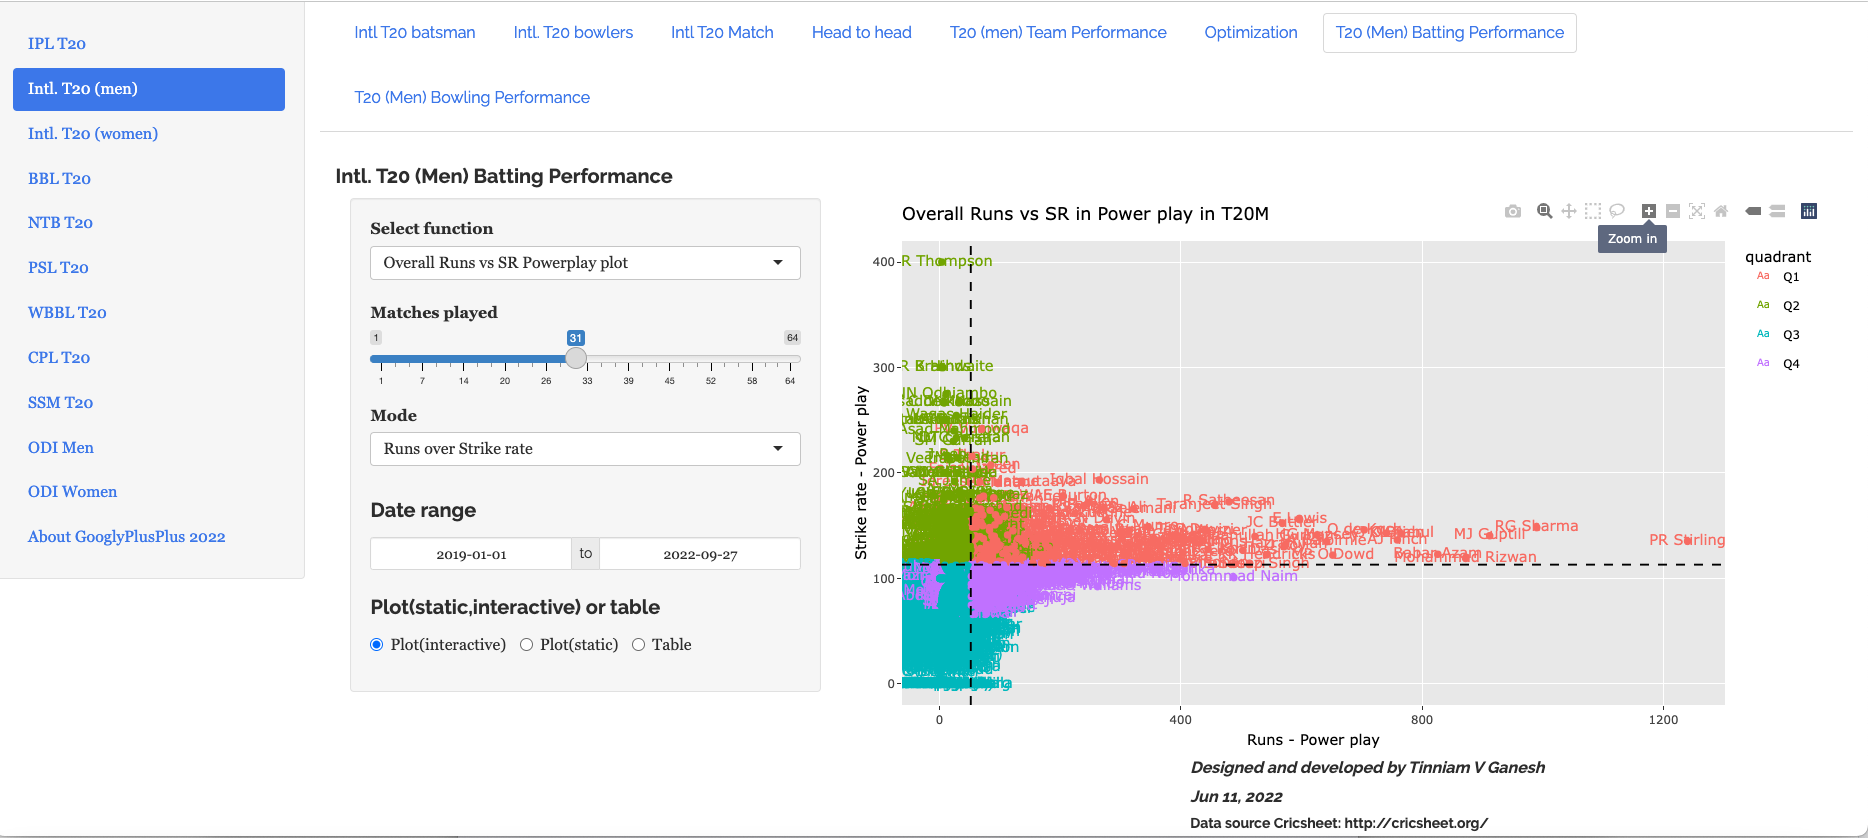
- Batting analysis tab: Ranks batsmen using Runs or SR. Also plots performances of batsmen in power play, middle and death overs and plots them in a 4×4 grid
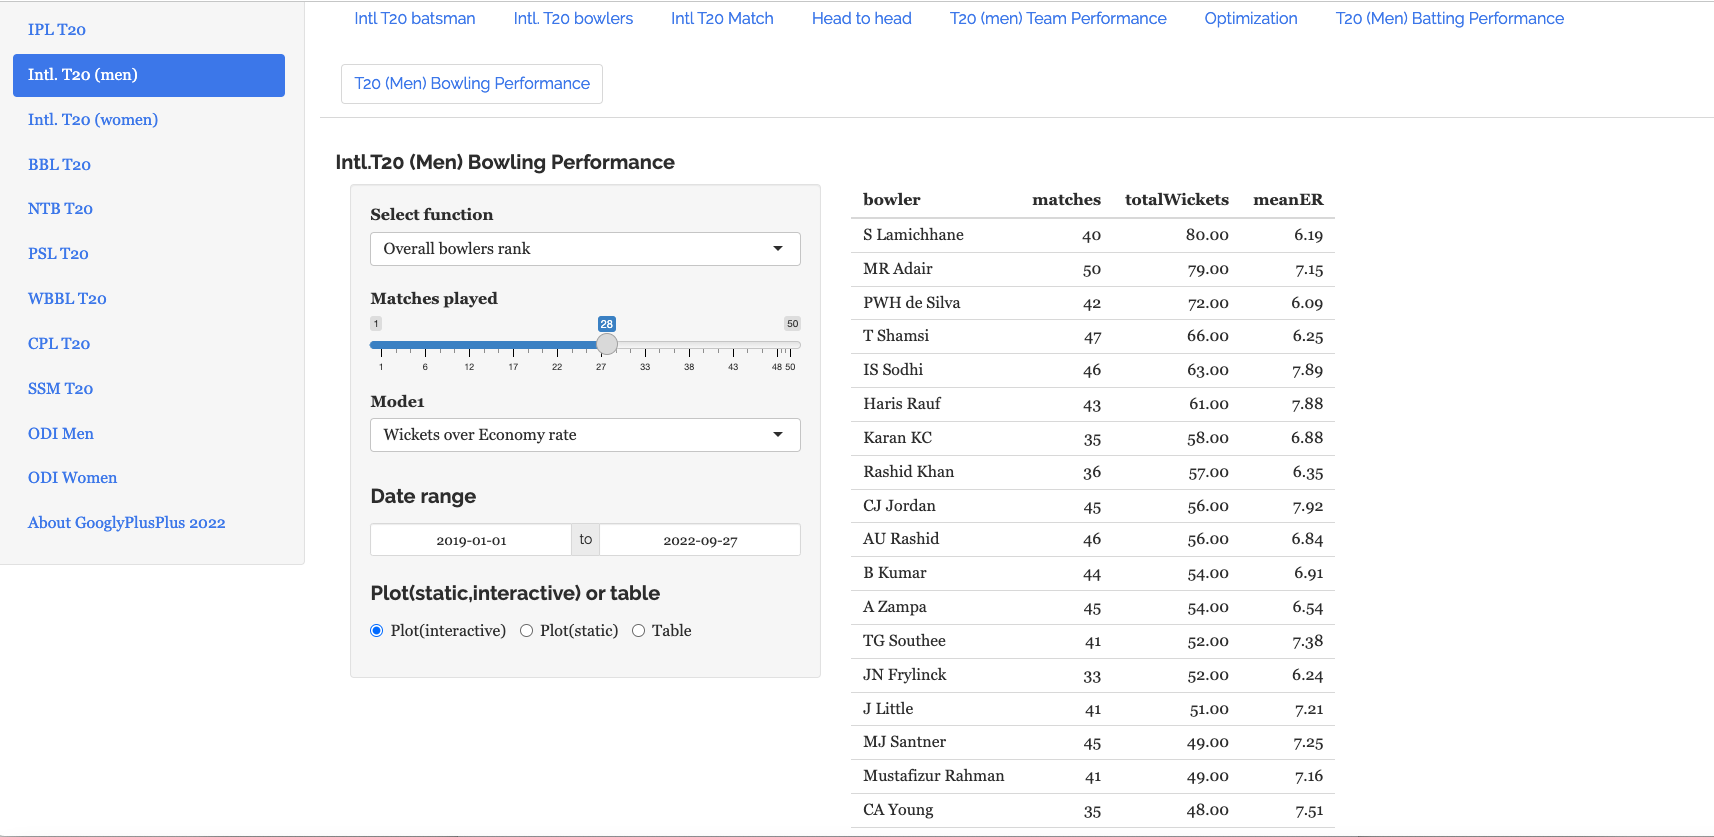
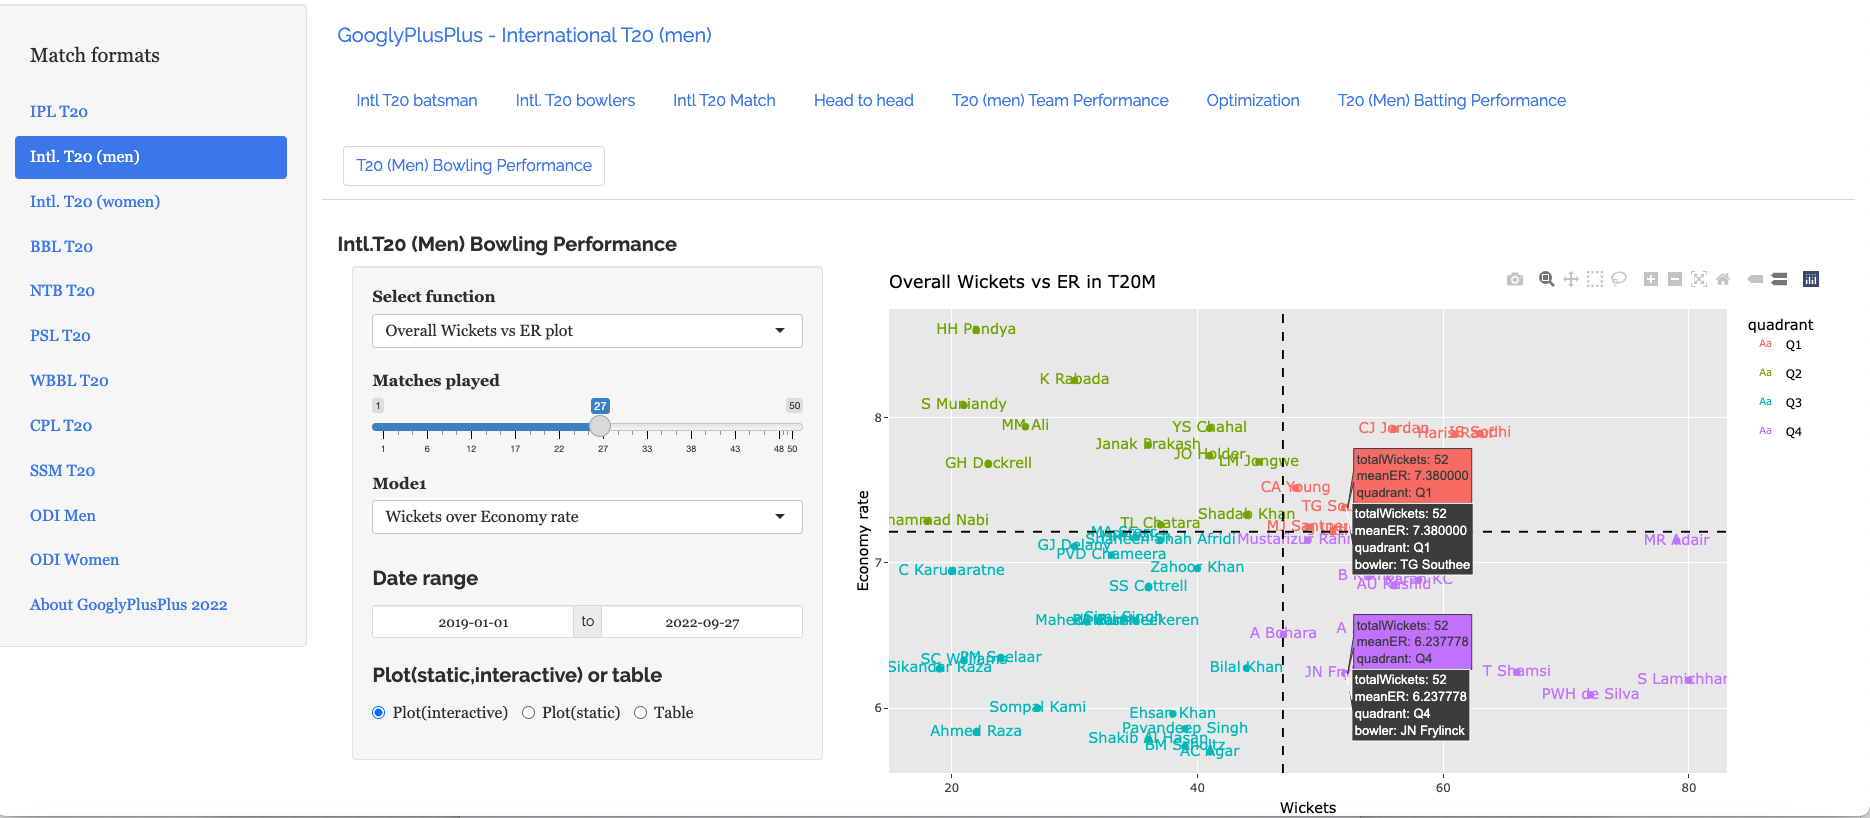
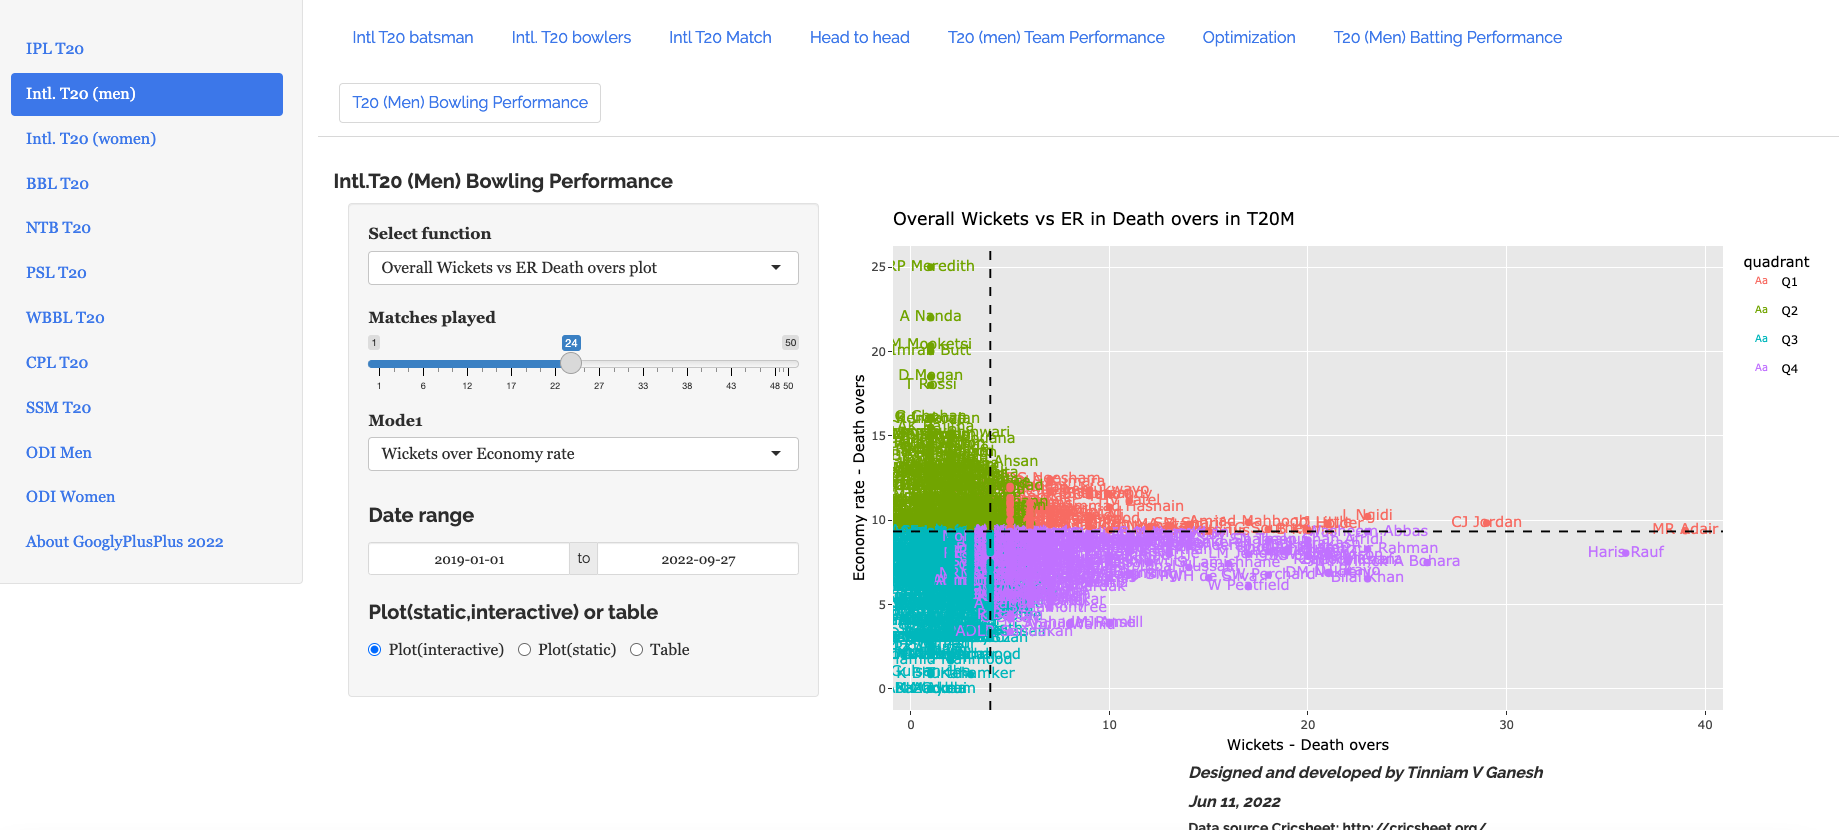
- Bowling analysis tab: Ranks bowlers based on Wickets or ER. Also plots performances of bowlers in power play, middle and death overs and plots them in a 4×4 grid
Also note all these tabs and features are available for all T20 formats namely IPL, Intl. T20 (men, women), BBL, NTB, PSL, CPL, SSM.
Important note: It is possible, that at times, the Win Probability (Deep Learning) for some recent IPL matches will give an error. This is because I need to rebuild the models on a daily basis as the matches use player embeddings and there are new players. While I will definitely rebuild the models on weekends and whenever I find time, you may have to bear with this error occasionally.
Note: All charts are interactive, which means that you can hover, zoom-in, zoom-out, pan etc on the charts
The latest avatar of GooglyPlusPlus2023 is based on my R package yorkr with data from Cricsheet.
Check out the latest version of GooglyPlusPlus
Follow me on twitter for daily highlights @tvganesh_85
GooglyPlusPlus can analyse players, matches, teams, rank, compute win probability and much more.
Included below are some random analyses of IPL 2023 matches so far
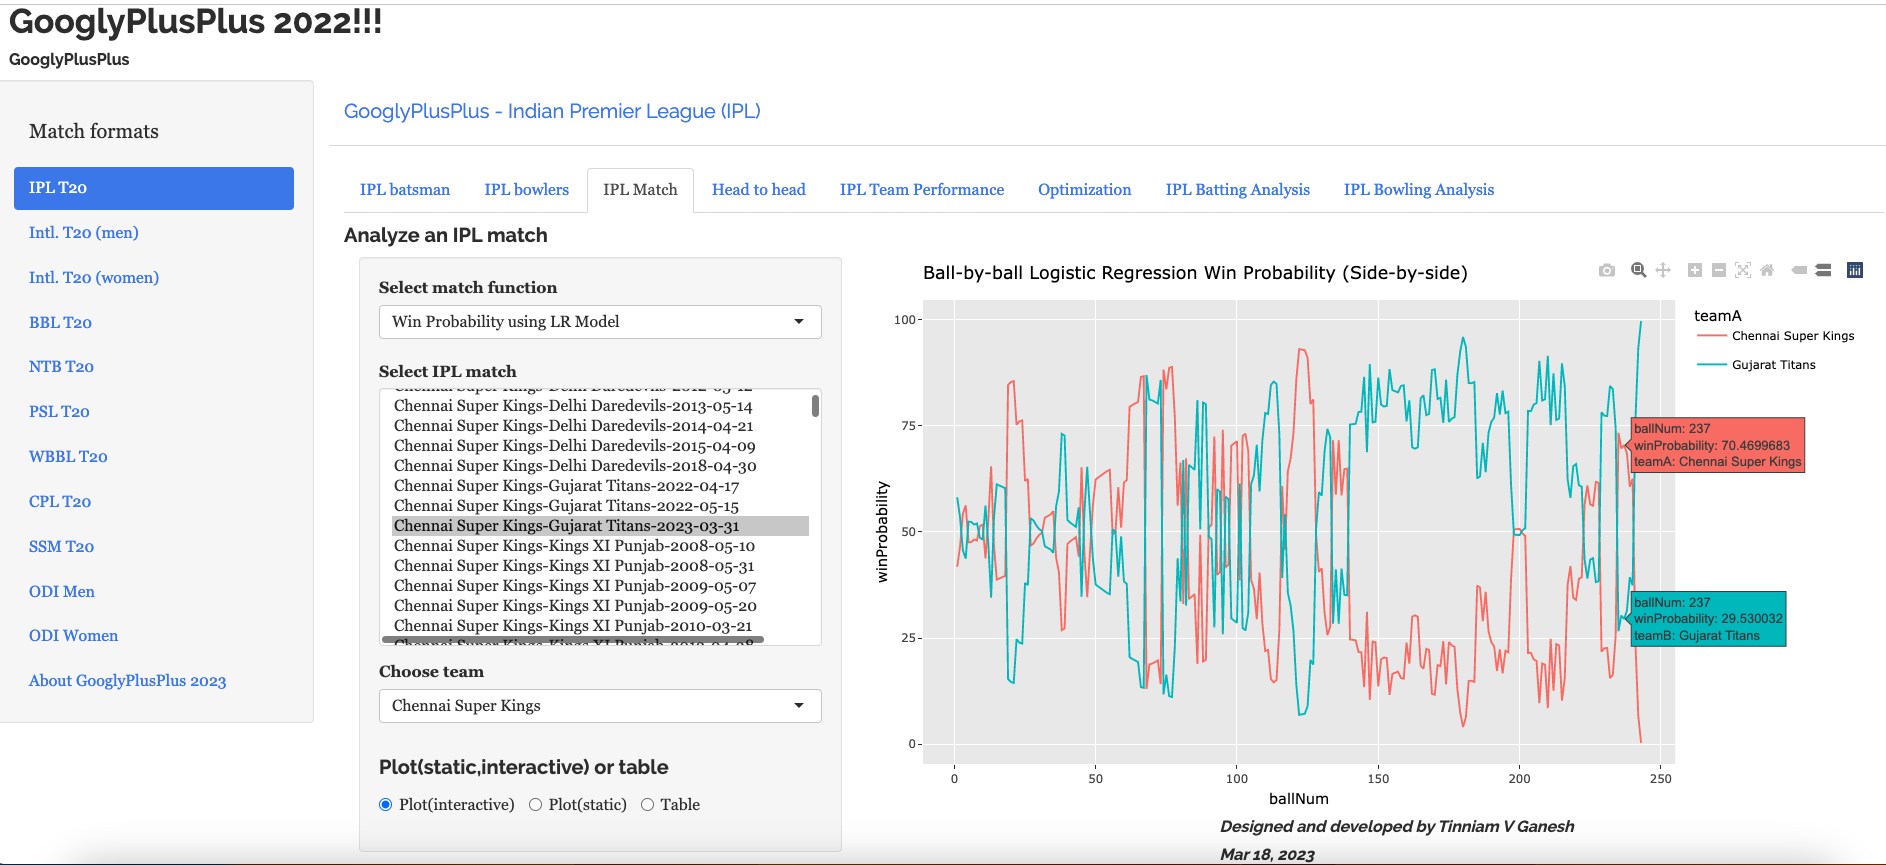
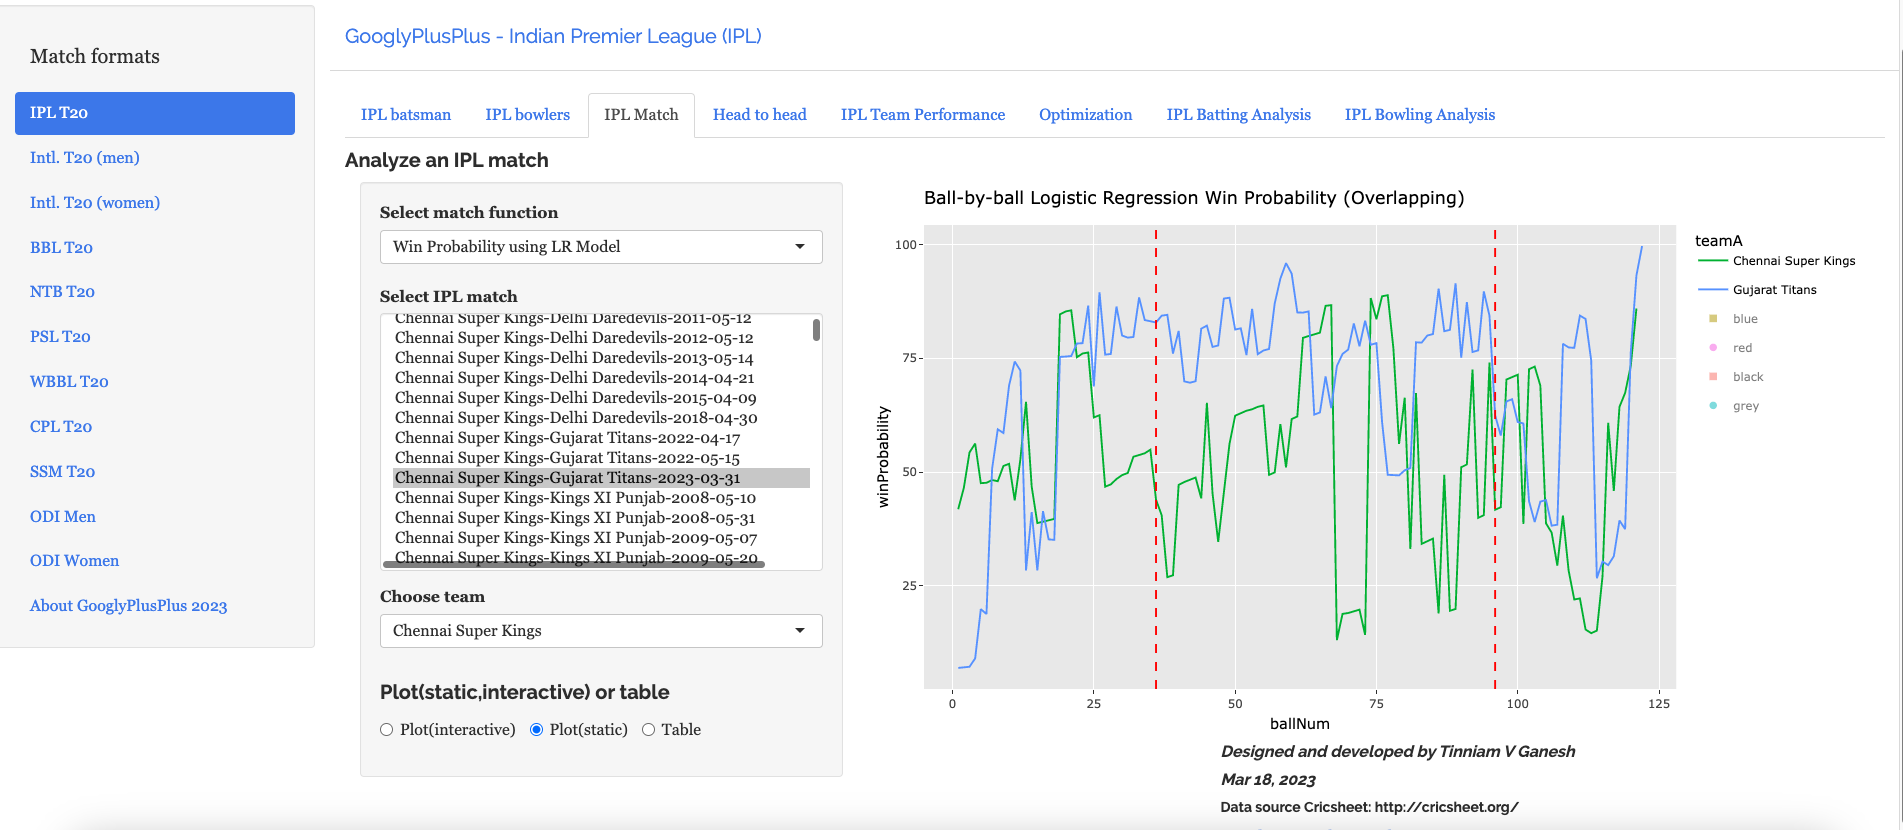
A) Chennai Super Kings vs Gujarat Titans – 31 Mar 2023
GT won by 5 wickets ( 4 balls remaining)
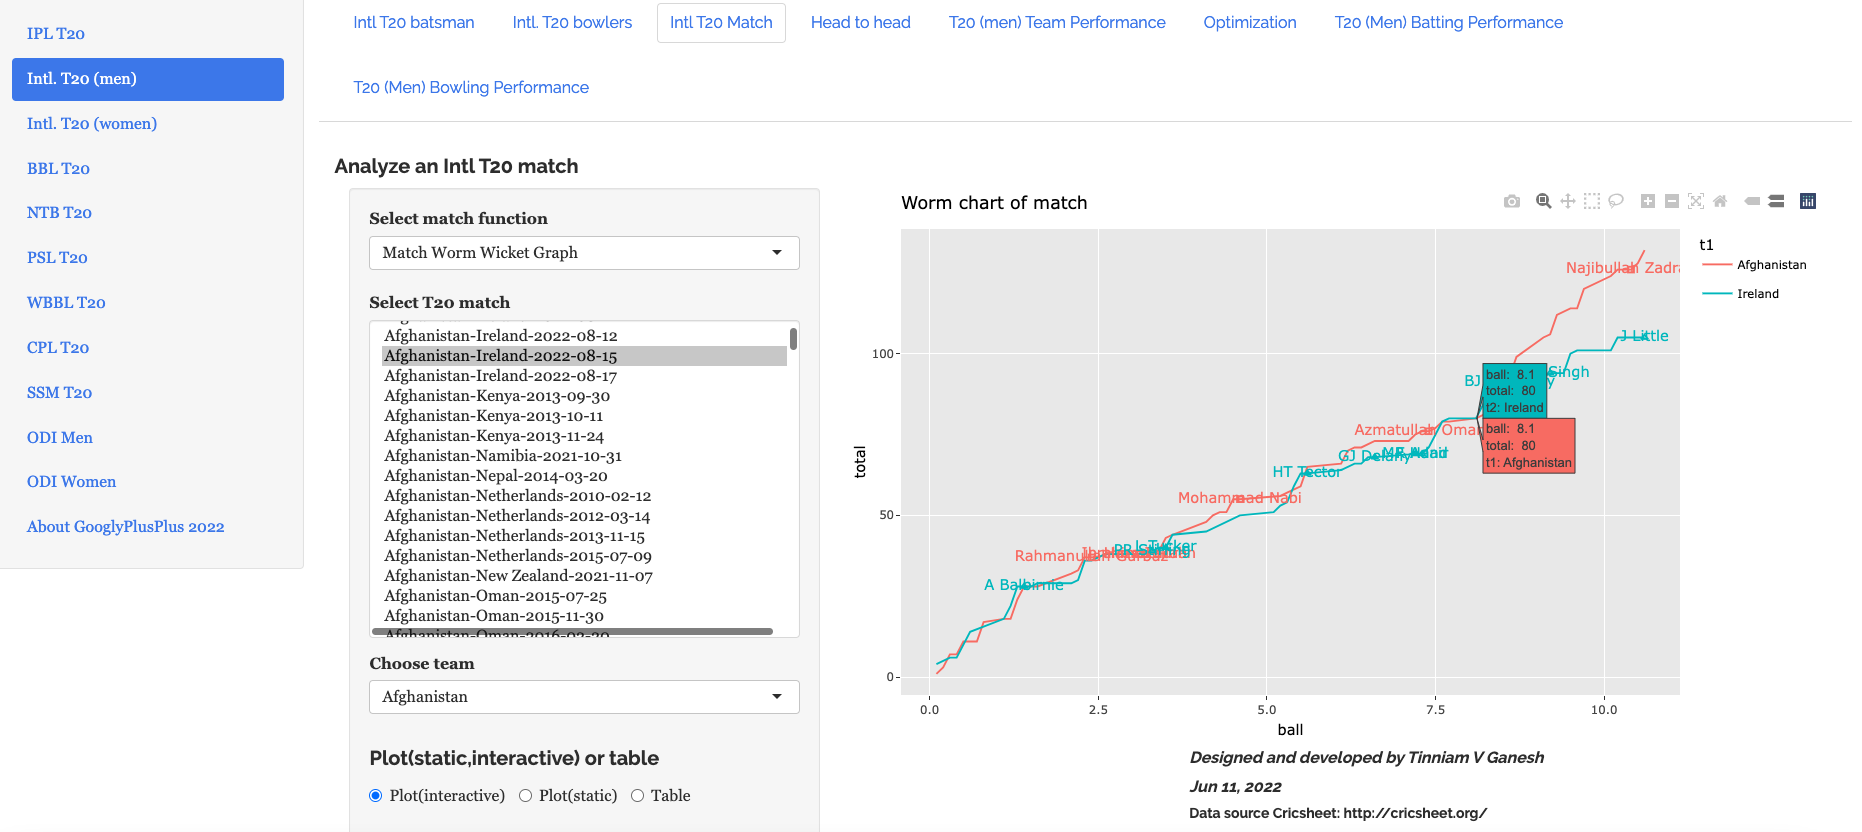
a) Worm Wicket Chart

b) Ball-by-ball Win Probability (Logistic Regression) (side-by-side)
This model shows that CSK had the upper hand in the 2nd last over, before it changed to GT. More details on Win Probability and Win Probability Contribution in the posts given by the links above.
c) b) Ball-by-ball Win Probability (Logistic Regression) (overlapping)
Here the ball-by-ball win probability is overlapped. CSK and GT both had nearly the same probability of winning in the 2nd last over before GT edges CSK out
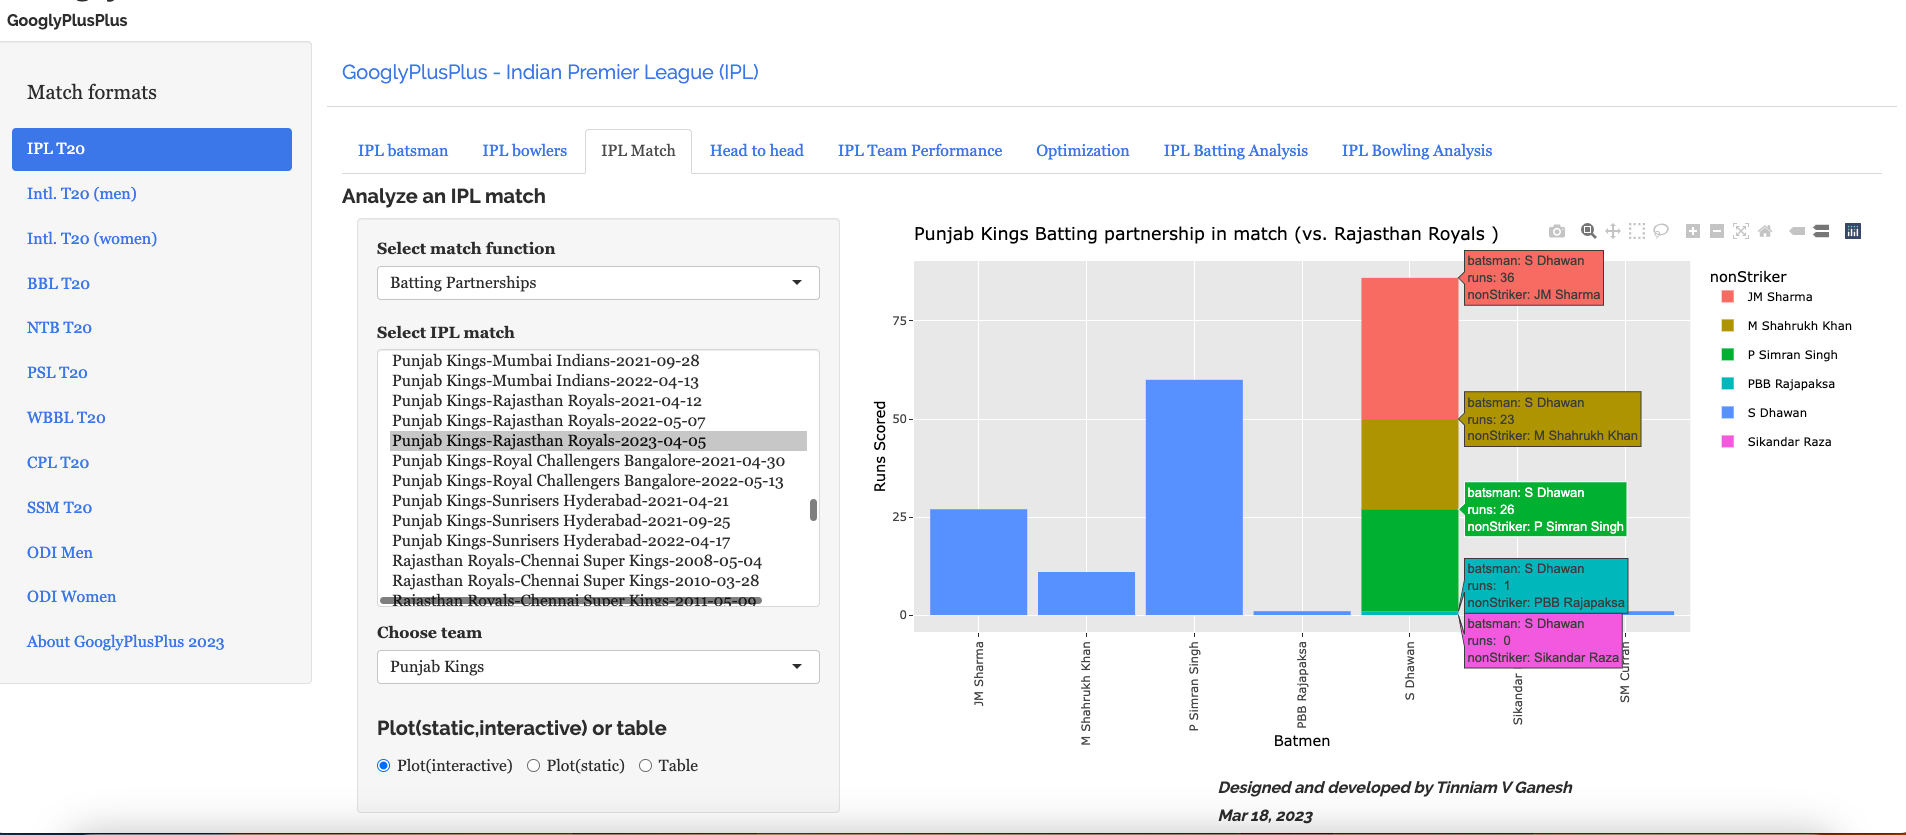
B) Punjab Kings vs Rajasthan Royals – 05 Apr 2023
This was a another closely fought match. PBKS won by 5 runs
a) Worm wicket chart

b) Batting partnerships
Shikhar Dhawan scored 86 runs
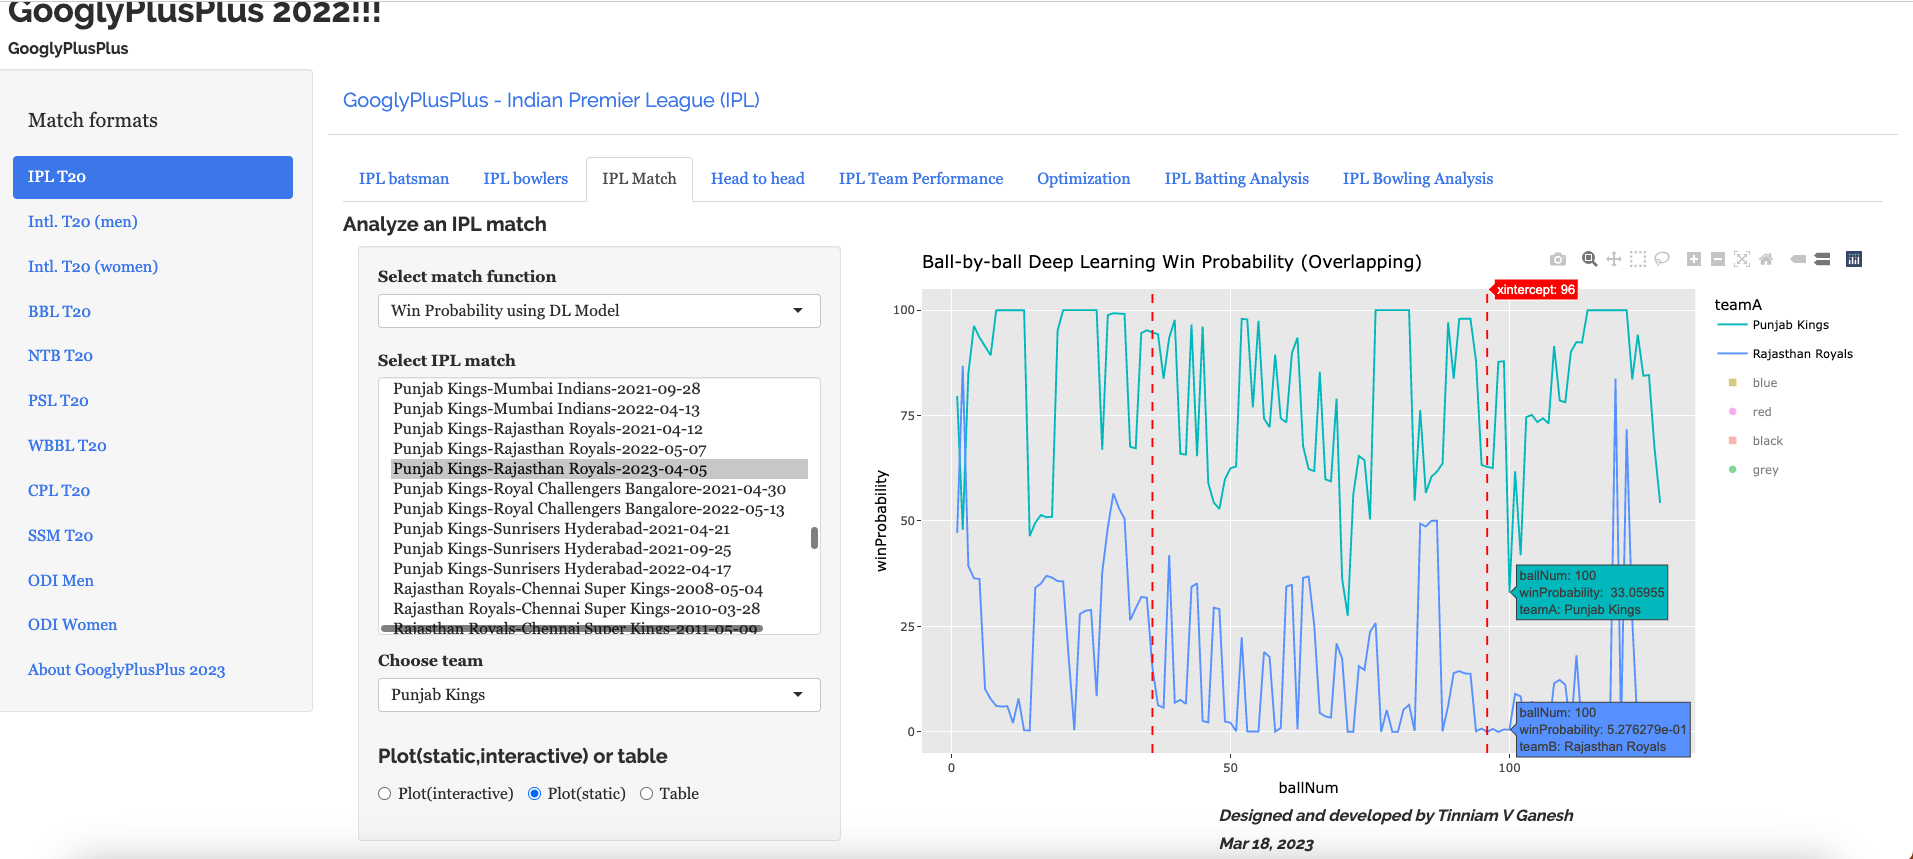
c) Ball-by-ball Win Probability using Deep Learning (overlapping)
PBKS was generally ahead in the win probability race
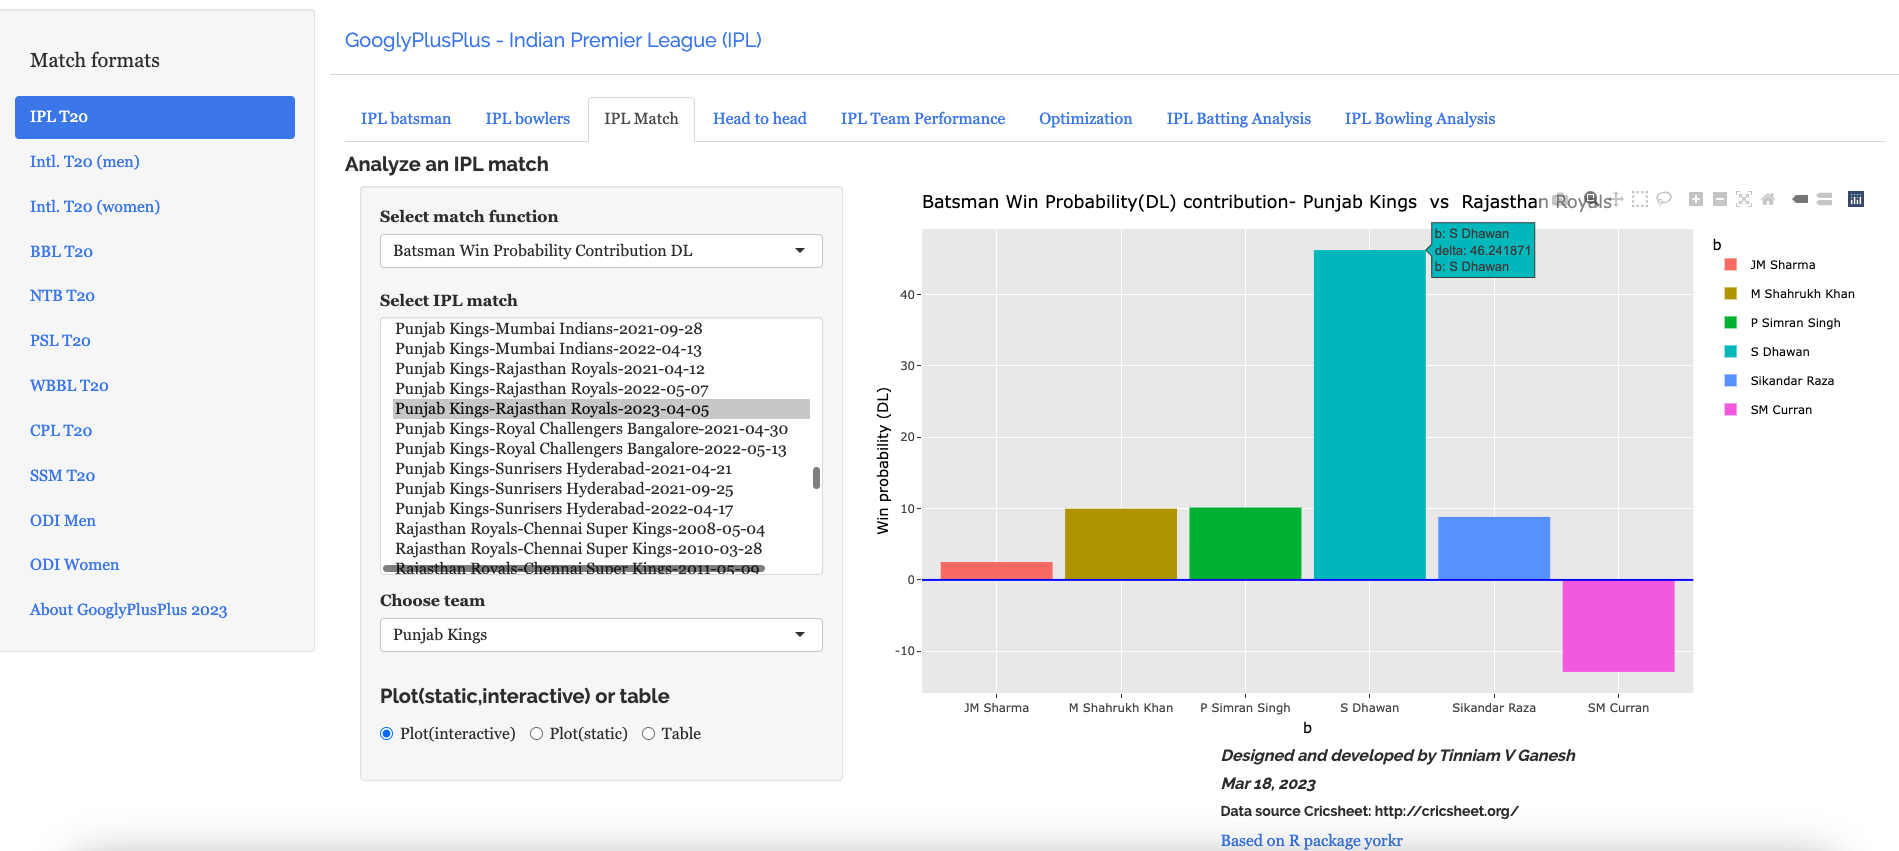
d) Batsman Win Probability Contribution
This plot shows how the different batsmen contributed to the Win Probability. We can see that Shikhar Dhawan has a highest win probability. He played a very sensible innings. Also it appears that there is no difference between Prabhsimran Singh and others, though he score 60 runs. This computation is based on when they come to bat and how the win probability changes when they get dismissed, as seen in the 2nd chart

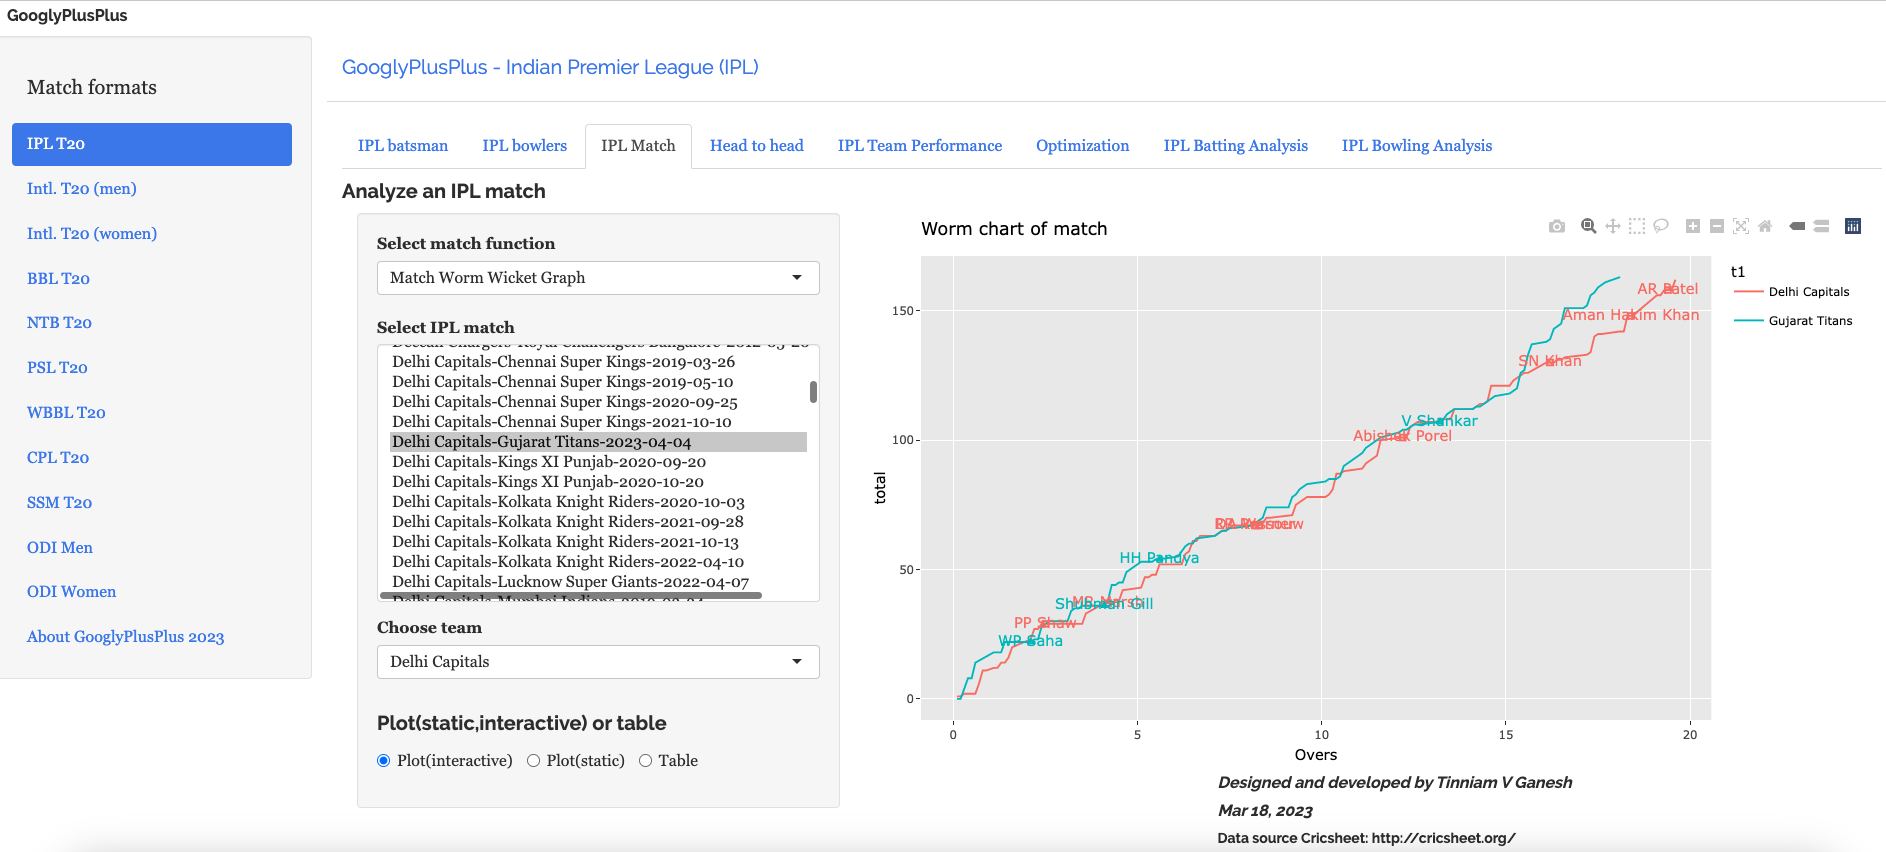
C) Delhi Capitals vs Gujarat Titans – 4 Apr 2023
GT won by 6 wickets (11 balls remaining)
a) Worm wicket chart
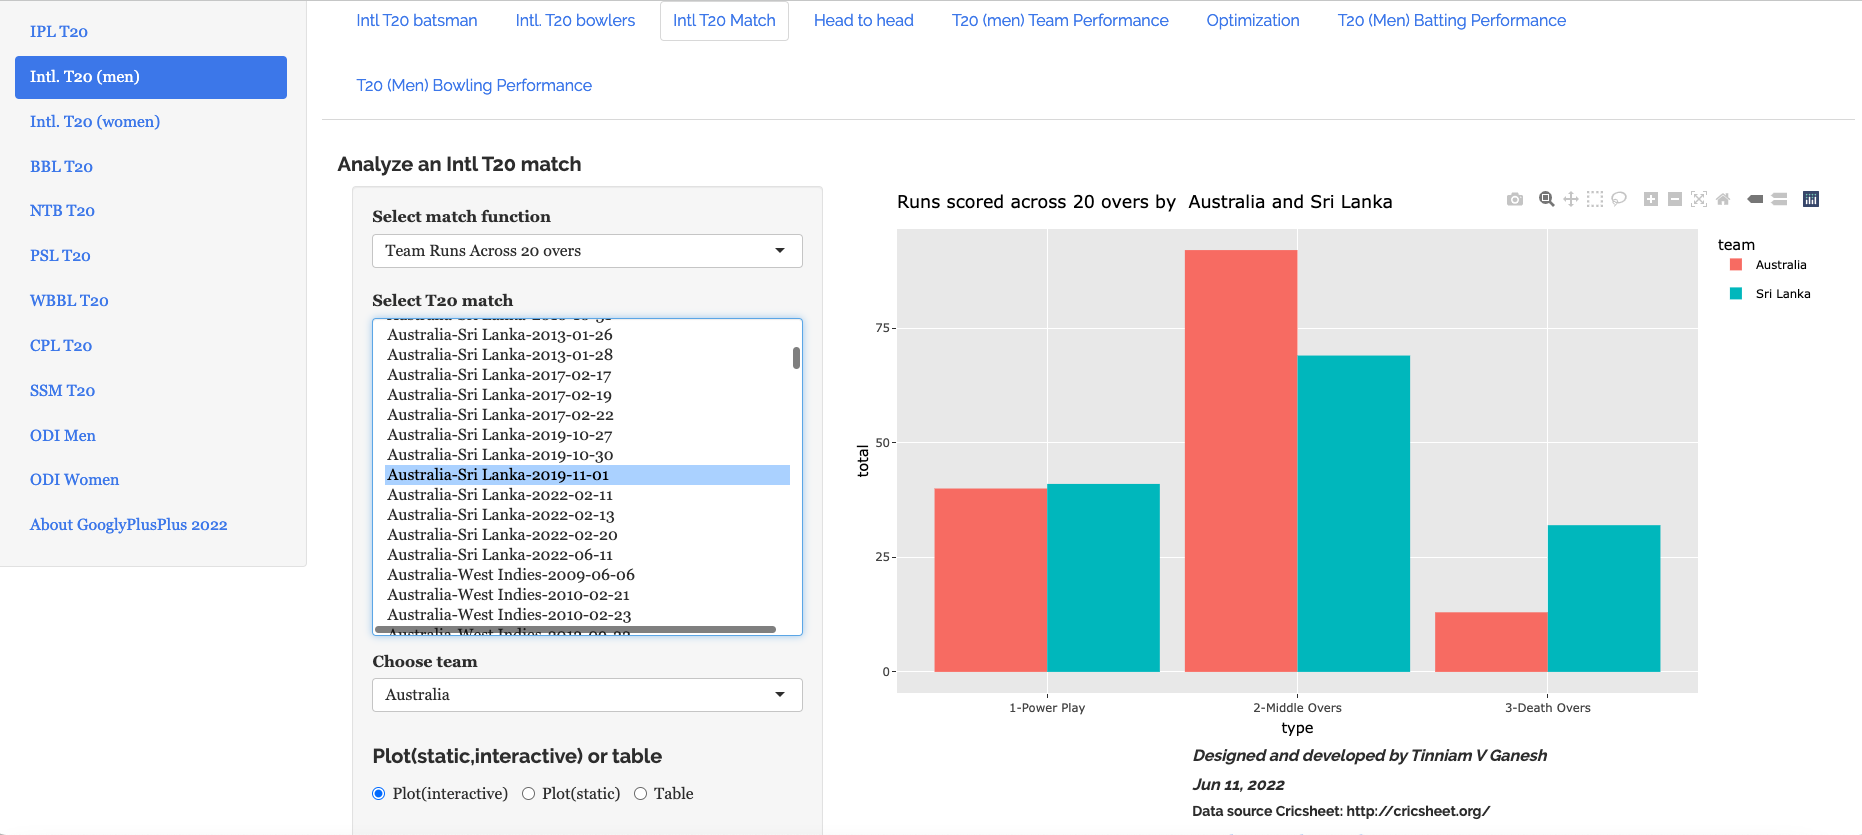
b) Runs scored across 20 overs

c) Runs vs SR plot

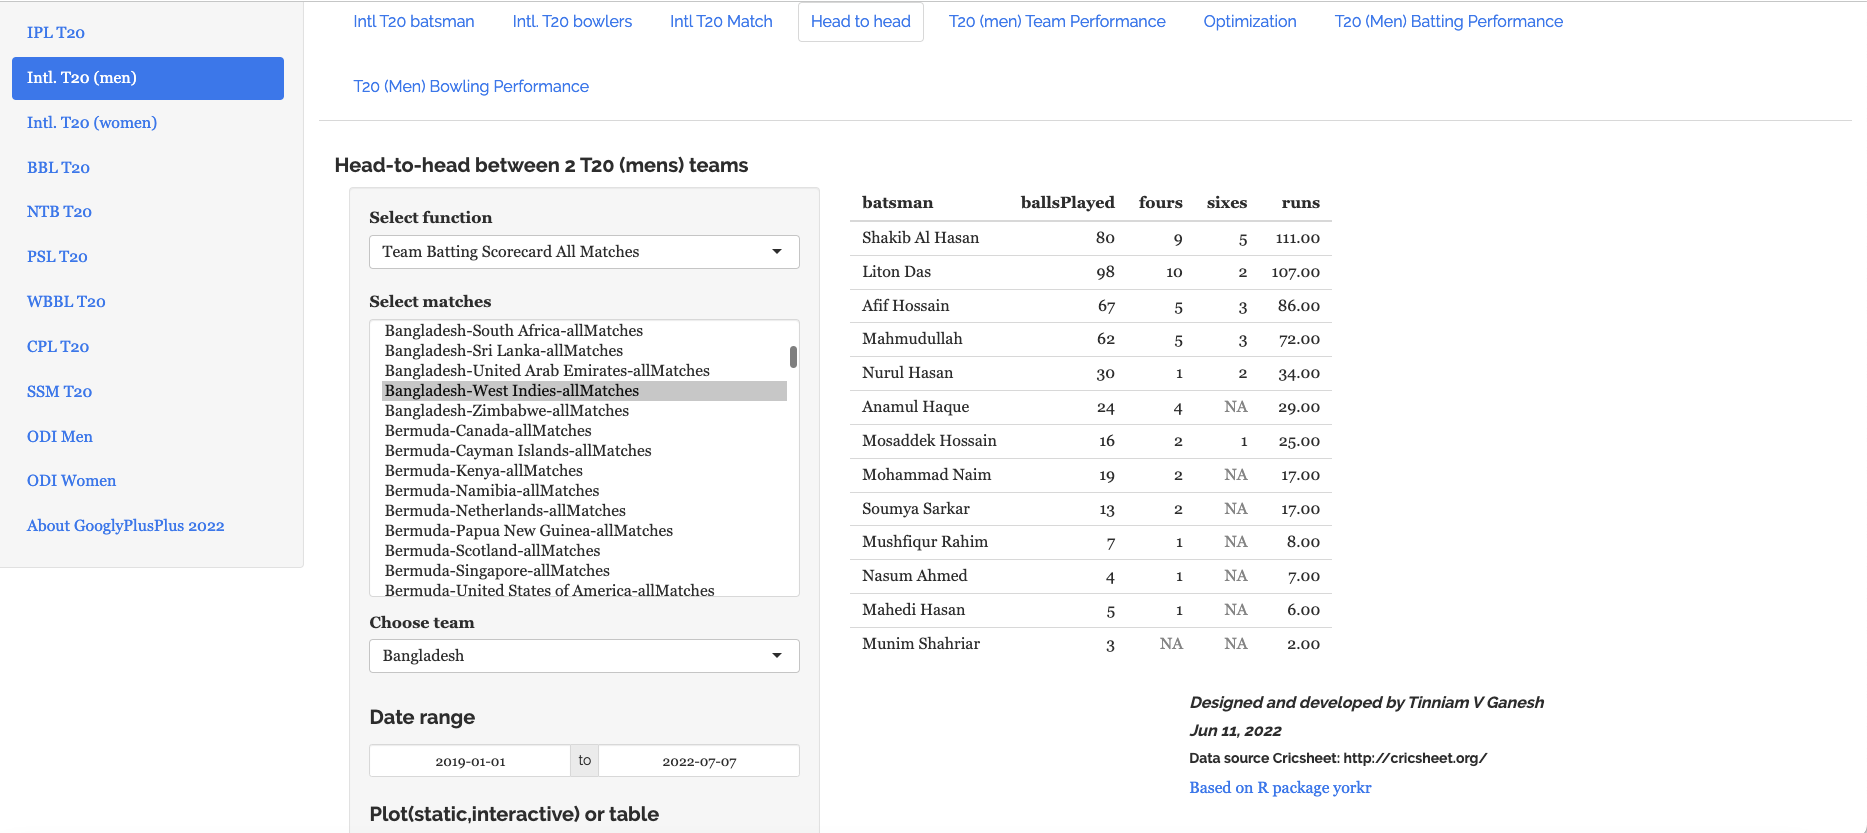
d) Batting scorecard (Gujarat Titans)

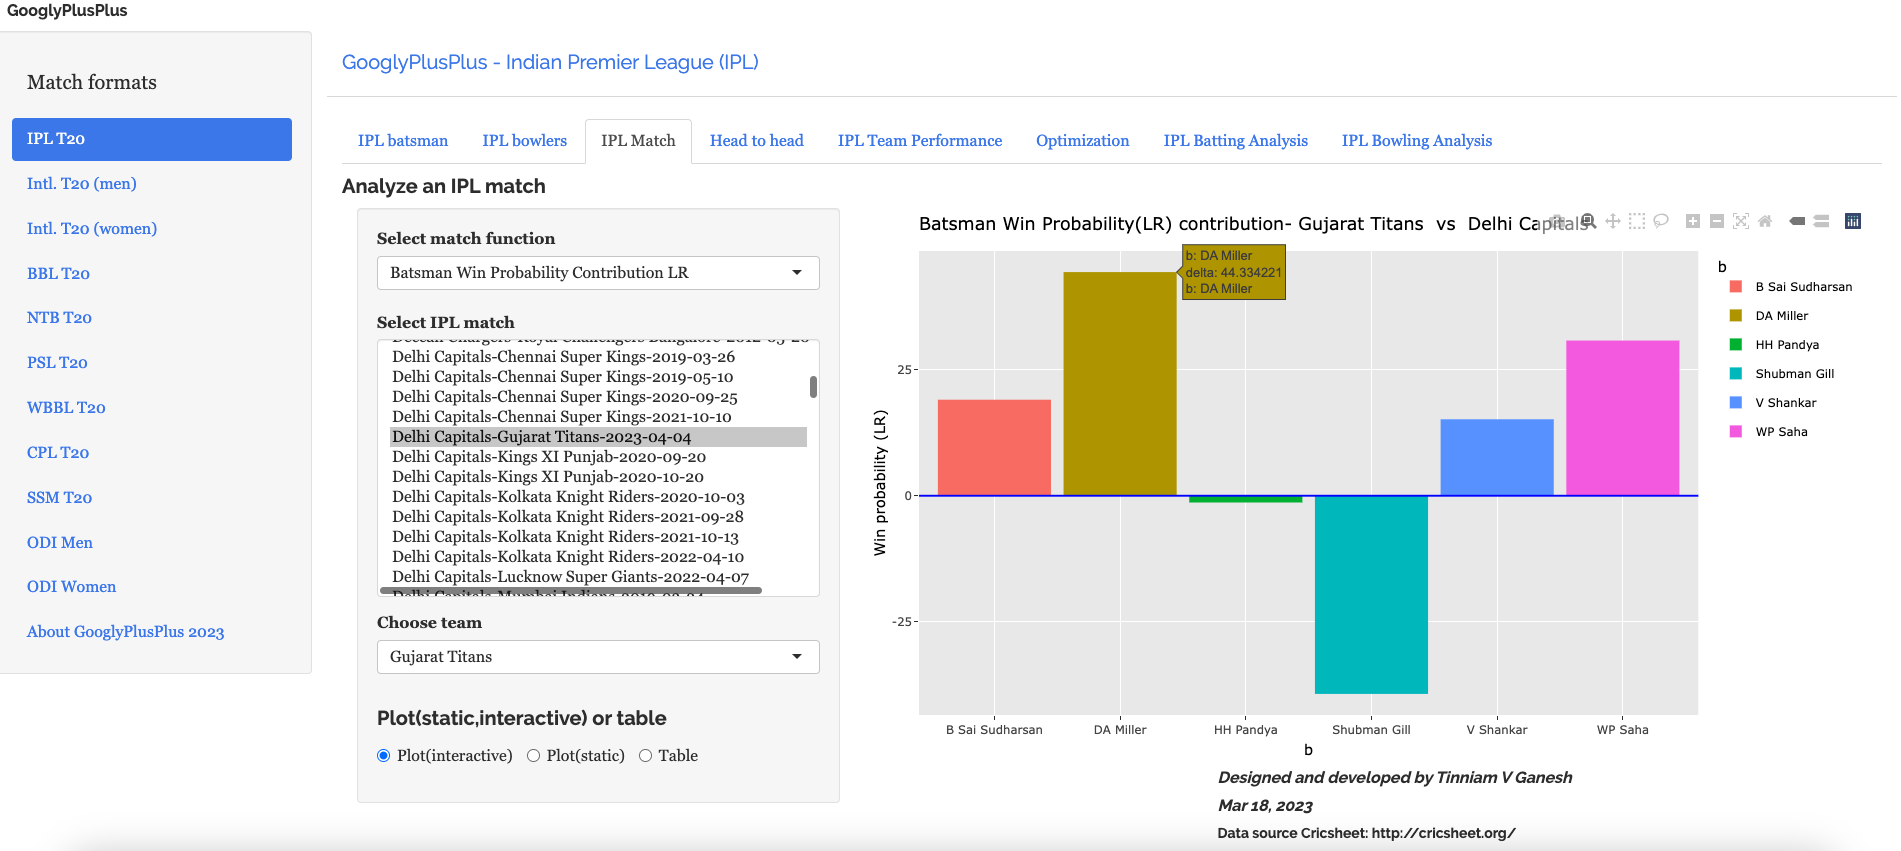
e) Batsman Win Probability Contribution (Gujarat Titans)
Miller has a higher percentage in the Win Contribution than Sai Sudershan who held the innings together.Strange are the ways of the ML models!!
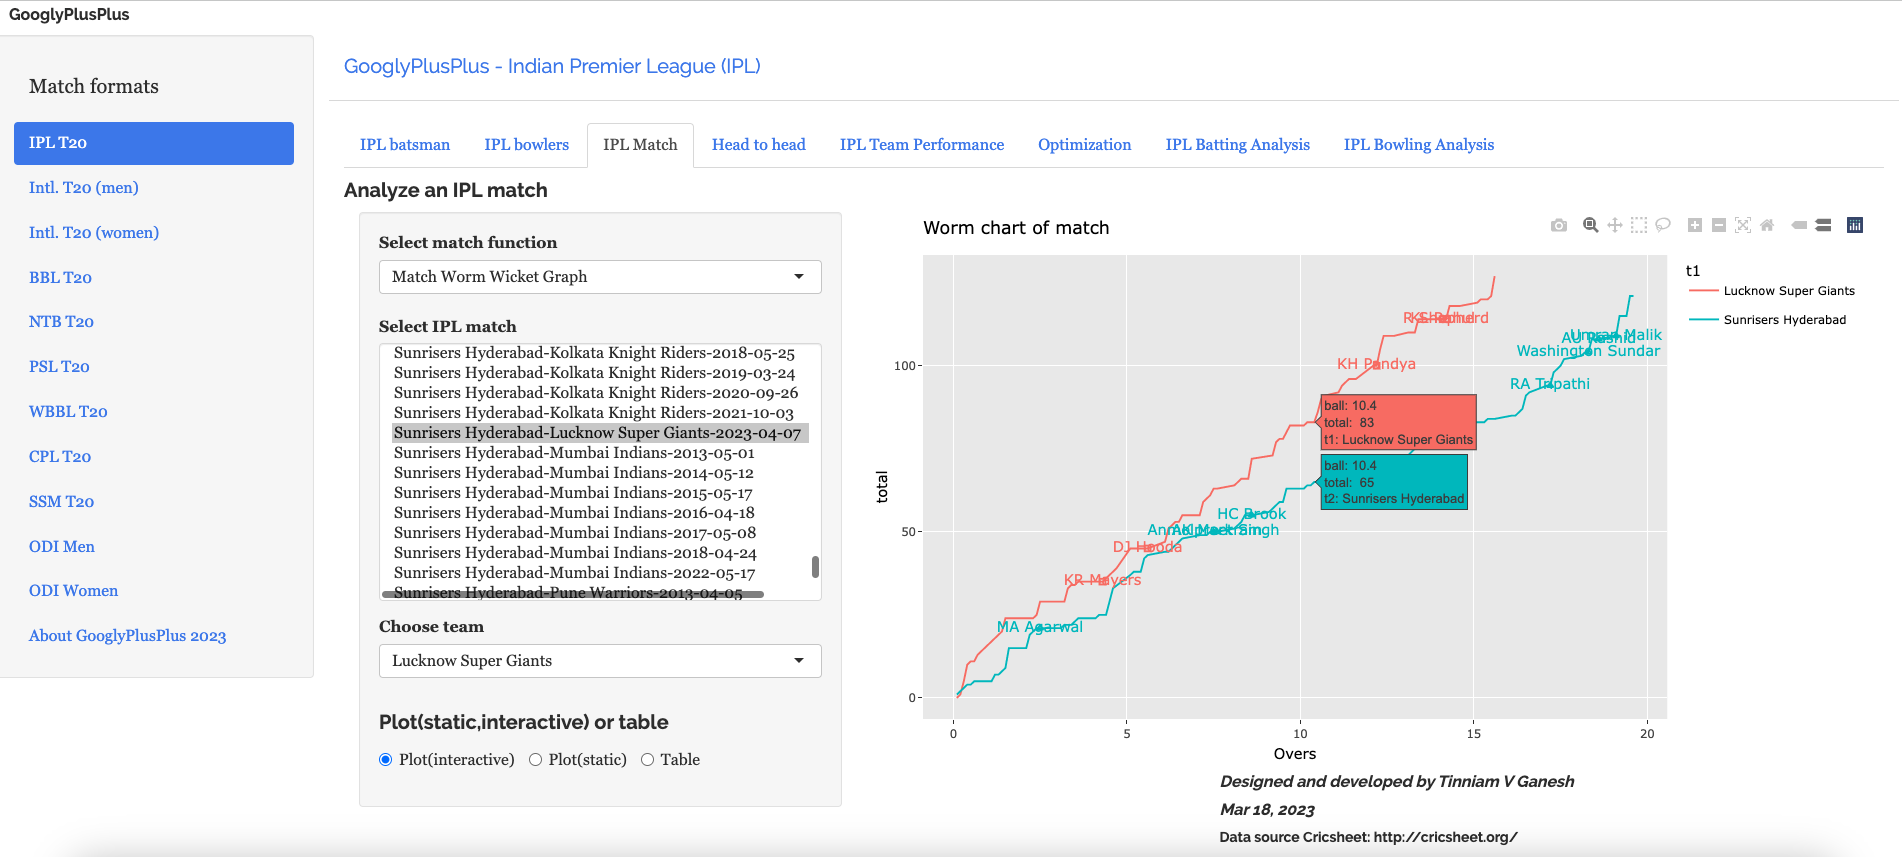
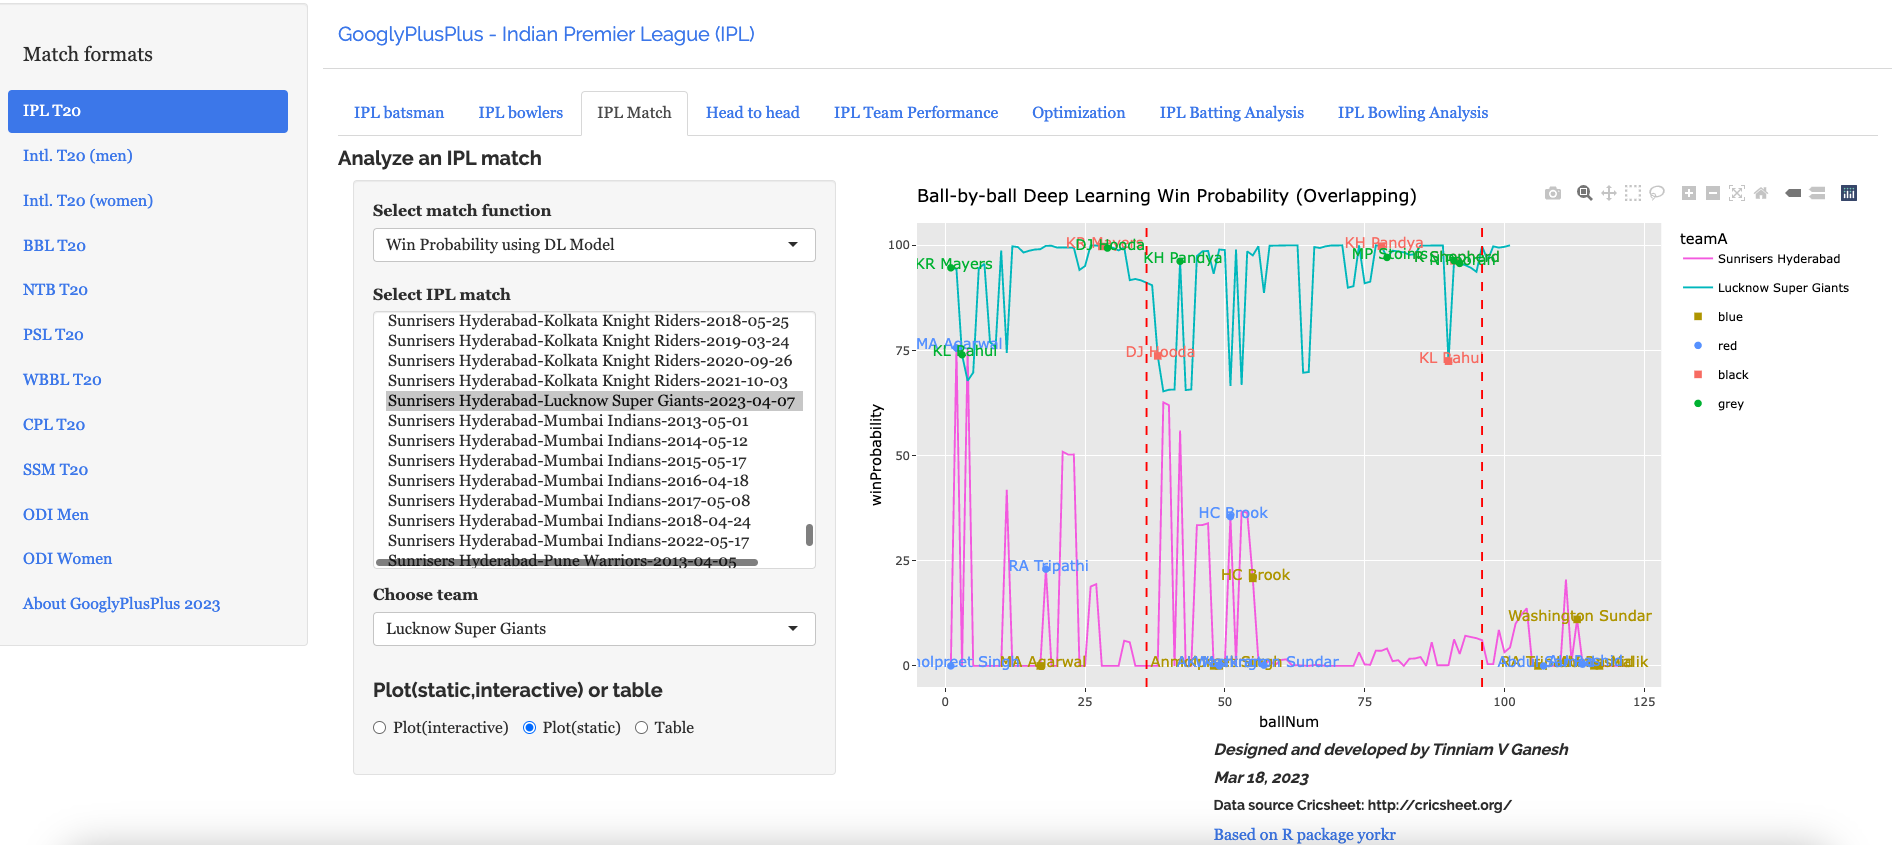
D) Sunrisers Hyderabad vs Lucknow Supergiants ( 7 Apr 2023)
LSG won by 5 wickets (24 balls left). SRH were bamboozled by the pitch while LSG was able to cruise along
a) Worm wicket chart
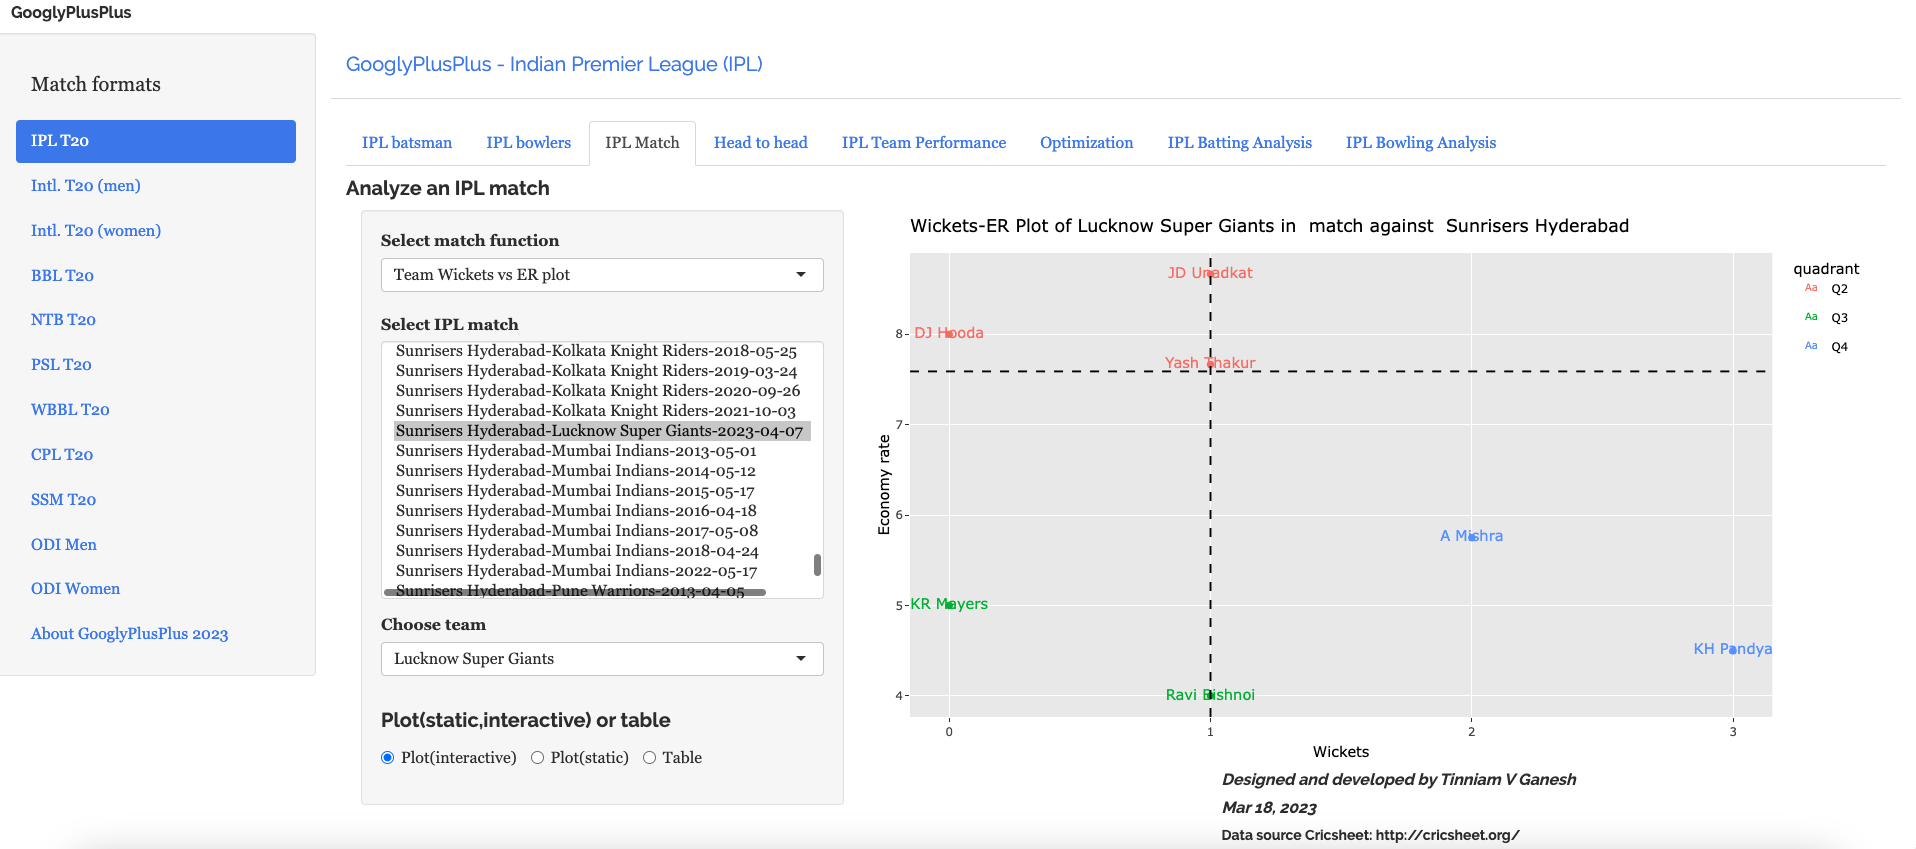
b) Wickets vs ER plot
c) Wickets across 20 overs

d) Ball-by-ball win probability using Deep Learning (overlapping)
e) Bowler Win Probability Contribution (LSG)
Bishnoi has a higher win probability contribution than Krunal, though he just took 1 wicket to Krunal’s 3 wickets. This is based on how the Win Probability changed at that point in the game.

The above set of plots are just a random sample.
Note: There are 8 tabs each for 9 T20 leagues (BBL, CPL, T20 (men), T20 (women), IPL, PSL, NTB, SSM, WBB). So there are a lot more detailed charts/analses.
Do take GooglyPlusPlus for a test drive!!!
Follow me on twitter @tvganesh_85 for daily highlights of previous day matches
Take a look at some of my other posts
- Using Reinforcement Learning to solve Gridworld
- Deep Learning from first principles in Python, R and Octave – Part 6
- Big Data-4: Webserver log analysis with RDDs, Pyspark, SparkR and SparklyR
- Experiments with deblurring using OpenCV
- Singularity
- Practical Machine Learning with R and Python – Part 6
- Pitching yorkpy … short of good length to IPL – Part 1
- Analyzing performances of cricketers using cricketr template
- Cricpy takes guard for the Twenty20s
- Simulating an Edge Shape in Android
To see all posts click Index of posts