In this post ‘Practical Machine Learning with R and Python – Part 3’, I discuss ‘Feature Selection’ methods. This post is a continuation of my 2 earlier posts
While applying Machine Learning techniques, the data set will usually include a large number of predictors for a target variable. It is quite likely, that not all the predictors or feature variables will have an impact on the output. Hence it is becomes necessary to choose only those features which influence the output variable thus simplifying to a reduced feature set on which to train the ML model on. The techniques that are used are the following
This post includes the equivalent ML code in R and Python.
All these methods remove those features which do not sufficiently influence the output. As in my previous 2 posts on “Practical Machine Learning with R and Python’, this post is largely based on the topics in the following 2 MOOC courses
1. Statistical Learning, Prof Trevor Hastie & Prof Robert Tibesherani, Online Stanford
2. Applied Machine Learning in Python Prof Kevyn-Collin Thomson, University Of Michigan, Coursera
Check out my compact and minimal book “Practical Machine Learning with R and Python:Third edition- Machine Learning in stereo” available in Amazon in paperback($12.99) and kindle($8.99) versions. My book includes implementations of key ML algorithms and associated measures and metrics. The book is ideal for anybody who is familiar with the concepts and would like a quick reference to the different ML algorithms that can be applied to problems and how to select the best model. Pick your copy today!!

1.1a Best Fit – R code
The Best Fit requires the ‘leaps’ R package
library(leaps)
source('RFunctions-1.R')
df=read.csv("Boston.csv",stringsAsFactors = FALSE)
names(df) <-c("no","crimeRate","zone","indus","charles","nox","rooms","age",
"distances","highways","tax","teacherRatio","color","status","cost")
df1 <- df %>% dplyr::select("crimeRate","zone","indus","charles","nox","rooms","age",
"distances","highways","tax","teacherRatio","color","status","cost")
bestFit=regsubsets(cost~.,df1,nvmax=13)
bfSummary=summary(bestFit)
plot(bfSummary$rss,xlab="Number of Variables",ylab="RSS",type="l",main="Best fit RSS vs No of features")
a=which.min(bfSummary$rss)
points(a,bfSummary$rss[a],col="red",cex=2,pch=20)
![]() The plot below shows that the Best fit occurs with all 13 features included. Notice that there is no significant change in RSS from 11 features onward.
The plot below shows that the Best fit occurs with all 13 features included. Notice that there is no significant change in RSS from 11 features onward.
plot(bfSummary$cp,xlab="Number of Variables",ylab="Cp",type='l',main="Best fit Cp vs No of features")
b=which.min(bfSummary$cp)
points(b,bfSummary$cp[b],col="red",cex=2,pch=20)
![]() Based on Cp metric the best fit occurs at 11 features as seen below. The values of the coefficients are also included below
Based on Cp metric the best fit occurs at 11 features as seen below. The values of the coefficients are also included below
coef(bestFit,b)
##   (Intercept)     crimeRate          zone       charles           nox
##  36.341145004  -0.108413345   0.045844929   2.718716303 -17.376023429
##         rooms     distances      highways           tax  teacherRatio
##   3.801578840  -1.492711460   0.299608454  -0.011777973  -0.946524570
##         color        status
##   0.009290845  -0.522553457
plot(bfSummary$bic,xlab="Number of Variables",ylab="BIC",type='l',main="Best fit BIC vs No of Features")
c=which.min(bfSummary$bic)
points(c,bfSummary$bic[c],col="red",cex=2,pch=20)
![]()

plot(bestFit,scale="r2",main="Rsquared vs No Features")
![]() R has the following set of really nice visualizations. The plot below shows the Rsquared for a set of predictor variables. It can be seen when Rsquared starts at 0.74- indus, charles and age have not been included.
R has the following set of really nice visualizations. The plot below shows the Rsquared for a set of predictor variables. It can be seen when Rsquared starts at 0.74- indus, charles and age have not been included. 
plot(bestFit,scale="Cp",main="Cp vs NoFeatures")
![]() The Cp plot below for value shows indus, charles and age as not included in the Best fit
The Cp plot below for value shows indus, charles and age as not included in the Best fit

plot(bestFit,scale="bic",main="BIC vs Features")
![]()

1.1b Best fit (Exhaustive Search ) – Python code
The Python package for performing a Best Fit is the Exhaustive Feature Selector EFS.
import numpy as np
import pandas as pd
import os
import matplotlib.pyplot as plt
from sklearn.model_selection import train_test_split
from sklearn.linear_model import LinearRegression
from mlxtend.feature_selection import ExhaustiveFeatureSelector as EFS
df = pd.read_csv("Boston.csv",encoding = "ISO-8859-1")
df.columns=["no","crimeRate","zone","indus","chasRiver","NO2","rooms","age",
"distances","idxHighways","taxRate","teacherRatio","color","status","cost"]
X=df[["crimeRate","zone","indus","chasRiver","NO2","rooms","age",
"distances","idxHighways","taxRate","teacherRatio","color","status"]]
y=df['cost']
lr = LinearRegression()
efs1 = EFS(lr,
min_features=1,
max_features=13,
scoring='neg_mean_squared_error',
print_progress=True,
cv=5)
efs1 = efs1.fit(X.as_matrix(), y.as_matrix())
print('Best negtive mean squared error: %.2f' % efs1.best_score_)
print('Best subset:', efs1.best_idx_)
Features: 8191/8191Best negtive mean squared error: -28.92
## ('Best subset:', (0, 1, 4, 6, 7, 8, 9, 10, 11, 12))
The indices for the best subset are shown above.
1.2 Forward fit
Forward fit is a greedy algorithm that tries to optimize the feature selected, by minimizing the selection criteria (adj Rsqaured, Cp, AIC or BIC) at every step. For a dataset with features f1,f2,f3…fn, the forward fit starts with the NULL set. It then pick the ML model with a single feature from n features which has the highest adj Rsquared, or minimum Cp, BIC or some such criteria. After picking the 1 feature from n which satisfies the criteria the most, the next feature from the remaining n-1 features is chosen. When the 2 feature model which satisfies the selection criteria the best is chosen, another feature from the remaining n-2 features are added and so on. The forward fit is a sub-optimal algorithm. There is no guarantee that the final list of features chosen will be the best among the lot. The computation required for this is of  which is of the order of
  . Though forward fit is a sub optimal solution it is far more computationally efficient than best fit
1.2a Forward fit – R code
Forward fit in R determines that 11 features are required for the best fit. The features are shown below
library(leaps)
df=read.csv("Boston.csv",stringsAsFactors = FALSE)
names(df) <-c("no","crimeRate","zone","indus","charles","nox","rooms","age",
"distances","highways","tax","teacherRatio","color","status","cost")
df1 <- df %>% dplyr::select("crimeRate","zone","indus","charles","nox","rooms","age",
"distances","highways","tax","teacherRatio","color","status","cost")
train_idx <- trainTestSplit(df1,trainPercent=75,seed=5)
train <- df1[train_idx, ]
test <- df1[-train_idx, ]
fitFwd=regsubsets(cost~.,data=train,nvmax=13,method="forward")
valErrors=rep(NA,13)
test.mat=model.matrix(cost~.,data=test)
for(i in 1:13){
coefi=coef(fitFwd,id=i)
pred=test.mat[,names(coefi)]%*%coefi
valErrors[i]=mean((test$cost-pred)^2)
}
plot(valErrors,xlab="Number of Variables",ylab="Validation Error",type="l",main="Forward fit RSS vs No of features")
a<-which.min(valErrors)
print(a)
## [1] 11
points(c,valErrors[a],col="blue",cex=2,pch=20)
![]() Forward fit R selects 11 predictors as the best ML model to predict the ‘cost’ output variable. The values for these 11 predictors are included below
Forward fit R selects 11 predictors as the best ML model to predict the ‘cost’ output variable. The values for these 11 predictors are included below
coefi=coef(fitFwd,id=i)
coefi
##   (Intercept)     crimeRate          zone         indus       charles
##  2.397179e+01 -1.026463e-01  3.118923e-02  1.154235e-04  3.512922e+00
##           nox         rooms           age     distances      highways
## -1.511123e+01  4.945078e+00 -1.513220e-02 -1.307017e+00  2.712534e-01
##           tax  teacherRatio         color        status
## -1.330709e-02 -8.182683e-01  1.143835e-02 -3.750928e-01
1.2b Forward fit with Cross Validation – R code
The Python package SFS includes N Fold Cross Validation errors for forward and backward fit so I decided to add this code to R. This is not available in the ‘leaps’ R package, however the implementation is quite simple. Another implementation is also available at Statistical Learning, Prof Trevor Hastie & Prof Robert Tibesherani, Online Stanford 2.
library(dplyr)
df=read.csv("Boston.csv",stringsAsFactors = FALSE)
names(df) <-c("no","crimeRate","zone","indus","charles","nox","rooms","age",
"distances","highways","tax","teacherRatio","color","status","cost")
df1 <- df %>% dplyr::select("crimeRate","zone","indus","charles","nox","rooms","age",
"distances","highways","tax","teacherRatio","color","status","cost")
set.seed(6)
nvmax<-13
cvError <- NULL
for(i in 1:nvmax){
noFolds=5
folds = sample(1:noFolds, nrow(df1), replace=TRUE)
cv<-0
for(j in 1:noFolds){
train <- df1[folds!=j,]
test <- df1[folds==j,]
fitFwd=regsubsets(cost~.,data=train,nvmax=13,method="forward")
coefi=coef(fitFwd,id=i)
test.mat=model.matrix(cost~.,data=test)
pred=test.mat[,names(coefi)]%*%coefi
rss=mean((test$cost - pred)^2)
cv=cv+rss
}
cvError[i]=cv/noFolds
}
a <- seq(1,13)
d <- as.data.frame(t(rbind(a,cvError)))
names(d) <- c("Features","CVError")
#Plot the CV Error vs No of Features
ggplot(d,aes(x=Features,y=CVError),color="blue") + geom_point() + geom_line(color="blue") +
xlab("No of features") + ylab("Cross Validation Error") +
ggtitle("Forward Selection - Cross Valdation Error vs No of Features")
![]() Forward fit with 5 fold cross validation indicates that all 13 features are required
Forward fit with 5 fold cross validation indicates that all 13 features are required
a=which.min(cvError)
print(a)
## [1] 13
coefi=coef(fitFwd,id=a)
coefi
##   (Intercept)     crimeRate          zone         indus       charles
##  36.650645380  -0.107980979   0.056237669   0.027016678   4.270631466
##           nox         rooms           age     distances      highways
## -19.000715500   3.714720418   0.019952654  -1.472533973   0.326758004
##           tax  teacherRatio         color        status
##  -0.011380750  -0.972862622   0.009549938  -0.582159093
1.2c Forward fit – Python code
The Backward Fit in Python uses the Sequential feature selection (SFS) package (SFS)(https://rasbt.github.io/mlxtend/user_guide/feature_selection/SequentialFeatureSelector/)
Note: The Cross validation error for SFS in Sklearn is negative, possibly because it computes the ‘neg_mean_squared_error’. The earlier ‘mean_squared_error’ in the package seems to have been deprecated. I have taken the -ve of this neg_mean_squared_error. I think this would give mean_squared_error.
import numpy as np
import pandas as pd
import os
import matplotlib.pyplot as plt
from sklearn.model_selection import train_test_split
from sklearn.linear_model import LinearRegression
from sklearn.datasets import load_boston
from mlxtend.plotting import plot_sequential_feature_selection as plot_sfs
import matplotlib.pyplot as plt
from mlxtend.feature_selection import SequentialFeatureSelector as SFS
from sklearn.linear_model import LinearRegression
df = pd.read_csv("Boston.csv",encoding = "ISO-8859-1")
df.columns=["no","crimeRate","zone","indus","chasRiver","NO2","rooms","age",
"distances","idxHighways","taxRate","teacherRatio","color","status","cost"]
X=df[["crimeRate","zone","indus","chasRiver","NO2","rooms","age",
"distances","idxHighways","taxRate","teacherRatio","color","status"]]
y=df['cost']
lr = LinearRegression()
sfs = SFS(lr,
k_features=(1,13),
forward=True,
floating=False,
scoring='neg_mean_squared_error',
cv=5)
sfs = sfs.fit(X.as_matrix(), y.as_matrix())
a=sfs.get_metric_dict()
n=[]
o=[]
for i in np.arange(1,13):
n.append(-np.mean(a[i]['cv_scores']))
m=np.arange(1,13)
fig1=plt.plot(m,n)
fig1=plt.title('Mean CV Scores vs No of features')
fig1.figure.savefig('fig1.png', bbox_inches='tight')
print(pd.DataFrame.from_dict(sfs.get_metric_dict(confidence_interval=0.90)).T)
idx = np.argmin(n)
print "No of features=",idx
b=list(a[idx]['feature_idx'])
print(b)
print("Features selected in forward fit")
print(X.columns[b])
##    avg_score ci_bound                                          cv_scores  \
## 1   -42.6185  19.0465  [-23.5582499971, -41.8215743748, -73.993608929...
## 2   -36.0651  16.3184  [-18.002498199, -40.1507894517, -56.5286659068...
## 3   -34.1001    20.87  [-9.43012884381, -25.9584955394, -36.184188174...
## 4   -33.7681  20.1638  [-8.86076528781, -28.650217633, -35.7246353855...
## 5   -33.6392  20.5271  [-8.90807628524, -28.0684679108, -35.827463022...
## 6   -33.6276  19.0859  [-9.549485942, -30.9724602876, -32.6689523347,...
## 7   -32.4082  19.1455  [-10.0177149635, -28.3780298492, -30.926917231...
## 8   -32.3697   18.533  [-11.1431684243, -27.5765510172, -31.168994094...
## 9   -32.4016  21.5561  [-10.8972555995, -25.739780653, -30.1837430353...
## 10  -32.8504  22.6508  [-12.3909282079, -22.1533250755, -33.385407342...
## 11  -34.1065  24.7019  [-12.6429253721, -22.1676650245, -33.956999528...
## 12  -35.5814   25.693  [-12.7303397453, -25.0145323483, -34.211898373...
## 13  -37.1318  23.2657  [-12.4603005692, -26.0486211062, -33.074137979...
##
##                                    feature_idx  std_dev  std_err
## 1                                        (12,)  18.9042  9.45212
## 2                                     (10, 12)  16.1965  8.09826
## 3                                  (10, 12, 5)  20.7142  10.3571
## 4                               (10, 3, 12, 5)  20.0132  10.0066
## 5                            (0, 10, 3, 12, 5)  20.3738  10.1869
## 6                         (0, 3, 5, 7, 10, 12)  18.9433  9.47167
## 7                      (0, 2, 3, 5, 7, 10, 12)  19.0026  9.50128
## 8                   (0, 1, 2, 3, 5, 7, 10, 12)  18.3946  9.19731
## 9               (0, 1, 2, 3, 5, 7, 10, 11, 12)  21.3952  10.6976
## 10           (0, 1, 2, 3, 4, 5, 7, 10, 11, 12)  22.4816  11.2408
## 11        (0, 1, 2, 3, 4, 5, 6, 7, 10, 11, 12)  24.5175  12.2587
## 12     (0, 1, 2, 3, 4, 5, 6, 7, 9, 10, 11, 12)  25.5012  12.7506
## 13  (0, 1, 2, 3, 4, 5, 6, 7, 8, 9, 10, 11, 12)  23.0919   11.546
## No of features= 7
## [0, 2, 3, 5, 7, 10, 12]
## #################################################################################
## Features selected in forward fit
## Index([u'crimeRate', u'indus', u'chasRiver', u'rooms', u'distances',
##        u'teacherRatio', u'status'],
##       dtype='object')
1.3 Backward Fit
Backward fit belongs to the class of greedy algorithms which tries to optimize the feature set, by dropping a feature at every stage which results in the worst performance for a given criteria of Adj RSquared, Cp, BIC or AIC. For a dataset with features f1,f2,f3…fn, the backward fit starts with the all the features f1,f2.. fn to begin with. It then pick the ML model with a n-1 features by dropping the feature, , for e.g., the inclusion of which results in the worst performance in adj Rsquared, or minimum Cp, BIC or some such criteria. At every step 1 feature is dopped. There is no guarantee that the final list of features chosen will be the best among the lot. The computation required for this is of which is of the order of . Though backward fit is a sub optimal solution it is far more computationally efficient than best fit
1.3a Backward fit – R code
library(dplyr)
df=read.csv("Boston.csv",stringsAsFactors = FALSE)
names(df) <-c("no","crimeRate","zone","indus","charles","nox","rooms","age",
"distances","highways","tax","teacherRatio","color","status","cost")
df1 <- df %>% dplyr::select("crimeRate","zone","indus","charles","nox","rooms","age",
"distances","highways","tax","teacherRatio","color","status","cost")
set.seed(6)
nvmax<-13
cvError <- NULL
for(i in 1:nvmax){
noFolds=5
folds = sample(1:noFolds, nrow(df1), replace=TRUE)
cv<-0
for(j in 1:noFolds){
train <- df1[folds!=j,]
test <- df1[folds==j,]
fitFwd=regsubsets(cost~.,data=train,nvmax=13,method="backward")
coefi=coef(fitFwd,id=i)
test.mat=model.matrix(cost~.,data=test)
pred=test.mat[,names(coefi)]%*%coefi
rss=mean((test$cost - pred)^2)
cv=cv+rss
}
cvError[i]=cv/noFolds
}
a <- seq(1,13)
d <- as.data.frame(t(rbind(a,cvError)))
names(d) <- c("Features","CVError")
ggplot(d,aes(x=Features,y=CVError),color="blue") + geom_point() + geom_line(color="blue") +
xlab("No of features") + ylab("Cross Validation Error") +
ggtitle("Backward Selection - Cross Valdation Error vs No of Features")
![]()

a=which.min(cvError)
print(a)
## [1] 13
coefi=coef(fitFwd,id=a)
coefi
##   (Intercept)     crimeRate          zone         indus       charles
##  36.650645380  -0.107980979   0.056237669   0.027016678   4.270631466
##           nox         rooms           age     distances      highways
## -19.000715500   3.714720418   0.019952654  -1.472533973   0.326758004
##           tax  teacherRatio         color        status
##  -0.011380750  -0.972862622   0.009549938  -0.582159093
Backward selection in R also indicates the 13 features and the corresponding coefficients as providing the best fit
1.3b Backward fit – Python code
The Backward Fit in Python uses the Sequential feature selection (SFS) package (SFS)(https://rasbt.github.io/mlxtend/user_guide/feature_selection/SequentialFeatureSelector/)
import numpy as np
import pandas as pd
import os
import matplotlib.pyplot as plt
from sklearn.model_selection import train_test_split
from sklearn.linear_model import LinearRegression
from mlxtend.plotting import plot_sequential_feature_selection as plot_sfs
import matplotlib.pyplot as plt
from mlxtend.feature_selection import SequentialFeatureSelector as SFS
from sklearn.linear_model import LinearRegression
df = pd.read_csv("Boston.csv",encoding = "ISO-8859-1")
df.columns=["no","crimeRate","zone","indus","chasRiver","NO2","rooms","age",
"distances","idxHighways","taxRate","teacherRatio","color","status","cost"]
X=df[["crimeRate","zone","indus","chasRiver","NO2","rooms","age",
"distances","idxHighways","taxRate","teacherRatio","color","status"]]
y=df['cost']
lr = LinearRegression()
sfs = SFS(lr,
k_features=(1,13),
forward=False,
floating=False,
scoring='neg_mean_squared_error',
cv=5)
sfs = sfs.fit(X.as_matrix(), y.as_matrix())
a=sfs.get_metric_dict()
n=[]
o=[]
for i in np.arange(1,13):
n.append(-np.mean(a[i]['cv_scores']))
m=np.arange(1,13)
fig2=plt.plot(m,n)
fig2=plt.title('Mean CV Scores vs No of features')
fig2.figure.savefig('fig2.png', bbox_inches='tight')
print(pd.DataFrame.from_dict(sfs.get_metric_dict(confidence_interval=0.90)).T)
idx = np.argmin(n)
print "No of features=",idx
b=list(a[idx]['feature_idx'])
print("Features selected in bacward fit")
print(X.columns[b])
##    avg_score ci_bound                                          cv_scores  \
## 1   -42.6185  19.0465  [-23.5582499971, -41.8215743748, -73.993608929...
## 2   -36.0651  16.3184  [-18.002498199, -40.1507894517, -56.5286659068...
## 3   -35.4992  13.9619  [-17.2329292677, -44.4178648308, -51.633177846...
## 4    -33.463  12.4081  [-20.6415333292, -37.3247852146, -47.479302977...
## 5   -33.1038  10.6156  [-20.2872309863, -34.6367078466, -45.931870352...
## 6   -32.0638  10.0933  [-19.4463829372, -33.460638577, -42.726257249,...
## 7   -30.7133  9.23881  [-19.4425181917, -31.1742902259, -40.531266671...
## 8   -29.7432  9.84468  [-19.445277268, -30.0641187173, -40.2561247122...
## 9   -29.0878  9.45027  [-19.3545569877, -30.094768669, -39.7506036377...
## 10  -28.9225  9.39697  [-18.562171585, -29.968504938, -39.9586835965,...
## 11  -29.4301  10.8831  [-18.3346152225, -30.3312847532, -45.065432793...
## 12  -30.4589  11.1486  [-18.493389527, -35.0290639374, -45.1558231765...
## 13  -37.1318  23.2657  [-12.4603005692, -26.0486211062, -33.074137979...
##
##                                    feature_idx  std_dev  std_err
## 1                                        (12,)  18.9042  9.45212
## 2                                     (10, 12)  16.1965  8.09826
## 3                                  (10, 12, 7)  13.8576  6.92881
## 4                               (12, 10, 4, 7)  12.3154  6.15772
## 5                            (4, 7, 8, 10, 12)  10.5363  5.26816
## 6                         (4, 7, 8, 9, 10, 12)  10.0179  5.00896
## 7                      (1, 4, 7, 8, 9, 10, 12)  9.16981  4.58491
## 8                  (1, 4, 7, 8, 9, 10, 11, 12)  9.77116  4.88558
## 9               (0, 1, 4, 7, 8, 9, 10, 11, 12)  9.37969  4.68985
## 10           (0, 1, 4, 6, 7, 8, 9, 10, 11, 12)   9.3268   4.6634
## 11        (0, 1, 3, 4, 6, 7, 8, 9, 10, 11, 12)  10.8018  5.40092
## 12     (0, 1, 2, 3, 4, 6, 7, 8, 9, 10, 11, 12)  11.0653  5.53265
## 13  (0, 1, 2, 3, 4, 5, 6, 7, 8, 9, 10, 11, 12)  23.0919   11.546
## No of features= 9
## Features selected in bacward fit
## Index([u'crimeRate', u'zone', u'NO2', u'distances', u'idxHighways', u'taxRate',
##        u'teacherRatio', u'color', u'status'],
##       dtype='object')
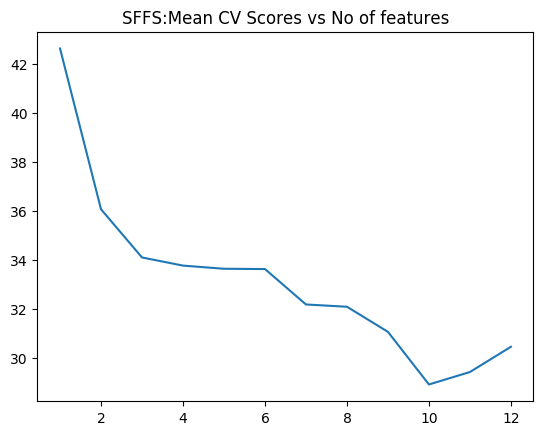
1.3c Sequential Floating Forward Selection (SFFS) – Python code
The Sequential Feature search also includes ‘floating’ variants which include or exclude features conditionally, once they were excluded or included. The SFFS can conditionally include features which were excluded from the previous step, if it results in a better fit. This option will tend to a better solution, than plain simple SFS. These variants are included below
import numpy as np
import pandas as pd
import os
import matplotlib.pyplot as plt
from sklearn.model_selection import train_test_split
from sklearn.linear_model import LinearRegression
from sklearn.datasets import load_boston
from mlxtend.plotting import plot_sequential_feature_selection as plot_sfs
import matplotlib.pyplot as plt
from mlxtend.feature_selection import SequentialFeatureSelector as SFS
from sklearn.linear_model import LinearRegression
df = pd.read_csv("Boston.csv",encoding = "ISO-8859-1")
df.columns=["no","crimeRate","zone","indus","chasRiver","NO2","rooms","age",
"distances","idxHighways","taxRate","teacherRatio","color","status","cost"]
X=df[["crimeRate","zone","indus","chasRiver","NO2","rooms","age",
"distances","idxHighways","taxRate","teacherRatio","color","status"]]
y=df['cost']
lr = LinearRegression()
sffs = SFS(lr,
k_features=(1,13),
forward=True,
floating=True,
scoring='neg_mean_squared_error',
cv=5)
sffs = sffs.fit(X.as_matrix(), y.as_matrix())
a=sffs.get_metric_dict()
n=[]
o=[]
for i in np.arange(1,13):
n.append(-np.mean(a[i]['cv_scores']))
m=np.arange(1,13)
fig3=plt.plot(m,n)
fig3=plt.title('SFFS:Mean CV Scores vs No of features')
fig3.figure.savefig('fig3.png', bbox_inches='tight')
print(pd.DataFrame.from_dict(sffs.get_metric_dict(confidence_interval=0.90)).T)
idx = np.argmin(n)
print "No of features=",idx
b=list(a[idx]['feature_idx'])
print(b)
print("#################################################################################")
print("Features selected in forward fit")
print(X.columns[b])
##    avg_score ci_bound                                          cv_scores  \
## 1   -42.6185  19.0465  [-23.5582499971, -41.8215743748, -73.993608929...
## 2   -36.0651  16.3184  [-18.002498199, -40.1507894517, -56.5286659068...
## 3   -34.1001    20.87  [-9.43012884381, -25.9584955394, -36.184188174...
## 4   -33.7681  20.1638  [-8.86076528781, -28.650217633, -35.7246353855...
## 5   -33.6392  20.5271  [-8.90807628524, -28.0684679108, -35.827463022...
## 6   -33.6276  19.0859  [-9.549485942, -30.9724602876, -32.6689523347,...
## 7   -32.1834  12.1001  [-17.9491036167, -39.6479234651, -45.470227740...
## 8   -32.0908  11.8179  [-17.4389015788, -41.2453629843, -44.247557798...
## 9   -31.0671  10.1581  [-17.2689542913, -37.4379370429, -41.366372300...
## 10  -28.9225  9.39697  [-18.562171585, -29.968504938, -39.9586835965,...
## 11  -29.4301  10.8831  [-18.3346152225, -30.3312847532, -45.065432793...
## 12  -30.4589  11.1486  [-18.493389527, -35.0290639374, -45.1558231765...
## 13  -37.1318  23.2657  [-12.4603005692, -26.0486211062, -33.074137979...
##
##                                    feature_idx  std_dev  std_err
## 1                                        (12,)  18.9042  9.45212
## 2                                     (10, 12)  16.1965  8.09826
## 3                                  (10, 12, 5)  20.7142  10.3571
## 4                               (10, 3, 12, 5)  20.0132  10.0066
## 5                            (0, 10, 3, 12, 5)  20.3738  10.1869
## 6                         (0, 3, 5, 7, 10, 12)  18.9433  9.47167
## 7                      (0, 1, 2, 3, 7, 10, 12)  12.0097  6.00487
## 8                   (0, 1, 2, 3, 7, 8, 10, 12)  11.7297  5.86484
## 9                (0, 1, 2, 3, 7, 8, 9, 10, 12)  10.0822  5.04111
## 10           (0, 1, 4, 6, 7, 8, 9, 10, 11, 12)   9.3268   4.6634
## 11        (0, 1, 3, 4, 6, 7, 8, 9, 10, 11, 12)  10.8018  5.40092
## 12     (0, 1, 2, 3, 4, 6, 7, 8, 9, 10, 11, 12)  11.0653  5.53265
## 13  (0, 1, 2, 3, 4, 5, 6, 7, 8, 9, 10, 11, 12)  23.0919   11.546
## No of features= 9
## [0, 1, 2, 3, 7, 8, 9, 10, 12]
## #################################################################################
## Features selected in forward fit
## Index([u'crimeRate', u'zone', u'indus', u'chasRiver', u'distances',
##        u'idxHighways', u'taxRate', u'teacherRatio', u'status'],
##       dtype='object')
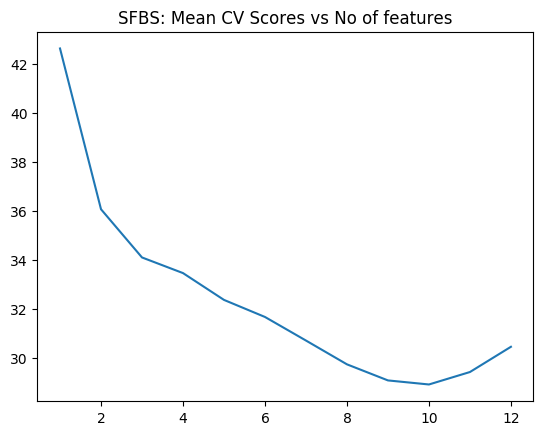
1.3d Sequential Floating Backward Selection (SFBS) – Python code
The SFBS is an extension of the SBS. Here features that are excluded at any stage can be conditionally included if the resulting feature set gives a better fit.
import numpy as np
import pandas as pd
import os
import matplotlib.pyplot as plt
from sklearn.model_selection import train_test_split
from sklearn.linear_model import LinearRegression
from sklearn.datasets import load_boston
from mlxtend.plotting import plot_sequential_feature_selection as plot_sfs
import matplotlib.pyplot as plt
from mlxtend.feature_selection import SequentialFeatureSelector as SFS
from sklearn.linear_model import LinearRegression
df = pd.read_csv("Boston.csv",encoding = "ISO-8859-1")
df.columns=["no","crimeRate","zone","indus","chasRiver","NO2","rooms","age",
"distances","idxHighways","taxRate","teacherRatio","color","status","cost"]
X=df[["crimeRate","zone","indus","chasRiver","NO2","rooms","age",
"distances","idxHighways","taxRate","teacherRatio","color","status"]]
y=df['cost']
lr = LinearRegression()
sffs = SFS(lr,
k_features=(1,13),
forward=False,
floating=True,
scoring='neg_mean_squared_error',
cv=5)
sffs = sffs.fit(X.as_matrix(), y.as_matrix())
a=sffs.get_metric_dict()
n=[]
o=[]
for i in np.arange(1,13):
n.append(-np.mean(a[i]['cv_scores']))
m=np.arange(1,13)
fig4=plt.plot(m,n)
fig4=plt.title('SFBS: Mean CV Scores vs No of features')
fig4.figure.savefig('fig4.png', bbox_inches='tight')
print(pd.DataFrame.from_dict(sffs.get_metric_dict(confidence_interval=0.90)).T)
idx = np.argmin(n)
print "No of features=",idx
b=list(a[idx]['feature_idx'])
print(b)
print("#################################################################################")
print("Features selected in backward floating fit")
print(X.columns[b])
##    avg_score ci_bound                                          cv_scores  \
## 1   -42.6185  19.0465  [-23.5582499971, -41.8215743748, -73.993608929...
## 2   -36.0651  16.3184  [-18.002498199, -40.1507894517, -56.5286659068...
## 3   -34.1001    20.87  [-9.43012884381, -25.9584955394, -36.184188174...
## 4    -33.463  12.4081  [-20.6415333292, -37.3247852146, -47.479302977...
## 5   -32.3699  11.2725  [-20.8771078371, -34.9825657934, -45.813447203...
## 6   -31.6742  11.2458  [-20.3082500364, -33.2288990522, -45.535507868...
## 7   -30.7133  9.23881  [-19.4425181917, -31.1742902259, -40.531266671...
## 8   -29.7432  9.84468  [-19.445277268, -30.0641187173, -40.2561247122...
## 9   -29.0878  9.45027  [-19.3545569877, -30.094768669, -39.7506036377...
## 10  -28.9225  9.39697  [-18.562171585, -29.968504938, -39.9586835965,...
## 11  -29.4301  10.8831  [-18.3346152225, -30.3312847532, -45.065432793...
## 12  -30.4589  11.1486  [-18.493389527, -35.0290639374, -45.1558231765...
## 13  -37.1318  23.2657  [-12.4603005692, -26.0486211062, -33.074137979...
##
##                                    feature_idx  std_dev  std_err
## 1                                        (12,)  18.9042  9.45212
## 2                                     (10, 12)  16.1965  8.09826
## 3                                  (10, 12, 5)  20.7142  10.3571
## 4                               (4, 10, 7, 12)  12.3154  6.15772
## 5                            (12, 10, 4, 1, 7)  11.1883  5.59417
## 6                        (4, 7, 8, 10, 11, 12)  11.1618  5.58088
## 7                      (1, 4, 7, 8, 9, 10, 12)  9.16981  4.58491
## 8                  (1, 4, 7, 8, 9, 10, 11, 12)  9.77116  4.88558
## 9               (0, 1, 4, 7, 8, 9, 10, 11, 12)  9.37969  4.68985
## 10           (0, 1, 4, 6, 7, 8, 9, 10, 11, 12)   9.3268   4.6634
## 11        (0, 1, 3, 4, 6, 7, 8, 9, 10, 11, 12)  10.8018  5.40092
## 12     (0, 1, 2, 3, 4, 6, 7, 8, 9, 10, 11, 12)  11.0653  5.53265
## 13  (0, 1, 2, 3, 4, 5, 6, 7, 8, 9, 10, 11, 12)  23.0919   11.546
## No of features= 9
## [0, 1, 4, 7, 8, 9, 10, 11, 12]
## #################################################################################
## Features selected in backward floating fit
## Index([u'crimeRate', u'zone', u'NO2', u'distances', u'idxHighways', u'taxRate',
##        u'teacherRatio', u'color', u'status'],
##       dtype='object')
1.4 Ridge regression
In Linear Regression the Residual Sum of Squares (RSS) is given as

Ridge regularization =
where is the regularization or tuning parameter. Increasing increases the penalty on the coefficients thus shrinking them. However in Ridge Regression features that do not influence the target variable will shrink closer to zero but never become zero except for very large values of
Ridge regression in R requires the ‘glmnet’ package
1.4a Ridge Regression – R code
library(glmnet)
library(dplyr)
df=read.csv("Boston.csv",stringsAsFactors = FALSE)
names(df) <-c("no","crimeRate","zone","indus","charles","nox","rooms","age",
"distances","highways","tax","teacherRatio","color","status","cost")
df1 <- df %>% dplyr::select("crimeRate","zone","indus","charles","nox","rooms","age",
"distances","highways","tax","teacherRatio","color","status","cost")
X=as.matrix(df1[,1:13])
y=df1$cost
fitRidge <-glmnet(X,y,alpha=0)
plot(fitRidge,xvar="lambda",label=TRUE,main= "Ridge regression coefficient shrikage vs log lambda")
![]() The plot below shows how the 13 coefficients for the 13 predictors vary when lambda is increased. The x-axis includes log (lambda). We can see that increasing lambda from
The plot below shows how the 13 coefficients for the 13 predictors vary when lambda is increased. The x-axis includes log (lambda). We can see that increasing lambda from  to
to  significantly shrinks the coefficients. We can draw a vertical line from the x-axis and read the values of the 13 coefficients. Some of them will be close to zero
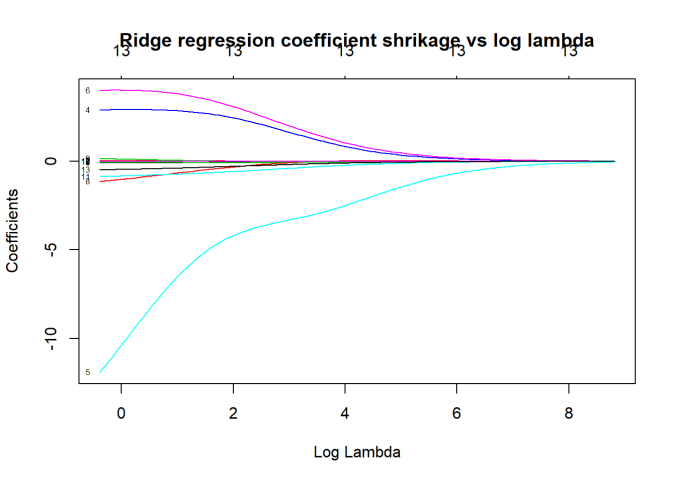
cvRidge=cv.glmnet(X,y,alpha=0)
plot(cvRidge, main="Ridge regression Cross Validation Error (10 fold)")
![]() This gives the 10 fold Cross Validation Error with respect to log (lambda) As lambda increase the MSE increases
This gives the 10 fold Cross Validation Error with respect to log (lambda) As lambda increase the MSE increases
1.4a Ridge Regression – Python code
The coefficient shrinkage for Python can be plotted like R using Least Angle Regression model a.k.a. LARS package. This is included below
import numpy as np
import pandas as pd
import os
import matplotlib.pyplot as plt
from sklearn.model_selection import train_test_split
df = pd.read_csv("Boston.csv",encoding = "ISO-8859-1")
df.columns=["no","crimeRate","zone","indus","chasRiver","NO2","rooms","age",
"distances","idxHighways","taxRate","teacherRatio","color","status","cost"]
X=df[["crimeRate","zone","indus","chasRiver","NO2","rooms","age",
"distances","idxHighways","taxRate","teacherRatio","color","status"]]
y=df['cost']
from sklearn.preprocessing import MinMaxScaler
scaler = MinMaxScaler()
from sklearn.linear_model import Ridge
X_train, X_test, y_train, y_test = train_test_split(X, y,
random_state = 0)
X_train_scaled = scaler.fit_transform(X_train)
X_test_scaled = scaler.transform(X_test)
linridge = Ridge(alpha=20.0).fit(X_train_scaled, y_train)
print('R-squared score (training): {:.3f}'
.format(linridge.score(X_train_scaled, y_train)))
print('R-squared score (test): {:.3f}'
.format(linridge.score(X_test_scaled, y_test)))
print('Number of non-zero features: {}'
.format(np.sum(linridge.coef_ != 0)))
trainingRsquared=[]
testRsquared=[]
print('Ridge regression: effect of alpha regularization parameter\n')
for this_alpha in [0.001,.01,.1,0, 1, 10, 20, 50, 100, 1000]:
linridge = Ridge(alpha = this_alpha).fit(X_train_scaled, y_train)
r2_train = linridge.score(X_train_scaled, y_train)
r2_test = linridge.score(X_test_scaled, y_test)
num_coeff_bigger = np.sum(abs(linridge.coef_) > 1.0)
trainingRsquared.append(r2_train)
testRsquared.append(r2_test)
alpha=[0.001,.01,.1,0, 1, 10, 20, 50, 100, 1000]
trainingRsquared=pd.DataFrame(trainingRsquared,index=alpha)
testRsquared=pd.DataFrame(testRsquared,index=alpha)
df3=pd.concat([trainingRsquared,testRsquared],axis=1)
df3.columns=['trainingRsquared','testRsquared']
fig5=df3.plot()
fig5=plt.title('Ridge training and test squared error vs Alpha')
fig5.figure.savefig('fig5.png', bbox_inches='tight')
from sklearn import linear_model
n_alphas = 200
alphas = np.logspace(0, 8, n_alphas)
coefs = []
for a in alphas:
ridge = linear_model.Ridge(alpha=a, fit_intercept=False)
ridge.fit(X_train_scaled, y_train)
coefs.append(ridge.coef_)
ax = plt.gca()
fig6=ax.plot(alphas, coefs)
fig6=ax.set_xscale('log')
fig6=ax.set_xlim(ax.get_xlim()[::-1])
fig6=plt.xlabel('alpha')
fig6=plt.ylabel('weights')
fig6=plt.title('Ridge coefficients as a function of the regularization')
fig6=plt.axis('tight')
plt.savefig('fig6.png', bbox_inches='tight')
## R-squared score (training): 0.620
## R-squared score (test): 0.438
## Number of non-zero features: 13
## Ridge regression: effect of alpha regularization parameter
![]()
![]() The plot below shows the training and test error when increasing the tuning or regularization parameter ‘alpha’
The plot below shows the training and test error when increasing the tuning or regularization parameter ‘alpha’
For Python the coefficient shrinkage with LARS must be viewed from right to left, where you have increasing alpha. As alpha increases the coefficients shrink to 0.
1.5 Lasso regularization
The Lasso is another form of regularization, also known as L1 regularization. Unlike the Ridge Regression where the coefficients of features which do not influence the target tend to zero, in the lasso regualrization the coefficients become 0. The general form of Lasso is as follows

1.5a Lasso regularization – R code
library(glmnet)
library(dplyr)
df=read.csv("Boston.csv",stringsAsFactors = FALSE)
names(df) <-c("no","crimeRate","zone","indus","charles","nox","rooms","age",
"distances","highways","tax","teacherRatio","color","status","cost")
df1 <- df %>% dplyr::select("crimeRate","zone","indus","charles","nox","rooms","age",
"distances","highways","tax","teacherRatio","color","status","cost")
X=as.matrix(df1[,1:13])
y=df1$cost
fitLasso <- glmnet(X,y)
plot(fitLasso,xvar="lambda",label=TRUE,main="Lasso regularization - Coefficient shrinkage vs log lambda")
![]() The plot below shows that in L1 regularization the coefficients actually become zero with increasing lambda
The plot below shows that in L1 regularization the coefficients actually become zero with increasing lambda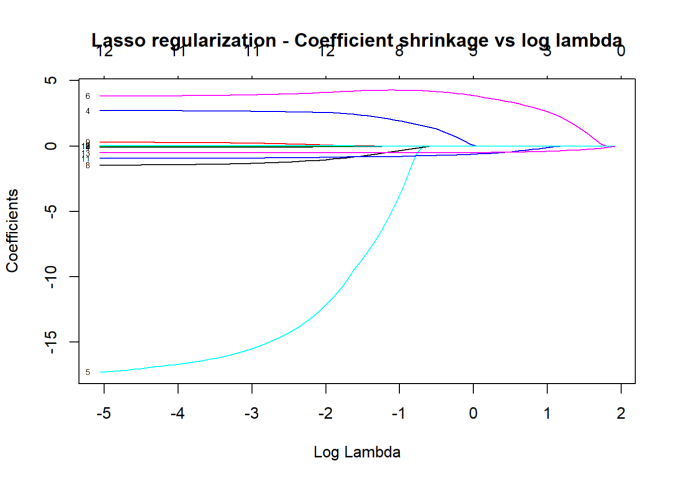
cvLasso=cv.glmnet(X,y,alpha=0)
plot(cvLasso)
![]() This gives the MSE for the lasso model
This gives the MSE for the lasso model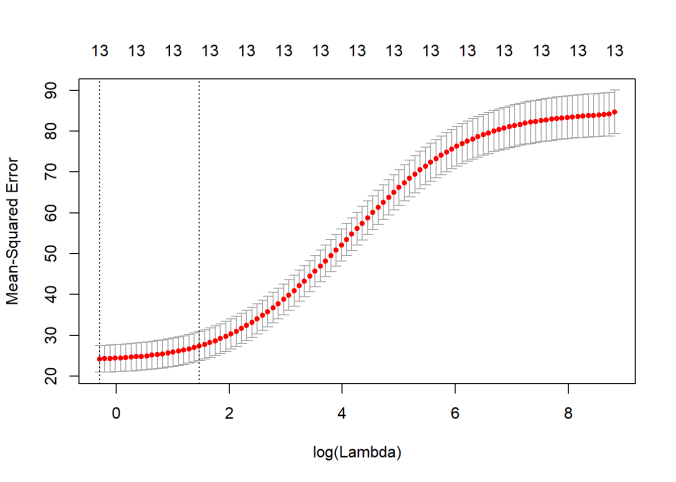
1.5 b Lasso regularization – Python code
import numpy as np
import pandas as pd
import os
import matplotlib.pyplot as plt
from sklearn.model_selection import train_test_split
from sklearn.linear_model import Lasso
from sklearn.preprocessing import MinMaxScaler
from sklearn import linear_model

scaler = MinMaxScaler()
df = pd.read_csv("Boston.csv",encoding = "ISO-8859-1")
#Rename the columns
df.columns=["no","crimeRate","zone","indus","chasRiver","NO2","rooms","age",
              "distances","idxHighways","taxRate","teacherRatio","color","status","cost"]
X=df[["crimeRate","zone","indus","chasRiver","NO2","rooms","age",
              "distances","idxHighways","taxRate","teacherRatio","color","status"]]
y=df['cost']
X_train, X_test, y_train, y_test = train_test_split(X, y,
                                                   random_state = 0)

X_train_scaled = scaler.fit_transform(X_train)
X_test_scaled = scaler.transform(X_test)

linlasso = Lasso(alpha=0.1, max_iter = 10).fit(X_train_scaled, y_train)

print('Non-zero features: {}'
     .format(np.sum(linlasso.coef_ != 0)))
print('R-squared score (training): {:.3f}'
     .format(linlasso.score(X_train_scaled, y_train)))
print('R-squared score (test): {:.3f}\n'
     .format(linlasso.score(X_test_scaled, y_test)))
print('Features with non-zero weight (sorted by absolute magnitude):')

for e in sorted (list(zip(list(X), linlasso.coef_)),
                key = lambda e: -abs(e[1])):
    if e[1] != 0:
        print('\t{}, {:.3f}'.format(e[0], e[1]))


print('Lasso regression: effect of alpha regularization\n\
parameter on number of features kept in final model\n')

trainingRsquared=[]
testRsquared=[]
#for alpha in [0.01,0.05,0.1, 1, 2, 3, 5, 10, 20, 50]:
for alpha in [0.01,0.07,0.05, 0.1, 1,2, 3, 5, 10]:
    linlasso = Lasso(alpha, max_iter = 10000).fit(X_train_scaled, y_train)
    r2_train = linlasso.score(X_train_scaled, y_train)
    r2_test = linlasso.score(X_test_scaled, y_test)
    trainingRsquared.append(r2_train)
    testRsquared.append(r2_test)

alpha=[0.01,0.07,0.05, 0.1, 1,2, 3, 5, 10]
#alpha=[0.01,0.05,0.1, 1, 2, 3, 5, 10, 20, 50]
trainingRsquared=pd.DataFrame(trainingRsquared,index=alpha)
testRsquared=pd.DataFrame(testRsquared,index=alpha)

df3=pd.concat([trainingRsquared,testRsquared],axis=1)
df3.columns=['trainingRsquared','testRsquared']

fig7=df3.plot()
fig7=plt.title('LASSO training and test squared error vs Alpha')
fig7.figure.savefig('fig7.png', bbox_inches='tight')
## Non-zero features: 7
## R-squared score (training): 0.726
## R-squared score (test): 0.561
##
## Features with non-zero weight (sorted by absolute magnitude):
##  status, -18.361
##  rooms, 18.232
##  teacherRatio, -8.628
##  taxRate, -2.045
##  color, 1.888
##  chasRiver, 1.670
##  distances, -0.529
## Lasso regression: effect of alpha regularization
## parameter on number of features kept in final model
##
## Computing regularization path using the LARS ...
## .C:\Users\Ganesh\ANACON~1\lib\site-packages\sklearn\linear_model\coordinate_descent.py:484: ConvergenceWarning: Objective did not converge. You might want to increase the number of iterations. Fitting data with very small alpha may cause precision problems.
##   ConvergenceWarning)
1.5c Lasso coefficient shrinkage – Python code
To plot the coefficient shrinkage for Lasso the Least Angle Regression model a.k.a. LARS package. This is shown below
import numpy as np
import pandas as pd
import os
import matplotlib.pyplot as plt
from sklearn.model_selection import train_test_split
from sklearn.linear_model import Lasso
from sklearn.preprocessing import MinMaxScaler
from sklearn import linear_model
scaler = MinMaxScaler()
df = pd.read_csv("Boston.csv",encoding = "ISO-8859-1")
df.columns=["no","crimeRate","zone","indus","chasRiver","NO2","rooms","age",
"distances","idxHighways","taxRate","teacherRatio","color","status","cost"]
X=df[["crimeRate","zone","indus","chasRiver","NO2","rooms","age",
"distances","idxHighways","taxRate","teacherRatio","color","status"]]
y=df['cost']
X_train, X_test, y_train, y_test = train_test_split(X, y,
random_state = 0)
X_train_scaled = scaler.fit_transform(X_train)
X_test_scaled = scaler.transform(X_test)
print("Computing regularization path using the LARS ...")
alphas, _, coefs = linear_model.lars_path(X_train_scaled, y_train, method='lasso', verbose=True)
xx = np.sum(np.abs(coefs.T), axis=1)
xx /= xx[-1]
fig8=plt.plot(xx, coefs.T)
ymin, ymax = plt.ylim()
fig8=plt.vlines(xx, ymin, ymax, linestyle='dashed')
fig8=plt.xlabel('|coef| / max|coef|')
fig8=plt.ylabel('Coefficients')
fig8=plt.title('LASSO Path - Coefficient Shrinkage vs L1')
fig8=plt.axis('tight')
plt.savefig('fig8.png', bbox_inches='tight')
This 3rd part of the series covers the main ‘feature selection’ methods. I hope these posts serve as a quick and useful reference to ML code both for R and Python!
Stay tuned for further updates to this series!
Watch this space!
You may also like
1. Natural language processing: What would Shakespeare say?
2. Introducing QCSimulator: A 5-qubit quantum computing simulator in R
3. GooglyPlus: yorkr analyzes IPL players, teams, matches with plots and tables
4. My travels through the realms of Data Science, Machine Learning, Deep Learning and (AI)
5. Experiments with deblurring using OpenCV
6. R vs Python: Different similarities and similar differences
To see all posts see Index of posts


 scales the dot product so that the dot product values are not overly large


 and
and  are the weight matrices, and
  and
and  are the biases
  x
x  and
and x
x  and
and  is the activation function which can be ReLU, GELU or SwiGLU

 ,
,  ,
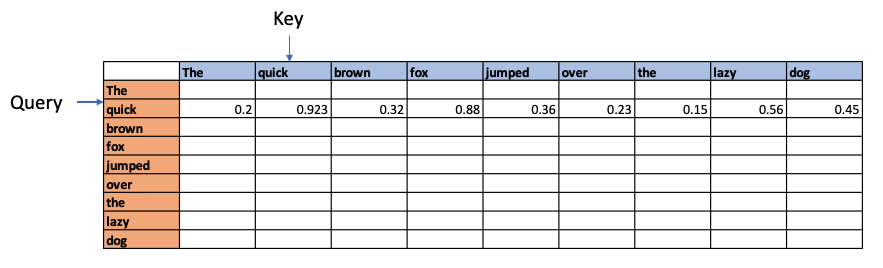
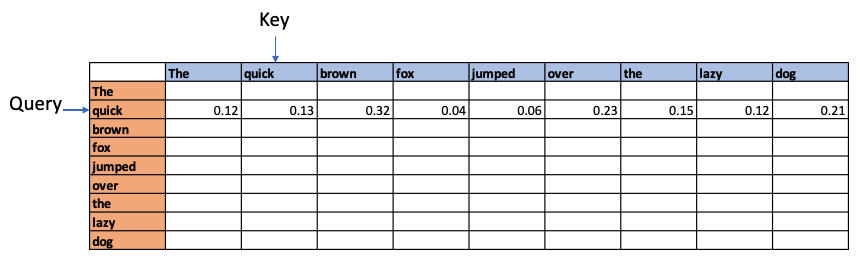
,  . By multiplyting these matrices with the input vectors we get Q,K and V vectors. The attention is computed as


 ,
, 


 = 64
= 64
 Checkout my book ‘Deep Learning from first principles: Second Edition – In vectorized Python, R and Octave’. My book starts with the implementation of a simple 2-layer Neural Network and works its way to a generic L-Layer Deep Learning Network, with all the bells and whistles. The derivations have been discussed in detail. The code has been extensively commented and included in its entirety in the Appendix sections. My book is available on Amazon as


 In this book I implement some of the most common, but important Machine Learning algorithms in R and equivalent Python code.
 ML models have to be searched. This can be shown as follows
 ways to choose single feature ML models among ‘n’ features,
  ways to choose 2 feature models among ‘n’ models and so on, or


 models to search amongst in Best Fit. For 10 features this is
  or ~1000 models and for 40 features this becomes
  which almost 1 trillion. Usually there are datasets with 1000 or maybe even 100000 features and Best fit becomes computationally infeasible.
 models


 Then felt I like some watcher of the skies