Introduction
He will win, who knows when to fight and when not to fight.
He will win, who knows how to handle both superior and inferior forces
If you know neither the enemy nor yourself, you will succumb in every battle.
Hence the skilful fighter puts himself in a position which makes defeat impossible, and does not miss the moment for defeating the enemy.
Hence that general is skillful in attack whose opponent does not know what to defend; and he is skilled in defense whose opponent does know what to attack.
The Art of War - Sun Tzu
This post is a continuation of my introduction to my latest cricket package yorkr. This is the 3rd part of the introduction, the 2 earlier ones were
- Introducing cricket package yorkr-Part1:Beaten by sheer pace!.
- Introducing cricket package yorkr: Part 2-Trapped leg before wicket!
This post deals with Class 3 functions, namely the performances of a team in all matches against all oppositions for e.g India/Australia/South Africa against all oppositions in all matches. In other words it is the performance of the team against the rest of the world.
If you are passionate about cricket, and love analyzing cricket performances, then check out my 2 racy books on cricket! In my books, I perform detailed yet compact analysis of performances of both batsmen, bowlers besides evaluating team & match performances in Tests , ODIs, T20s & IPL. You can buy my books on cricket from Amazon at $12.99 for the paperback and $4.99/$6.99 respectively for the kindle versions. The books can be accessed at Cricket analytics with cricketr and Beaten by sheer pace-Cricket analytics with yorkr A must read for any cricket lover! Check it out!!
This post has also been published at RPubs yorkr-Part3 and can also be downloaded as a PDF document from yorkr-Part3.pdf.
You can clone/fork the code for the package yorkr from Github at yorkr-package
Checkout my interactive Shiny apps GooglyPlus (plots & tables) and Googly (only plots) which can be used to analyze IPL players, teams and matches.
Important note 1: Do check out all the posts on the python avatar of yorkr, namely ‘yorkpy’ in my post ‘Pitching yorkpy … short of good length to IPL – Part 1
The list of functions in Class 3 are
- teamBattingScorecardAllOppnAllMatches()
- teamBatsmenPartnershipAllOppnAllMatches()
- teamBatsmenPartnershipAllOppnAllMatchesPlot()
- teamBatsmenVsBowlersAllOppnAllMatchesRept()
- teamBatsmenVsBowlersAllOppnAllMatchesPlot()
- teamBowlingScorecardAllOppnAllMatchesMain()
- teamBowlersVsBatsmenAllOppnAllMatchesRept()
- teamBowlersVsBatsmenAllOppnAllMatchesPlot()
- teamBowlingWicketKindAllOppnAllMatches()
- teamBowlingWicketRunsAllOppnAllMatches()
Note 1: The yorkr package in its current avatar supports ODI, T20 and IPL T20 matches.
Note 2: As in the previous parts the plots usually have the plot=TRUE/FALSE parameter. This is to allow the user to get a return value of the desired dataframe. The user can choose to plot this, in any way he/she likes for e.g in interactive charts using rcharts, ggvis,googleVis,plotly etc
1. Install the package from CRAN
The yorkr package can be installed directly from CRAN now! Install the yorkr package.
if (!require("yorkr")) {
  install.packages("yorkr")
  library("yorkr")
}
rm(list=ls())
2. Get data for all matches against all oppositions for a team
We can get all matches against all oppositions for a team/country using the function below. The dir parameter should point to the folder in which the RData files of the individual matches exist. This function creates a data frame of all the matches and also saves the resulting dataframe as RData
setwd("C:/software/cricket-package/york-test/yorkrData/ODI/ODI-team-allmatches-allOppositions")
matches <-getAllMatchesAllOpposition("India",dir=".",save=TRUE)
dim(matches)
## [1] 140655 25
“`
3. Save data for all matches against all oppositions
This can be done locally using the function below. This function gets all the matches of the country/team against all other countrioes//teams and combines them into a single dataframe and saves it in the current folder. The current implementation expects that the the RData files of individual matches are in ../data folder. Since I already have converted this I will not be running this again
4. Load data directly for all matches between 2 teams
As in my earlier posts (yorkr-Part1 & yorkr-Part2) I have however already saved the data, for all matches of the individual countries, against all oppositons. The data for these matches for the individual teams/countries can be downloaded directly from Github folder at ODI-team-allmatches-allOppositions
Note: The dataframe for the different for all the matches of a country agaisnt all oppositons can be loaded directly into your code. As can be seen in the calls below the datframes are ~100,000+ rows x 25 columns. While I have 10+ functions to process these dataframes, for a particular team, feel free to download these data frames and perform your own analysis. The data frames include ball-by-ball details, details on non-striker, bowler, runs, extras, venue,date etc. Certainly these data frames are a gold-mine of interesting insights. So do go ahead and unleash your bagging/boosting algorithms, SVM classifiers or Random Forest algorithm on them.
I plan to try out some algorithms of statistical/machine learning in the months to come. If you do come up with interesting insights, I would appreciate if attribute the source to Cricsheet(http://cricsheet.org), and my package yorkr and my blog Giga thoughts, besides dropping me a note.*
As in my earlier post I will be directly loading the saved files. For the illustration of the functions, I will use India in all the functions, (for obvious reasons) and will randomly use the data from the rest of the top 8 teams
setwd("C:/software/cricket-package/york-test/yorkrData/ODI/ODI-team-allmatches-allOppositions")
load("allMatchesAllOpposition-India.RData")
ind_matches <- matches
dim(ind_matches)
## [1] 140655 25
load("allMatchesAllOpposition-Australia.RData")
aus_matches <- matches
dim(aus_matches)
## [1] 128148 25
load("allMatchesAllOpposition-New Zealand.RData")
nz_matches <- matches
dim(nz_matches)
## [1] 98573 25
load("allMatchesAllOpposition-Pakistan.RData")
pak_matches <- matches
dim(pak_matches)
## [1] 117947 25
load("allMatchesAllOpposition-England.RData")
eng_matches <- matches
dim(eng_matches)
## [1] 118859 25
load("allMatchesAllOpposition-Sri Lanka.RData")
sl_matches <- matches
dim(sl_matches)
## [1] 125893 25
load("allMatchesAllOpposition-West Indies.RData")
wi_matches <- matches
dim(wi_matches)
## [1] 92716 25
load("allMatchesAllOpposition-South Africa.RData")
sa_matches <- matches
dim(sa_matches)
## [1] 100916 25
5. Team Batting Scorecard (all matches with opposition)
The following functions shows the batting scorecards in each country. It returns a dataframe with the top batsmen in each country
m <-teamBattingScorecardAllOppnAllMatches(ind_matches,theTeam="India")
## Total= 58079
## Source: local data frame [68 x 5]
##
##         batsman ballsPlayed fours sixes  runs
##          (fctr)       (int) (int) (int) (dbl)
## 1       V Kohli        7774   663    67  7039
## 2      MS Dhoni        7878   515   129  6885
## 3      SK Raina        5076   429   114  4964
## 4     G Gambhir        5138   472    15  4503
## 5     RG Sharma        5245   372    89  4385
## 6  SR Tendulkar        4708   504    43  4196
## 7  Yuvraj Singh        4472   403    96  3976
## 8      V Sehwag        3106   494    74  3681
## 9      S Dhawan        2956   314    37  2694
## 10    AM Rahane        2490   195    24  2009
## ..          ...         ...   ...   ...   ...
m <-teamBattingScorecardAllOppnAllMatches(aus_matches,theTeam="Australia")
## Total= 54736
## Source: local data frame [70 x 5]
##
##       batsman ballsPlayed fours sixes  runs
##        (fctr)       (int) (int) (int) (dbl)
## 1   MJ Clarke        7060   440    39  5485
## 2   SR Watson        5435   519   114  5035
## 3  RT Ponting        5301   447    43  4440
## 4  MEK Hussey        4990   286    60  4286
## 5   BJ Haddin        3308   266    69  2858
## 6   DA Warner        2701   264    43  2537
## 7   GJ Bailey        2805   176    43  2392
## 8   SPD Smith        2303   174    19  2082
## 9    CL White        2471   142    44  2018
## 10  ML Hayden        2276   219    37  2002
## ..        ...         ...   ...   ...   ...
m <-teamBattingScorecardAllOppnAllMatches(pak_matches,theTeam="Pakistan")
## Total= NA
## Source: local data frame [74 x 5]
##
##            batsman ballsPlayed fours sixes  runs
##             (fctr)       (int) (int) (int) (dbl)
## 1  Mohammad Hafeez        5714   471    71  4574
## 2      Younis Khan        4561   306    24  3465
## 3    Shahid Afridi        2316   264   132  3125
## 4     Shoaib Malik        3472   240    40  2897
## 5       Umar Akmal        3272   241    47  2843
## 6    Ahmed Shehzad        3386   259    18  2491
## 7  Mohammad Yousuf        2933   191    11  2241
## 8     Kamran Akmal        2533   247    25  2104
## 9      Salman Butt        2037   206     6  1653
## 10   Nasir Jamshed        1862   150    19  1418
## ..             ...         ...   ...   ...   ...
m <-teamBattingScorecardAllOppnAllMatches(nz_matches,theTeam="New Zealand")
## Total= 39993
## Source: local data frame [68 x 5]
##
##          batsman ballsPlayed fours sixes  runs
##           (fctr)       (int) (int) (int) (dbl)
## 1    LRPL Taylor        6153   418   103  5120
## 2    BB McCullum        4321   446   159  4489
## 3     MJ Guptill        5205   462   100  4460
## 4  KS Williamson        4044   325    25  3418
## 5      SB Styris        2324   167    23  1944
## 6     GD Elliott        2274   149    26  1889
## 7       JD Ryder        1232   139    33  1223
## 8       JDP Oram        1174    81    48  1195
## 9     DL Vettori        1238    97     8  1130
## 10      L Ronchi         927   108    32  1070
## ..           ...         ...   ...   ...   ...
m <-teamBattingScorecardAllOppnAllMatches(eng_matches,theTeam="England")
## Total= 48152
## Source: local data frame [72 x 5]
##
##           batsman ballsPlayed fours sixes  runs
##            (fctr)       (int) (int) (int) (dbl)
## 1         IR Bell        6401   488    31  5051
## 2      EJG Morgan        4249   323    98  3927
## 3    KP Pietersen        3828   315    44  3231
## 4         AN Cook        4052   360    10  3163
## 5  PD Collingwood        3693   213    48  2992
## 6       IJL Trott        3418   205     3  2653
## 7       RS Bopara        3326   202    32  2624
## 8      AJ Strauss        3062   276    20  2566
## 9         JE Root        2983   200    26  2543
## 10     JC Buttler        1467   155    54  1777
## ..            ...         ...   ...   ...   ...
m <-teamBattingScorecardAllOppnAllMatches(wi_matches,theTeam="West Indies")
## Total= 34622
## Source: local data frame [65 x 5]
##
##          batsman ballsPlayed fours sixes  runs
##           (fctr)       (int) (int) (int) (dbl)
## 1       CH Gayle        3839   386   144  3635
## 2     MN Samuels        4057   294    72  3062
## 3  S Chanderpaul        3521   188    28  2469
## 4       DJ Bravo        2804   193    49  2390
## 5       DM Bravo        2916   174    41  2051
## 6      RR Sarwan        2682   172    20  1960
## 7     KA Pollard        2064   127    92  1947
## 8    LMP Simmons        2538   157    46  1863
## 9      DJG Sammy        1799   143    83  1835
## 10      D Ramdin        1817   115    23  1516
## ..           ...         ...   ...   ...   ...
m <-teamBattingScorecardAllOppnAllMatches(sl_matches,theTeam="Sri Lanka")
## Total= NA
## Source: local data frame [60 x 5]
##
##             batsman ballsPlayed fours sixes  runs
##              (fctr)       (int) (int) (int) (dbl)
## 1     KC Sangakkara       10449   852    64  8778
## 2        TM Dilshan        8838   914    45  7981
## 3  DPMD Jayawardene        7482   599    43  6260
## 4       WU Tharanga        5690   483    24  4232
## 5        AD Mathews        4383   288    59  3764
## 6     ST Jayasuriya        2266   297    61  2396
## 7   HDRL Thirimanne        3286   192    17  2371
## 8      LD Chandimal        3026   165    27  2308
## 9   KMDN Kulasekara        1406    83    37  1204
## 10      NLTC Perera        1007    90    42  1137
## ..              ...         ...   ...   ...   ...
6. Team Batting Scorecard
The following functions show the best batsmen from the opposition ‘theTeam’ in the ‘matches’. For e.g. when the matches=ind_matches and theTeam=“England” then the returned dataframe shows the best English batsmen against India
m <-teamBattingScorecardAllOppnAllMatches(matches=ind_matches,theTeam="England")
## Total= 7620
## Source: local data frame [43 x 5]
##
##           batsman ballsPlayed fours sixes  runs
##            (fctr)       (int) (int) (int) (dbl)
## 1         IR Bell        1238   110     9  1085
## 2    KP Pietersen         990    89    10   847
## 3         AN Cook        1049   103     2   822
## 4       RS Bopara         632    42     8   534
## 5  PD Collingwood         450    39     6   397
## 6         OA Shah         394    40     7   385
## 7       IJL Trott         410    33     2   349
## 8         JE Root         408    32     4   336
## 9        SR Patel         336    25    10   329
## 10   C Kieswetter         309    34    13   313
## ..            ...         ...   ...   ...   ...
m <-teamBattingScorecardAllOppnAllMatches(matches=ind_matches,theTeam="Australia")
## Total= 9995
## Source: local data frame [47 x 5]
##
##       batsman ballsPlayed fours sixes  runs
##        (fctr)       (int) (int) (int) (dbl)
## 1  RT Ponting        1107    86     8   876
## 2  MEK Hussey         816    56     5   753
## 3   GJ Bailey         578    51    13   614
## 4   SR Watson         653    81    10   609
## 5   MJ Clarke         786    45     5   607
## 6   ML Hayden         660    72     8   573
## 7   A Symonds         543    43    15   536
## 8    AJ Finch         617    52     9   525
## 9   SPD Smith         431    44     7   467
## 10  DA Warner         385    40     6   391
## ..        ...         ...   ...   ...   ...
m <-teamBattingScorecardAllOppnAllMatches(aus_matches,theTeam="New Zealand")
## Total= 6106
## Source: local data frame [44 x 5]
##
##        batsman ballsPlayed fours sixes  runs
##         (fctr)       (int) (int) (int) (dbl)
## 1  LRPL Taylor        1012    71    13   804
## 2  BB McCullum         768    71    25   761
## 3   MJ Guptill         618    50    17   485
## 4    PG Fulton         526    35     9   425
## 5   GD Elliott         469    29     4   405
## 6    SB Styris         415    36     5   369
## 7   DL Vettori         334    24     2   291
## 8    L Vincent         338    27     5   272
## 9  CD McMillan         227    28    10   266
## 10    JDP Oram         181    13     7   193
## ..         ...         ...   ...   ...   ...
m <-teamBattingScorecardAllOppnAllMatches(wi_matches,theTeam="Sri Lanka")
## Total= 1851
## Source: local data frame [28 x 5]
##
##             batsman ballsPlayed fours sixes  runs
##              (fctr)       (int) (int) (int) (dbl)
## 1  DPMD Jayawardene         330    26     2   288
## 2     KC Sangakkara         326    16     2   238
## 3        TM Dilshan         173    18     7   224
## 4       WU Tharanga         349    22    NA   220
## 5        AD Mathews         171    10     3   161
## 6     ST Jayasuriya         146    19     4   160
## 7       ML Udawatte         138     8     1    87
## 8   HDRL Thirimanne         144     6    NA    67
## 9       MDKJ Perera          63     4     2    64
## 10    CK Kapugedera          68     2    NA    57
## ..              ...         ...   ...   ...   ...
7. Team Batting Partnerships
This gives the top batting partnerships in each team in all its matches against all oppositions. The report can either be a ‘summary’ or a ‘detailed’ breakup of the batting partnerships.
m <- teamBatsmenPartnershipAllOppnAllMatches(ind_matches,theTeam='India')
m
## Source: local data frame [68 x 2]
##
##         batsman totalRuns
##          (fctr)     (dbl)
## 1       V Kohli      7039
## 2      MS Dhoni      6885
## 3      SK Raina      4964
## 4     G Gambhir      4503
## 5     RG Sharma      4385
## 6  SR Tendulkar      4196
## 7  Yuvraj Singh      3976
## 8      V Sehwag      3681
## 9      S Dhawan      2694
## 10    AM Rahane      2009
## ..          ...       ...
m <- teamBatsmenPartnershipAllOppnAllMatches(matches,theTeam='India',report="detailed")
head(m,30)
##     batsman      nonStriker partnershipRuns totalRuns
## 1   V Kohli        S Dhawan             661      7039
## 2   V Kohli       AM Rahane             502      7039
## 3   V Kohli       RG Sharma            1073      7039
## 4   V Kohli      KD Karthik             139      7039
## 5   V Kohli    SR Tendulkar             278      7039
## 6   V Kohli        R Dravid             132      7039
## 7   V Kohli        V Sehwag             255      7039
## 8   V Kohli    Yuvraj Singh             420      7039
## 9   V Kohli        SK Raina            1072      7039
## 10  V Kohli        MS Dhoni             534      7039
## 11  V Kohli Harbhajan Singh              13      7039
## 12  V Kohli       IK Pathan               1      7039
## 13  V Kohli       G Gambhir             962      7039
## 14  V Kohli      RV Uthappa              10      7039
## 15  V Kohli       RA Jadeja              91      7039
## 16  V Kohli        R Ashwin              71      7039
## 17  V Kohli       AT Rayudu             345      7039
## 18  V Kohli Gurkeerat Singh               1      7039
## 19  V Kohli       YK Pathan              68      7039
## 20  V Kohli       STR Binny               4      7039
## 21  V Kohli       MK Tiwary             111      7039
## 22  V Kohli        AR Patel              39      7039
## 23  V Kohli        PA Patel             180      7039
## 24  V Kohli         M Vijay              33      7039
## 25  V Kohli       KM Jadhav              10      7039
## 26  V Kohli        AM Nayar              25      7039
## 27  V Kohli     S Badrinath               9      7039
## 28 MS Dhoni        S Dhawan              49      6885
## 29 MS Dhoni       AM Rahane              50      6885
## 30 MS Dhoni       RG Sharma             300      6885
9. More Team Batting Partnerships
When we use the dataframe ind_matches (matches of India against all opoositions) and choose another country in the theTeam then we will get the names of those top batsmen against India.
m <- teamBatsmenPartnershipAllOppnAllMatches(ind_matches,theTeam='England')
m
## Source: local data frame [43 x 2]
##
##           batsman totalRuns
##            (fctr)     (dbl)
## 1         IR Bell      1085
## 2    KP Pietersen       847
## 3         AN Cook       822
## 4       RS Bopara       534
## 5  PD Collingwood       397
## 6         OA Shah       385
## 7       IJL Trott       349
## 8         JE Root       336
## 9        SR Patel       329
## 10   C Kieswetter       313
## ..            ...       ...
m <- teamBatsmenPartnershipAllOppnAllMatches(ind_matches,theTeam='South Africa', report="detailed")
m[1:30,]
##           batsman       nonStriker partnershipRuns totalRuns
## 1  AB de Villiers       MN van Wyk              30      1179
## 2  AB de Villiers        JH Kallis             207      1179
## 3  AB de Villiers         HH Gibbs              20      1179
## 4  AB de Villiers        JP Duminy             168      1179
## 5  AB de Villiers       MV Boucher              37      1179
## 6  AB de Villiers          JM Kemp               5      1179
## 7  AB de Villiers      AN Petersen               8      1179
## 8  AB de Villiers       WD Parnell              56      1179
## 9  AB de Villiers         DW Steyn               5      1179
## 10 AB de Villiers    CK Langeveldt              19      1179
## 11 AB de Villiers          HM Amla              26      1179
## 12 AB de Villiers         GC Smith             106      1179
## 13 AB de Villiers     F du Plessis             133      1179
## 14 AB de Villiers        Q de Kock             113      1179
## 15 AB de Villiers        DA Miller             103      1179
## 16 AB de Villiers      F Behardien              64      1179
## 17 AB de Villiers        CH Morris              32      1179
## 18 AB de Villiers      AM Phangiso              37      1179
## 19 AB de Villiers       SM Pollock              10      1179
## 20        HM Amla       MN van Wyk              66       704
## 21        HM Amla   AB de Villiers               9       704
## 22        HM Amla        JH Kallis              88       704
## 23        HM Amla         HH Gibbs              10       704
## 24        HM Amla        JP Duminy              79       704
## 25        HM Amla        LE Bosman              43       704
## 26        HM Amla RE van der Merwe              17       704
## 27        HM Amla         GC Smith              92       704
## 28        HM Amla     F du Plessis              45       704
## 29        HM Amla      RJ Peterson               2       704
## 30        HM Amla        Q de Kock             211       704
10. Team Batting partnerships of other countries
m <- teamBatsmenPartnershipAllOppnAllMatches(eng_matches,theTeam='India',report="detailed")
head(m,30)
##     batsman    nonStriker partnershipRuns totalRuns
## 1  MS Dhoni     G Gambhir               6      1083
## 2  MS Dhoni      R Dravid              59      1083
## 3  MS Dhoni     PP Chawla               1      1083
## 4  MS Dhoni        Z Khan               4      1083
## 5  MS Dhoni      RP Singh              26      1083
## 6  MS Dhoni  Yuvraj Singh             157      1083
## 7  MS Dhoni      RR Powar              15      1083
## 8  MS Dhoni    RV Uthappa              29      1083
## 9  MS Dhoni     AM Rahane               1      1083
## 10 MS Dhoni       V Kohli              28      1083
## 11 MS Dhoni      SK Raina             372      1083
## 12 MS Dhoni       P Kumar              42      1083
## 13 MS Dhoni R Vinay Kumar              12      1083
## 14 MS Dhoni      R Ashwin              27      1083
## 15 MS Dhoni     RA Jadeja             238      1083
## 16 MS Dhoni     AT Rayudu              17      1083
## 17 MS Dhoni     STR Binny              41      1083
## 18 MS Dhoni     YK Pathan               8      1083
## 19 SK Raina     G Gambhir              23       918
## 20 SK Raina      R Dravid               1       918
## 21 SK Raina      MS Dhoni             450       918
## 22 SK Raina  Yuvraj Singh              56       918
## 23 SK Raina     AM Rahane              17       918
## 24 SK Raina       V Kohli             144       918
## 25 SK Raina     RG Sharma              58       918
## 26 SK Raina     MK Tiwary              28       918
## 27 SK Raina      R Ashwin              15       918
## 28 SK Raina     RA Jadeja              59       918
## 29 SK Raina     AT Rayudu              61       918
## 30 SK Raina      V Sehwag               6       918
m <- teamBatsmenPartnershipAllOppnAllMatches(sa_matches,theTeam='South Africa', report="detailed")
head(m,30)
##           batsman       nonStriker partnershipRuns totalRuns
## 1  AB de Villiers         GC Smith             957      7693
## 2  AB de Villiers        JH Kallis             897      7693
## 3  AB de Villiers         HH Gibbs             295      7693
## 4  AB de Villiers       MV Boucher             143      7693
## 5  AB de Villiers          JM Kemp               8      7693
## 6  AB de Villiers       SM Pollock              16      7693
## 7  AB de Villiers    CK Langeveldt              19      7693
## 8  AB de Villiers          HM Amla            1437      7693
## 9  AB de Villiers        JP Duminy            1123      7693
## 10 AB de Villiers        JA Morkel             169      7693
## 11 AB de Villiers          J Botha              27      7693
## 12 AB de Villiers        Q de Kock             248      7693
## 13 AB de Villiers     F du Plessis             667      7693
## 14 AB de Villiers        DA Miller             571      7693
## 15 AB de Villiers        R McLaren             120      7693
## 16 AB de Villiers         DW Steyn              32      7693
## 17 AB de Villiers      AM Phangiso              37      7693
## 18 AB de Villiers         M Morkel              21      7693
## 19 AB de Villiers       WD Parnell              83      7693
## 20 AB de Villiers      F Behardien             223      7693
## 21 AB de Villiers     VD Philander              12      7693
## 22 AB de Villiers       RR Rossouw              90      7693
## 23 AB de Villiers      RJ Peterson               5      7693
## 24 AB de Villiers      AN Petersen             132      7693
## 25 AB de Villiers       MN van Wyk              89      7693
## 26 AB de Villiers        CH Morris              32      7693
## 27 AB de Villiers        KJ Abbott              21      7693
## 28 AB de Villiers          D Elgar              54      7693
## 29 AB de Villiers RE van der Merwe               1      7693
## 30 AB de Villiers        CA Ingram             138      7693
m <- teamBatsmenPartnershipAllOppnAllMatches(sl_matches,theTeam='Sri Lanka',report="summary")
m
## Source: local data frame [60 x 2]
##
##             batsman totalRuns
##              (fctr)     (dbl)
## 1     KC Sangakkara      8778
## 2        TM Dilshan      7981
## 3  DPMD Jayawardene      6260
## 4       WU Tharanga      4232
## 5        AD Mathews      3764
## 6     ST Jayasuriya      2396
## 7   HDRL Thirimanne      2371
## 8      LD Chandimal      2308
## 9   KMDN Kulasekara      1204
## 10      NLTC Perera      1137
## ..              ...       ...
m <- teamBatsmenPartnershipAllOppnAllMatches(eng_matches,theTeam='England',report="summary")
m
## Source: local data frame [72 x 2]
##
##           batsman totalRuns
##            (fctr)     (dbl)
## 1         IR Bell      5051
## 2      EJG Morgan      3927
## 3    KP Pietersen      3231
## 4         AN Cook      3163
## 5  PD Collingwood      2992
## 6       IJL Trott      2653
## 7       RS Bopara      2624
## 8      AJ Strauss      2566
## 9         JE Root      2543
## 10     JC Buttler      1777
## ..            ...       ...
m <- teamBatsmenPartnershipAllOppnAllMatches(wi_matches,theTeam='Australia',report="summary")
m
## Source: local data frame [39 x 2]
##
##       batsman totalRuns
##        (fctr)     (dbl)
## 1   SR Watson       851
## 2  MEK Hussey       630
## 3  RT Ponting       503
## 4   MJ Clarke       435
## 5   GJ Bailey       341
## 6   A Symonds       252
## 7    SE Marsh       245
## 8   BJ Haddin       220
## 9   DJ Hussey       211
## 10   AC Voges       209
## ..        ...       ...
m <- teamBatsmenPartnershipAllOppnAllMatches(nz_matches,theTeam='England',report="summary")
m
## Source: local data frame [47 x 2]
##
##           batsman totalRuns
##            (fctr)     (dbl)
## 1         IR Bell       654
## 2         JE Root       612
## 3  PD Collingwood       514
## 4      EJG Morgan       479
## 5         AN Cook       464
## 6       IJL Trott       362
## 7    KP Pietersen       358
## 8      JC Buttler       287
## 9         OA Shah       274
## 10      RS Bopara       222
## ..            ...       ...
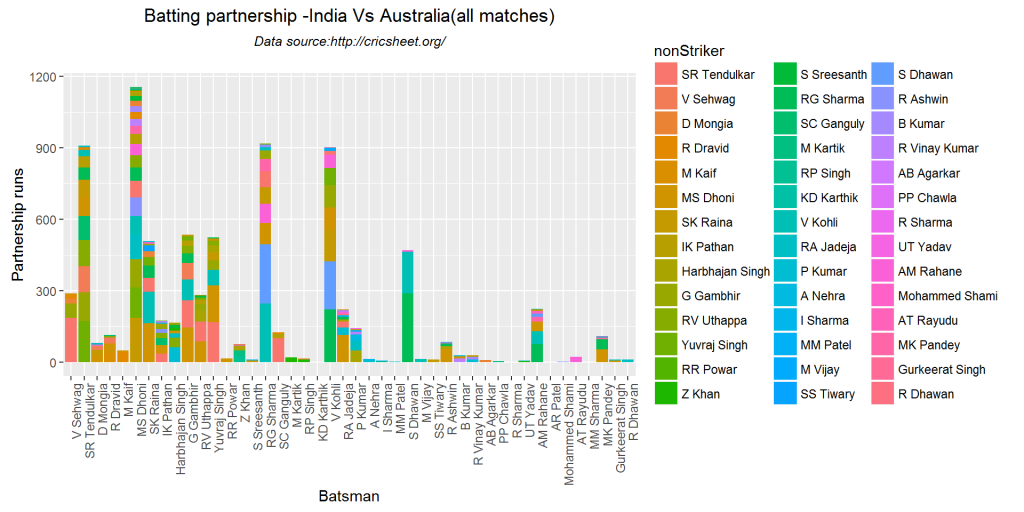
11. Team Batting Partnership plots
Graphical plot of batting partnerships for the countries
teamBatsmenPartnershipAllOppnAllMatchesPlot(ind_matches,"India",main="India")
![]()

teamBatsmenPartnershipAllOppnAllMatchesPlot(pak_matches,"Pakistan",main="Pakistan")
![]()

teamBatsmenPartnershipAllOppnAllMatchesPlot(aus_matches,"Australia",main="Australia")
![]()

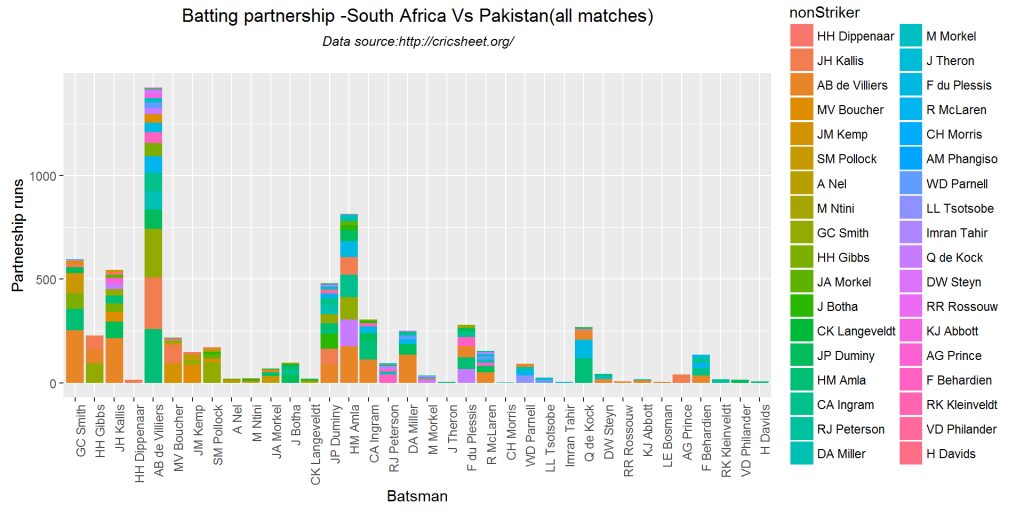
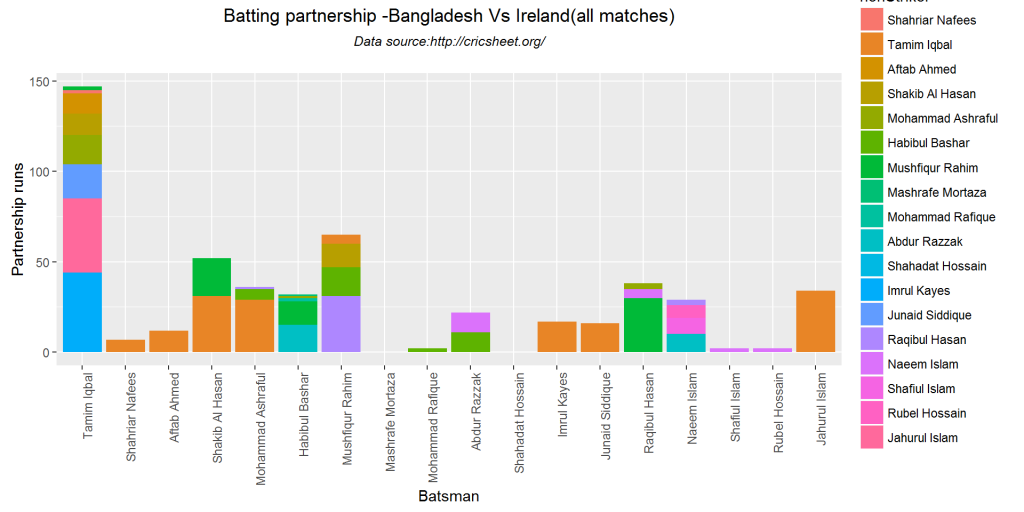
12. Top opposition batting partnerships.
This gives the best performance of the team against a specified country Indian partnetships against Australia
New Zealand Partnetship against South Africa
teamBatsmenPartnershipAllOppnAllMatchesPlot(ind_matches,"India",main="West Indies")
![]()

teamBatsmenPartnershipAllOppnAllMatchesPlot(sl_matches,"Sri Lanka",main="India")
![]()

teamBatsmenPartnershipAllOppnAllMatchesPlot(nz_matches,"New Zealand",main="South Africa")
![]()

13. Batsmen vs Bowlers
The function below gives the top performance of batsmen against the opposition countries
m <-teamBatsmenVsBowlersAllOppnAllMatchesRept(ind_matches,"India",rank=0)
m
## Source: local data frame [68 x 2]
##
##         batsman runsScored
##          (fctr)      (dbl)
## 1       V Kohli       7039
## 2      MS Dhoni       6885
## 3      SK Raina       4964
## 4     G Gambhir       4503
## 5     RG Sharma       4385
## 6  SR Tendulkar       4196
## 7  Yuvraj Singh       3976
## 8      V Sehwag       3681
## 9      S Dhawan       2694
## 10    AM Rahane       2009
## ..          ...        ...
m <-teamBatsmenVsBowlersAllOppnAllMatchesRept(ind_matches,"India",rank=1,dispRows=30)
m
## Source: local data frame [30 x 3]
## Groups: batsman [1]
##
##    batsman          bowler  runs
##     (fctr)          (fctr) (dbl)
## 1  V Kohli     NLTC Perera   242
## 2  V Kohli KMDN Kulasekara   196
## 3  V Kohli      SL Malinga   175
## 4  V Kohli      AD Mathews   155
## 5  V Kohli      BAW Mendis   132
## 6  V Kohli       R Rampaul   127
## 7  V Kohli     JW Dernbach   121
## 8  V Kohli     JP Faulkner   118
## 9  V Kohli       DJG Sammy   116
## 10 V Kohli    HMRKB Herath   113
## ..     ...             ...   ...
m <-teamBatsmenVsBowlersAllOppnAllMatchesRept(ind_matches,"India",rank=2,dispRows=50)
m
## Source: local data frame [50 x 3]
## Groups: batsman [1]
##
##     batsman         bowler  runs
##      (fctr)         (fctr) (dbl)
## 1  MS Dhoni M Muralitharan   195
## 2  MS Dhoni  ST Jayasuriya   183
## 3  MS Dhoni     SL Malinga   144
## 4  MS Dhoni      SR Watson   135
## 5  MS Dhoni        ST Finn   130
## 6  MS Dhoni     MG Johnson   128
## 7  MS Dhoni    JP Faulkner   125
## 8  MS Dhoni  Shahid Afridi   120
## 9  MS Dhoni     TT Bresnan   111
## 10 MS Dhoni     AD Mathews   111
## ..      ...            ...   ...
m <-teamBatsmenVsBowlersAllOppnAllMatchesRept(matches=ind_matches,theTeam="England",rank=1,dispRows=25)
m
## Source: local data frame [25 x 3]
## Groups: batsman [1]
##
##    batsman       bowler  runs
##     (fctr)       (fctr) (dbl)
## 1  IR Bell       Z Khan   127
## 2  IR Bell    PP Chawla   111
## 3  IR Bell    RA Jadeja    94
## 4  IR Bell      B Kumar    78
## 5  IR Bell     MM Patel    77
## 6  IR Bell     R Ashwin    71
## 7  IR Bell   AB Agarkar    66
## 8  IR Bell     I Sharma    57
## 9  IR Bell     RP Singh    51
## 10 IR Bell Yuvraj Singh    51
## ..     ...          ...   ...
m <-teamBatsmenVsBowlersAllOppnAllMatchesRept(ind_matches,"Australia",rank=0)
m
## Source: local data frame [47 x 2]
##
##       batsman runsScored
##        (fctr)      (dbl)
## 1  RT Ponting        876
## 2  MEK Hussey        753
## 3   GJ Bailey        614
## 4   SR Watson        609
## 5   MJ Clarke        607
## 6   ML Hayden        573
## 7   A Symonds        536
## 8    AJ Finch        525
## 9   SPD Smith        467
## 10  DA Warner        391
## ..        ...        ...
14. Batsmen vs Bowlers (continued)
m <-teamBatsmenVsBowlersAllOppnAllMatchesRept(eng_matches,"India",rank=1,dispRows=30)
m
## Source: local data frame [28 x 3]
## Groups: batsman [1]
##
##     batsman      bowler  runs
##      (fctr)      (fctr) (dbl)
## 1  MS Dhoni     ST Finn   130
## 2  MS Dhoni  TT Bresnan   111
## 3  MS Dhoni    GP Swann   101
## 4  MS Dhoni JW Dernbach    95
## 5  MS Dhoni   SCJ Broad    92
## 6  MS Dhoni JM Anderson    89
## 7  MS Dhoni    SR Patel    83
## 8  MS Dhoni JC Tredwell    40
## 9  MS Dhoni   CR Woakes    38
## 10 MS Dhoni  MS Panesar    37
## ..      ...         ...   ...
m <-teamBatsmenVsBowlersAllOppnAllMatchesRept(aus_matches,"Sri Lanka",rank=0)
m
## Source: local data frame [31 x 2]
##
##             batsman runsScored
##              (fctr)      (dbl)
## 1     KC Sangakkara        888
## 2  DPMD Jayawardene        846
## 3        TM Dilshan        799
## 4       WU Tharanga        464
## 5      LD Chandimal        413
## 6        AD Mathews        404
## 7   HDRL Thirimanne        290
## 8   KMDN Kulasekara        232
## 9     ST Jayasuriya        117
## 10       SL Malinga         91
## ..              ...        ...
m <-teamBatsmenVsBowlersAllOppnAllMatchesRept(sa_matches,"England",rank=0)
m
## Source: local data frame [39 x 2]
##
##           batsman runsScored
##            (fctr)      (dbl)
## 1       IJL Trott        424
## 2         JE Root        372
## 3         IR Bell        362
## 4      EJG Morgan        335
## 5  PD Collingwood        319
## 6        AD Hales        271
## 7    KP Pietersen        192
## 8      A Flintoff        192
## 9         OA Shah        177
## 10     JC Buttler        154
## ..            ...        ...
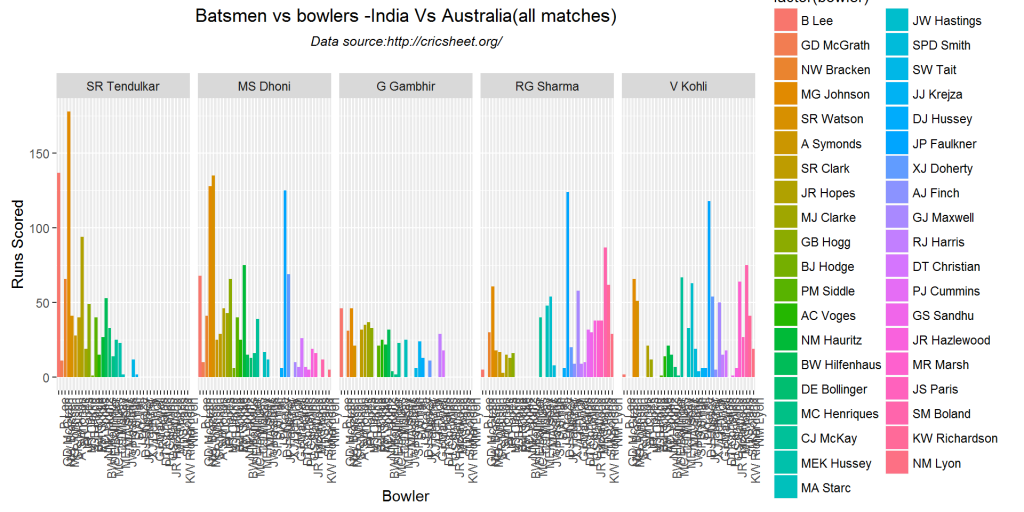
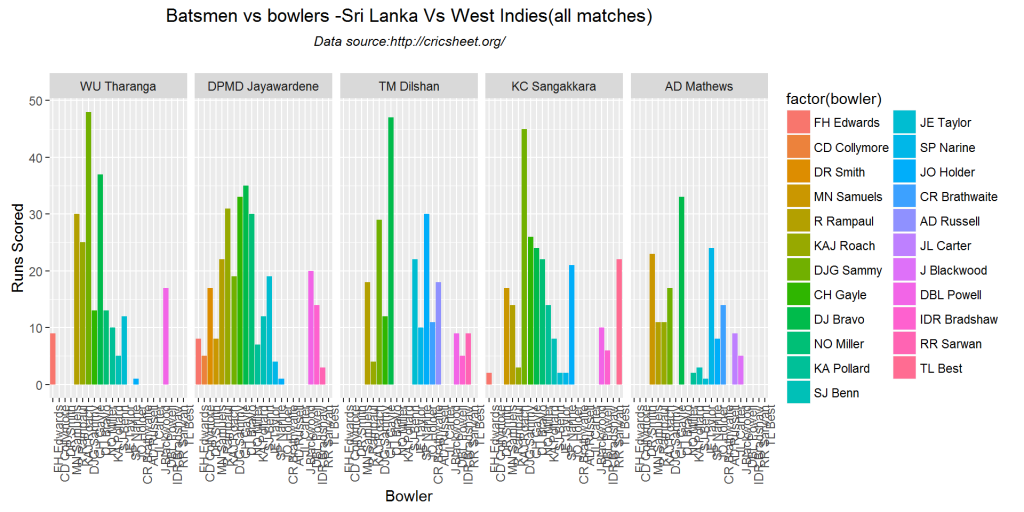
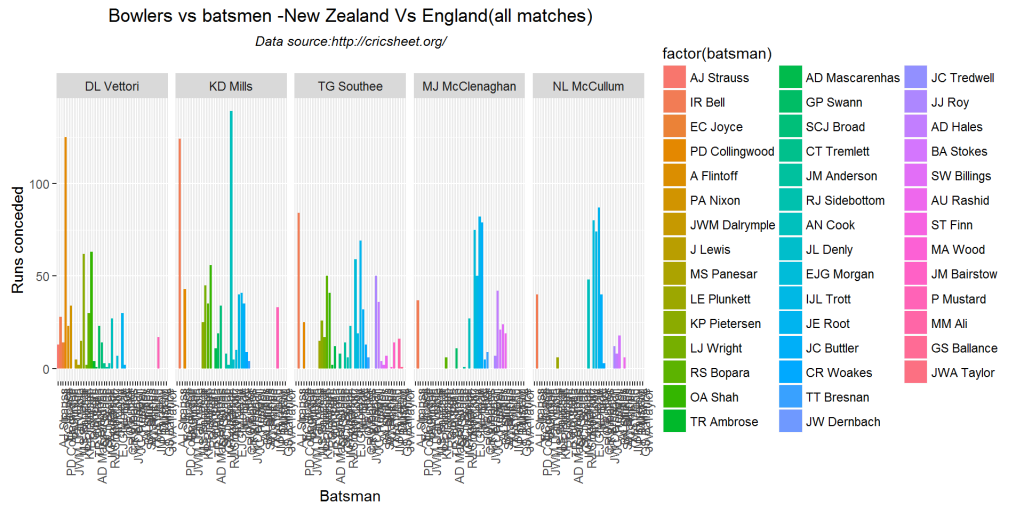
15. Batsmen vs Bowlers Plot
The following functions plot the performances of the batsman based on the rank chosen against opposition bowlers. Note: The rank has to be >0
d <- teamBatsmenVsBowlersAllOppnAllMatchesRept(ind_matches,"India",rank=1,dispRows=50)
d
## Source: local data frame [50 x 3]
## Groups: batsman [1]
##
##    batsman          bowler  runs
##     (fctr)          (fctr) (dbl)
## 1  V Kohli     NLTC Perera   242
## 2  V Kohli KMDN Kulasekara   196
## 3  V Kohli      SL Malinga   175
## 4  V Kohli      AD Mathews   155
## 5  V Kohli      BAW Mendis   132
## 6  V Kohli       R Rampaul   127
## 7  V Kohli     JW Dernbach   121
## 8  V Kohli     JP Faulkner   118
## 9  V Kohli       DJG Sammy   116
## 10 V Kohli    HMRKB Herath   113
## ..     ...             ...   ...
teamBatsmenVsBowlersAllOppnAllMatchesPlot(d)
![]()

e <- teamBatsmenVsBowlersAllOppnAllMatchesPlot(d,plot=FALSE)
e
## Source: local data frame [50 x 3]
## Groups: batsman [1]
##
##    batsman          bowler  runs
##     (fctr)          (fctr) (dbl)
## 1  V Kohli     NLTC Perera   242
## 2  V Kohli KMDN Kulasekara   196
## 3  V Kohli      SL Malinga   175
## 4  V Kohli      AD Mathews   155
## 5  V Kohli      BAW Mendis   132
## 6  V Kohli       R Rampaul   127
## 7  V Kohli     JW Dernbach   121
## 8  V Kohli     JP Faulkner   118
## 9  V Kohli       DJG Sammy   116
## 10 V Kohli    HMRKB Herath   113
## ..     ...             ...   ...
d <- teamBatsmenVsBowlersAllOppnAllMatchesRept(ind_matches,"India",rank=2,dispRows=50)
teamBatsmenVsBowlersAllOppnAllMatchesPlot(d)
![]()

d <- teamBatsmenVsBowlersAllOppnAllMatchesRept(ind_matches,"South Africa",rank=1,dispRows=30)
d
## Source: local data frame [30 x 3]
## Groups: batsman [1]
##
##           batsman          bowler  runs
##            (fctr)          (fctr) (dbl)
## 1  AB de Villiers Harbhajan Singh   133
## 2  AB de Villiers         B Kumar    93
## 3  AB de Villiers       RA Jadeja    90
## 4  AB de Villiers        A Mishra    77
## 5  AB de Villiers       MM Sharma    68
## 6  AB de Villiers          Z Khan    65
## 7  AB de Villiers     S Sreesanth    61
## 8  AB de Villiers         A Nehra    58
## 9  AB de Villiers        R Ashwin    55
## 10 AB de Villiers       IK Pathan    45
## ..            ...             ...   ...
teamBatsmenVsBowlersAllOppnAllMatchesPlot(d)
![]()

d <-teamBatsmenVsBowlersAllOppnAllMatchesRept(matches=ind_matches,"England",rank=1,dispRows=50)
d
## Source: local data frame [28 x 3]
## Groups: batsman [1]
##
##    batsman       bowler  runs
##     (fctr)       (fctr) (dbl)
## 1  IR Bell       Z Khan   127
## 2  IR Bell    PP Chawla   111
## 3  IR Bell    RA Jadeja    94
## 4  IR Bell      B Kumar    78
## 5  IR Bell     MM Patel    77
## 6  IR Bell     R Ashwin    71
## 7  IR Bell   AB Agarkar    66
## 8  IR Bell     I Sharma    57
## 9  IR Bell     RP Singh    51
## 10 IR Bell Yuvraj Singh    51
## ..     ...          ...   ...
teamBatsmenVsBowlersAllOppnAllMatchesPlot(d)
![]()

15. Batsmen vs Bowlers Plot (continued)
d <- teamBatsmenVsBowlersAllOppnAllMatchesRept(sa_matches,"South Africa",rank=1,dispRows=50)
d
## Source: local data frame [50 x 3]
## Groups: batsman [1]
##
##           batsman          bowler  runs
##            (fctr)          (fctr) (dbl)
## 1  AB de Villiers   Shahid Afridi   227
## 2  AB de Villiers     Saeed Ajmal   174
## 3  AB de Villiers Mohammad Hafeez   151
## 4  AB de Villiers       JO Holder   138
## 5  AB de Villiers Harbhajan Singh   133
## 6  AB de Villiers      Wahab Riaz   130
## 7  AB de Villiers      MG Johnson   129
## 8  AB de Villiers        P Utseya   128
## 9  AB de Villiers       DJG Sammy   110
## 10 AB de Villiers        DJ Bravo   107
## ..            ...             ...   ...
teamBatsmenVsBowlersAllOppnAllMatchesPlot(d)
![]()

e <- teamBatsmenVsBowlersAllOppnAllMatchesPlot(d,plot=FALSE)
e
## Source: local data frame [50 x 3]
## Groups: batsman [1]
##
##           batsman          bowler  runs
##            (fctr)          (fctr) (dbl)
## 1  AB de Villiers   Shahid Afridi   227
## 2  AB de Villiers     Saeed Ajmal   174
## 3  AB de Villiers Mohammad Hafeez   151
## 4  AB de Villiers       JO Holder   138
## 5  AB de Villiers Harbhajan Singh   133
## 6  AB de Villiers      Wahab Riaz   130
## 7  AB de Villiers      MG Johnson   129
## 8  AB de Villiers        P Utseya   128
## 9  AB de Villiers       DJG Sammy   110
## 10 AB de Villiers        DJ Bravo   107
## ..            ...             ...   ...
d <- teamBatsmenVsBowlersAllOppnAllMatchesRept(sl_matches,"Sri Lanka",rank=1,dispRows=50)
teamBatsmenVsBowlersAllOppnAllMatchesPlot(d)

![]()
d <- teamBatsmenVsBowlersAllOppnAllMatchesRept(eng_matches,"West Indies",rank=1,dispRows=50)
teamBatsmenVsBowlersAllOppnAllMatchesPlot(d)
![]()

16 Team bowling scorecard against all opposition
The functions lists the top bowlers of each country in ODI matches. This function returns a dataframe when ‘matches’ is the matches of the country and ‘theTeam’ is the same country as in the functions below
teamBowlingScorecardAllOppnAllMatchesMain(matches=ind_matches,theTeam="India")
## Source: local data frame [57 x 5]
##
##             bowler overs maidens  runs wickets
##             (fctr) (int)   (int) (dbl)   (dbl)
## 1        RA Jadeja    43       0  4749     153
## 2         R Ashwin    49       0  4225     146
## 3           Z Khan    47       0  3692     141
## 4  Harbhajan Singh    45       0  4040     123
## 5         I Sharma    51       0  3216     113
## 6         MM Patel    49       1  2400      92
## 7          P Kumar    50       2  2752      84
## 8         UT Yadav    51       0  2442      80
## 9   Mohammed Shami    43       0  1806      80
## 10    Yuvraj Singh    38       0  2588      77
## ..             ...   ...     ...   ...     ...
teamBowlingScorecardAllOppnAllMatchesMain(matches=aus_matches,theTeam="Australia")
## Source: local data frame [54 x 5]
##
##          bowler overs maidens  runs wickets
##          (fctr) (int)   (int) (dbl)   (dbl)
## 1    MG Johnson    51       0  5635     245
## 2         B Lee    50       0  3400     147
## 3     SR Watson    45      NA    NA     136
## 4    NW Bracken    51       0  2763     114
## 5      CJ McKay    49      NA    NA     103
## 6      MA Starc    48       1  1769      97
## 7   JP Faulkner    44       0  2004      75
## 8      JR Hopes    43       0  2098      69
## 9       SW Tait    50       0  1461      66
## 10 DE Bollinger    51       0  1482      65
## ..          ...   ...     ...   ...     ...
teamBowlingScorecardAllOppnAllMatchesMain(eng_matches,"England")
## Source: local data frame [52 x 5]
##
##            bowler overs maidens  runs wickets
##            (fctr) (int)   (int) (dbl)   (dbl)
## 1     JM Anderson    51       0  5688     202
## 2       SCJ Broad    51       0  5160     198
## 3      TT Bresnan    51       0  3730     117
## 4         ST Finn    49       0  2839     106
## 5        GP Swann    39       0  2760     106
## 6  PD Collingwood    40       1  2517      77
## 7      A Flintoff    45       0  1260      68
## 8     JC Tredwell    42       0  1614      62
## 9       CR Woakes    47       0  1859      57
## 10      RS Bopara    34       0  1508      42
## ..            ...   ...     ...   ...     ...
teamBowlingScorecardAllOppnAllMatchesMain(pak_matches,"Pakistan")
## Source: local data frame [55 x 5]
##
##             bowler overs maidens  runs wickets
##             (fctr) (int)   (int) (dbl)   (dbl)
## 1    Shahid Afridi    45       0  6674     212
## 2      Saeed Ajmal    44       0  4089     184
## 3         Umar Gul    49       0  4127     151
## 4       Wahab Riaz    50       0  2954     111
## 5  Mohammad Hafeez    51       0  3502     109
## 6   Mohammad Irfan    49       0  2523      86
## 7    Sohail Tanvir    48       1  2534      75
## 8      Junaid Khan    48       1  2056      75
## 9   Iftikhar Anjum    49       2  1674      62
## 10    Shoaib Malik    41       1  2206      59
## ..             ...   ...     ...   ...     ...
teamBowlingScorecardAllOppnAllMatchesMain(sa_matches,"South Africa")
## Source: local data frame [41 x 5]
##
##           bowler overs maidens  runs wickets
##           (fctr) (int)   (int) (dbl)   (dbl)
## 1       DW Steyn    51       0  4294     179
## 2       M Morkel    51       0  4012     172
## 3    LL Tsotsobe    42       0  2231     100
## 4    Imran Tahir    39       0  2124      93
## 5      R McLaren    41       1  1983      80
## 6      JH Kallis    44       0  2075      77
## 7     WD Parnell    44       0  1957      74
## 8        J Botha    44       0  2311      69
## 9    RJ Peterson    47       1  1872      68
## 10 CK Langeveldt    49       0  1829      65
## ..           ...   ...     ...   ...     ...
teamBowlingScorecardAllOppnAllMatchesMain(nz_matches,"New Zealand")
## Source: local data frame [51 x 5]
##
##            bowler overs maidens  runs wickets
##            (fctr) (int)   (int) (dbl)   (dbl)
## 1        KD Mills    50       1  3918     160
## 2      DL Vettori    43       1  3767     147
## 3      TG Southee    51       0  3996     134
## 4  MJ McClenaghan    49       0  2252      85
## 5        JDP Oram    46       0  2064      78
## 6     NL McCullum    46       0  2840      67
## 7         SE Bond    37       1  1449      62
## 8        TA Boult    40       3  1324      58
## 9     CJ Anderson    41       0  1297      52
## 10       MJ Henry    41       0  1098      47
## ..            ...   ...     ...   ...     ...
teamBowlingScorecardAllOppnAllMatchesMain(sl_matches,"Sri Lanka")
## Source: local data frame [54 x 5]
##
##             bowler overs maidens  runs wickets
##             (fctr) (int)   (int) (dbl)   (dbl)
## 1       SL Malinga    51       0  7214     281
## 2  KMDN Kulasekara    51       0  5481     179
## 3       BAW Mendis    47       0  2979     135
## 4      NLTC Perera    48       0  3624     129
## 5   M Muralitharan    45       0  2471     114
## 6       AD Mathews    51       0  3394     113
## 7       TM Dilshan    50       0  3049      73
## 8     CRD Fernando    51       1  2067      73
## 9     HMRKB Herath    41       0  2027      71
## 10     MF Maharoof    48       0  1860      70
## ..             ...   ...     ...   ...     ...
teamBowlingScorecardAllOppnAllMatchesMain(wi_matches,"West Indies")
## Source: local data frame [45 x 5]
##
##        bowler overs maidens  runs wickets
##        (fctr) (int)   (int) (dbl)   (dbl)
## 1    DJ Bravo    51       0  4239     153
## 2   JE Taylor    50       0  2530     103
## 3   R Rampaul    46       1  2608     102
## 4   KAJ Roach    49       0  2500      98
## 5   SP Narine    47       0  1924      82
## 6   DJG Sammy    51       1  3584      79
## 7  AD Russell    48       0  1987      63
## 8    CH Gayle    38       0  1955      53
## 9   JO Holder    44       0  1542      50
## 10 MN Samuels    38       0  2209      48
## ..        ...   ...     ...   ...     ...
17 Team bowling scorecard against all opposition (continued)
The function lists the top bowlers of a country (‘matches’) against the opposition country
teamBowlingScorecardAllOppnAllMatches(ind_matches,'Australia')
## Source: local data frame [36 x 5]
##
##             bowler overs maidens  runs wickets
##             (fctr) (int)   (int) (dbl)   (dbl)
## 1         I Sharma    44       1   739      26
## 2  Harbhajan Singh    40       0   926      25
## 3        IK Pathan    42       1   702      22
## 4         UT Yadav    37       2   606      18
## 5      S Sreesanth    34       0   454      18
## 6        RA Jadeja    39       0   867      16
## 7           Z Khan    33       1   500      15
## 8         R Ashwin    43       0   684      14
## 9          P Kumar    27       0   501      14
## 10   R Vinay Kumar    31       1   380      14
## ..             ...   ...     ...   ...     ...
teamBowlingScorecardAllOppnAllMatches(aus_matches,'India')
## Source: local data frame [39 x 5]
##
##         bowler overs maidens  runs wickets
##         (fctr) (int)   (int) (dbl)   (dbl)
## 1   MG Johnson    47       0  1020      44
## 2        B Lee    41       3   671      28
## 3    SR Watson    36       1   532      18
## 4     CJ McKay    37       1   403      18
## 5      GB Hogg    33       0   427      17
## 6  JP Faulkner    26       0   598      16
## 7     JR Hopes    31       0   346      14
## 8   NW Bracken    35       1   429      13
## 9  JW Hastings    27       2   259      13
## 10    MA Starc    26       0   251      13
## ..         ...   ...     ...   ...     ...
teamBowlingScorecardAllOppnAllMatches(nz_matches,'England')
## Source: local data frame [33 x 5]
##
##            bowler overs maidens  runs wickets
##            (fctr) (int)   (int) (dbl)   (dbl)
## 1      TG Southee    39       2   684      33
## 2      DL Vettori    27       1   561      28
## 3        KD Mills    27       0   742      24
## 4  MJ McClenaghan    25       1   515      20
## 5    JEC Franklin    23       0   418      12
## 6         SE Bond    16       0   205      12
## 7      GD Elliott    10       3   194      12
## 8       SB Styris     8       0   296       9
## 9     NL McCullum    24       0   425       7
## 10     MJ Santner    18       0   230       7
## ..            ...   ...     ...   ...     ...
teamBowlingScorecardAllOppnAllMatches(sl_matches,"West Indies")
## Source: local data frame [24 x 5]
##
##             bowler overs maidens  runs wickets
##             (fctr) (int)   (int) (dbl)   (dbl)
## 1       SL Malinga    28       1   280      14
## 2       BAW Mendis    15       0   267       9
## 3  KMDN Kulasekara    13       1   185       8
## 4       AD Mathews    14       0   191       7
## 5   M Muralitharan    20       1   157       6
## 6      MF Maharoof     9       2    14       6
## 7       WPUJC Vaas     7       2    82       5
## 8       RAS Lakmal     7       0    55       5
## 9     HMRKB Herath    10       1   124       4
## 10   ST Jayasuriya     1       0    38       4
## ..             ...   ...     ...   ...     ...
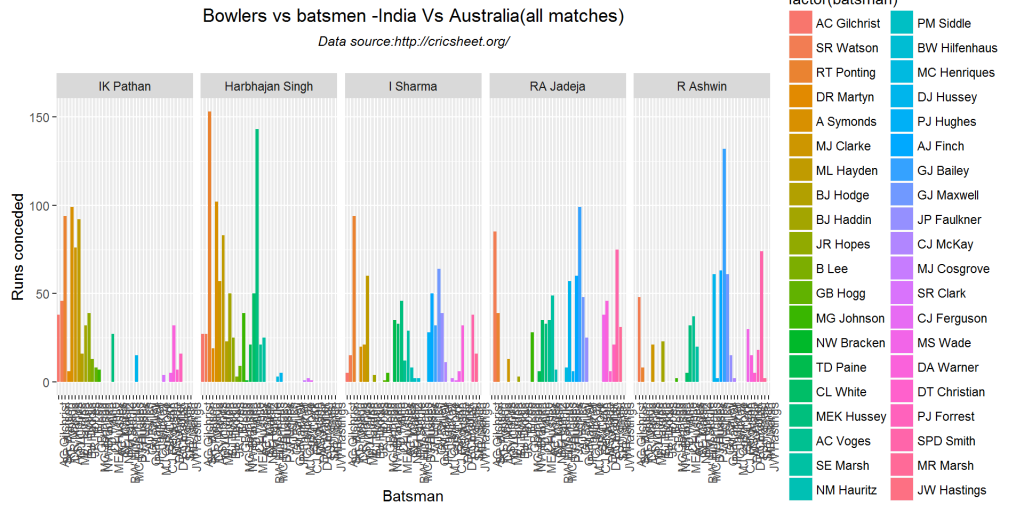
18. Team Bowlers versus Batsmen (against all oppositions)
The functions below give the peformance of bowlers versus batsman. They give the best bowlers and the total runs conceded and against whom were the runs conceded
teamBowlersVsBatsmenAllOppnAllMatchesMain(ind_matches,theTeam="India",rank=0)
## Source: local data frame [10 x 2]
##
##             bowler  runs
##             (fctr) (dbl)
## 1        RA Jadeja  4691
## 2         R Ashwin  4111
## 3  Harbhajan Singh  3858
## 4           Z Khan  3514
## 5         I Sharma  3100
## 6          P Kumar  2646
## 7     Yuvraj Singh  2542
## 8        IK Pathan  2359
## 9         UT Yadav  2343
## 10        MM Patel  2314
(rank=1)
## [1] 1
m <-teamBowlersVsBatsmenAllOppnAllMatchesMain(ind_matches,theTeam="India",rank=1)
m
## Source: local data frame [207 x 3]
## Groups: bowler [1]
##
##       bowler          batsman runsConceded
##       (fctr)           (fctr)        (dbl)
## 1  RA Jadeja    KC Sangakkara          172
## 2  RA Jadeja DPMD Jayawardene          117
## 3  RA Jadeja       TM Dilshan          108
## 4  RA Jadeja     LD Chandimal          103
## 5  RA Jadeja        GJ Bailey           99
## 6  RA Jadeja      LRPL Taylor           95
## 7  RA Jadeja          IR Bell           94
## 8  RA Jadeja    KS Williamson           92
## 9  RA Jadeja   AB de Villiers           90
## 10 RA Jadeja        SR Watson           85
## ..       ...              ...          ...
m <-teamBowlersVsBatsmenAllOppnAllMatchesMain(ind_matches,theTeam="India",rank=2)
m
## Source: local data frame [177 x 3]
## Groups: bowler [1]
##
##      bowler          batsman runsConceded
##      (fctr)           (fctr)        (dbl)
## 1  R Ashwin        GJ Bailey          132
## 2  R Ashwin    KC Sangakkara          117
## 3  R Ashwin          AN Cook          115
## 4  R Ashwin    KS Williamson          114
## 5  R Ashwin         DM Bravo          111
## 6  R Ashwin       AD Mathews          100
## 7  R Ashwin     LD Chandimal           98
## 8  R Ashwin      LRPL Taylor           93
## 9  R Ashwin DPMD Jayawardene           93
## 10 R Ashwin     KP Pietersen           81
## ..      ...              ...          ...
18. Team Bowlers versus Batsmen (against all oppositions continued)
teamBowlersVsBatsmenAllOppnAllMatchesMain(sa_matches,theTeam="South Africa",rank=0)
## Source: local data frame [10 x 2]
##
##         bowler  runs
##         (fctr) (dbl)
## 1     DW Steyn  4116
## 2     M Morkel  3808
## 3      J Botha  2244
## 4  LL Tsotsobe  2147
## 5    JP Duminy  2111
## 6  Imran Tahir  2087
## 7    JH Kallis  2014
## 8   WD Parnell  1864
## 9    R McLaren  1863
## 10 RJ Peterson  1842
teamBowlersVsBatsmenAllOppnAllMatchesMain(pak_matches,theTeam="Pakistan",rank=0)
## Source: local data frame [10 x 2]
##
##             bowler  runs
##             (fctr) (dbl)
## 1    Shahid Afridi  6444
## 2      Saeed Ajmal  3956
## 3         Umar Gul  3901
## 4  Mohammad Hafeez  3434
## 5       Wahab Riaz  2755
## 6   Mohammad Irfan  2399
## 7    Sohail Tanvir  2337
## 8     Shoaib Malik  2105
## 9      Junaid Khan  1974
## 10  Iftikhar Anjum  1626
teamBowlersVsBatsmenAllOppnAllMatchesMain(sl_matches,theTeam="Sri Lanka",rank=1)
## Source: local data frame [314 x 3]
## Groups: bowler [1]
##
##        bowler         batsman runsConceded
##        (fctr)          (fctr)        (dbl)
## 1  SL Malinga Mohammad Hafeez          191
## 2  SL Malinga         V Kohli          175
## 3  SL Malinga       G Gambhir          170
## 4  SL Malinga        MS Dhoni          144
## 5  SL Malinga      Umar Akmal          142
## 6  SL Malinga        V Sehwag          140
## 7  SL Malinga         IR Bell          134
## 8  SL Malinga    SR Tendulkar          133
## 9  SL Malinga   Ahmed Shehzad          121
## 10 SL Malinga         AN Cook          120
## ..        ...             ...          ...
m <-teamBowlersVsBatsmenAllOppnAllMatchesMain(ind_matches,theTeam="India",rank=2)
m
## Source: local data frame [177 x 3]
## Groups: bowler [1]
##
##      bowler          batsman runsConceded
##      (fctr)           (fctr)        (dbl)
## 1  R Ashwin        GJ Bailey          132
## 2  R Ashwin    KC Sangakkara          117
## 3  R Ashwin          AN Cook          115
## 4  R Ashwin    KS Williamson          114
## 5  R Ashwin         DM Bravo          111
## 6  R Ashwin       AD Mathews          100
## 7  R Ashwin     LD Chandimal           98
## 8  R Ashwin      LRPL Taylor           93
## 9  R Ashwin DPMD Jayawardene           93
## 10 R Ashwin     KP Pietersen           81
## ..      ...              ...          ...
19. Team bowlers versus batsmen report (all oppositions)
teamBowlersVsBatsmenAllOppnAllMatchesRept(matches=ind_matches,theTeam="India",rank=0)
## Source: local data frame [10 x 2]
##
##             bowler  runs
##             (fctr) (dbl)
## 1  KMDN Kulasekara  1448
## 2       SL Malinga  1319
## 3      NLTC Perera   959
## 4      JM Anderson   954
## 5       MG Johnson   939
## 6        SCJ Broad   877
## 7       BAW Mendis   783
## 8       AD Mathews   776
## 9          ST Finn   751
## 10      TT Bresnan   741
a <- teamBowlersVsBatsmenAllOppnAllMatchesRept(ind_matches,theTeam="India",rank=1)
a
## Source: local data frame [31 x 3]
## Groups: bowler [1]
##
##             bowler      batsman runsConceded
##             (fctr)       (fctr)        (dbl)
## 1  KMDN Kulasekara     V Sehwag          199
## 2  KMDN Kulasekara      V Kohli          196
## 3  KMDN Kulasekara    G Gambhir          157
## 4  KMDN Kulasekara SR Tendulkar          127
## 5  KMDN Kulasekara Yuvraj Singh          118
## 6  KMDN Kulasekara    RG Sharma          114
## 7  KMDN Kulasekara     SK Raina          104
## 8  KMDN Kulasekara     MS Dhoni           80
## 9  KMDN Kulasekara   KD Karthik           56
## 10 KMDN Kulasekara   SC Ganguly           51
## ..             ...          ...          ...
20. Team bowlers versus batsmen report (all oppositions continued)
teamBowlersVsBatsmenAllOppnAllMatchesRept(matches=ind_matches,theTeam="Sri Lanka",rank=0)
## Source: local data frame [10 x 2]
##
##             bowler  runs
##             (fctr) (dbl)
## 1           Z Khan  1141
## 2        RA Jadeja   882
## 3         I Sharma   855
## 4  Harbhajan Singh   805
## 5          P Kumar   758
## 6         R Ashwin   740
## 7        IK Pathan   678
## 8          A Nehra   584
## 9         UT Yadav   544
## 10        MM Patel   488
teamBowlersVsBatsmenAllOppnAllMatchesRept(ind_matches,"England",rank=0)
## Source: local data frame [10 x 2]
##
##          bowler  runs
##          (fctr) (dbl)
## 1      R Ashwin   777
## 2     RA Jadeja   735
## 3        Z Khan   507
## 4      MM Patel   463
## 5      RP Singh   410
## 6      I Sharma   396
## 7     PP Chawla   375
## 8  Yuvraj Singh   370
## 9       B Kumar   353
## 10   AB Agarkar   336
21. Team bowlers versus batsmen report (all oppositions coninued-1)
teamBowlersVsBatsmenAllOppnAllMatchesRept(nz_matches,theTeam="New Zealand",rank=0)
## Source: local data frame [10 x 2]
##
##             bowler  runs
##             (fctr) (dbl)
## 1      JM Anderson   889
## 2       MG Johnson   828
## 3    Shahid Afridi   751
## 4  KMDN Kulasekara   728
## 5        SCJ Broad   638
## 6       NW Bracken   626
## 7       SL Malinga   601
## 8         DW Steyn   556
## 9          ST Finn   482
## 10       SR Watson   468
teamBowlersVsBatsmenAllOppnAllMatchesRept(aus_matches,"Australia",rank=0)
## Source: local data frame [10 x 2]
##
##             bowler  runs
##             (fctr) (dbl)
## 1      JM Anderson  1211
## 2       TT Bresnan  1087
## 3       SL Malinga  1078
## 4        SCJ Broad   948
## 5  Harbhajan Singh   890
## 6       DL Vettori   883
## 7  KMDN Kulasekara   875
## 8         DW Steyn   872
## 9        RA Jadeja   853
## 10        DJ Bravo   830
teamBowlersVsBatsmenAllOppnAllMatchesRept(sl_matches,"Sri Lanka",rank=0)
## Source: local data frame [10 x 2]
##
##             bowler  runs
##             (fctr) (dbl)
## 1    Shahid Afridi  1177
## 2           Z Khan  1141
## 3        RA Jadeja   882
## 4         I Sharma   855
## 5      Saeed Ajmal   814
## 6  Harbhajan Singh   805
## 7  Mohammad Hafeez   774
## 8          P Kumar   758
## 9         R Ashwin   740
## 10        Umar Gul   718
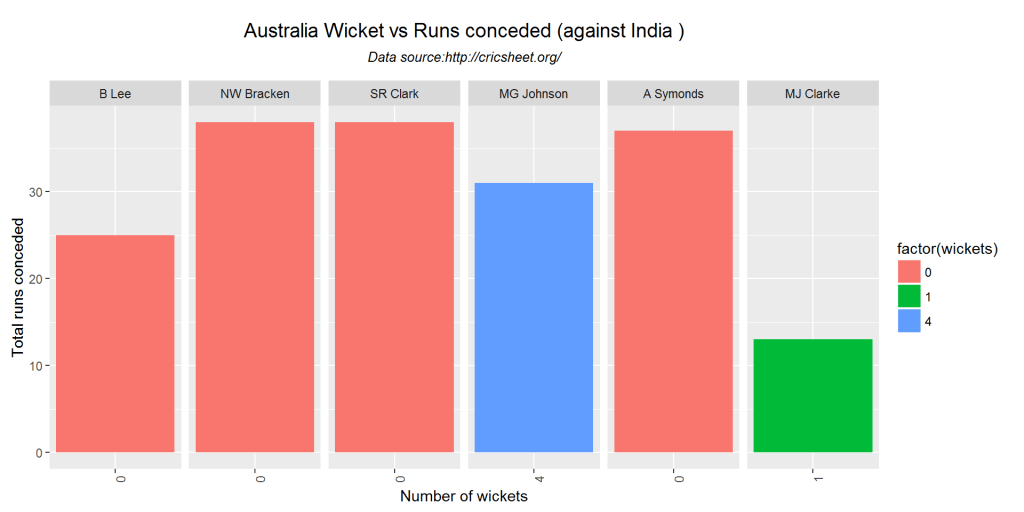
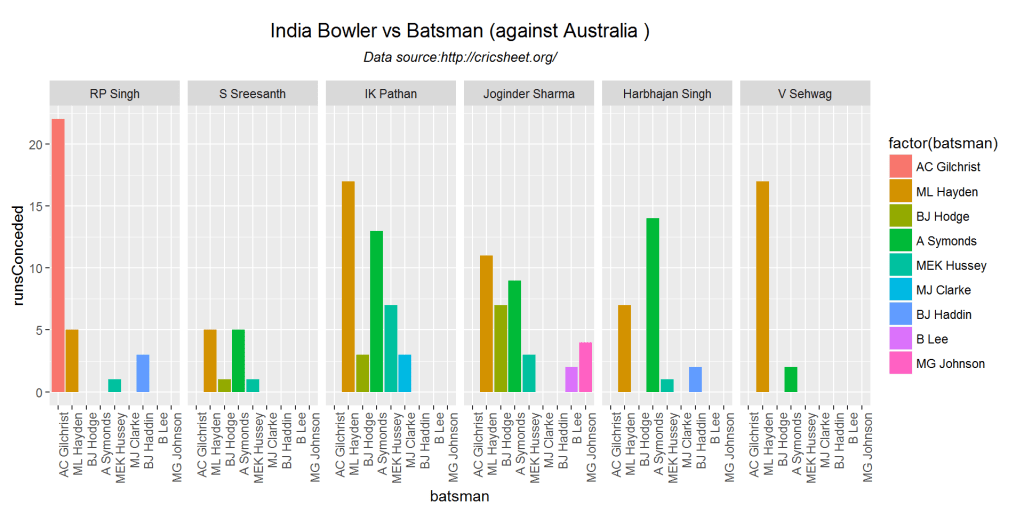
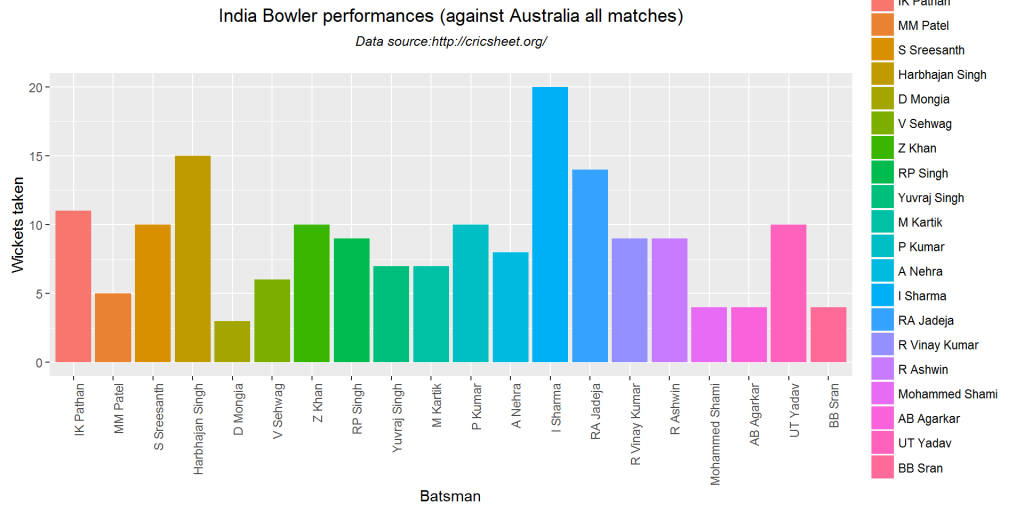
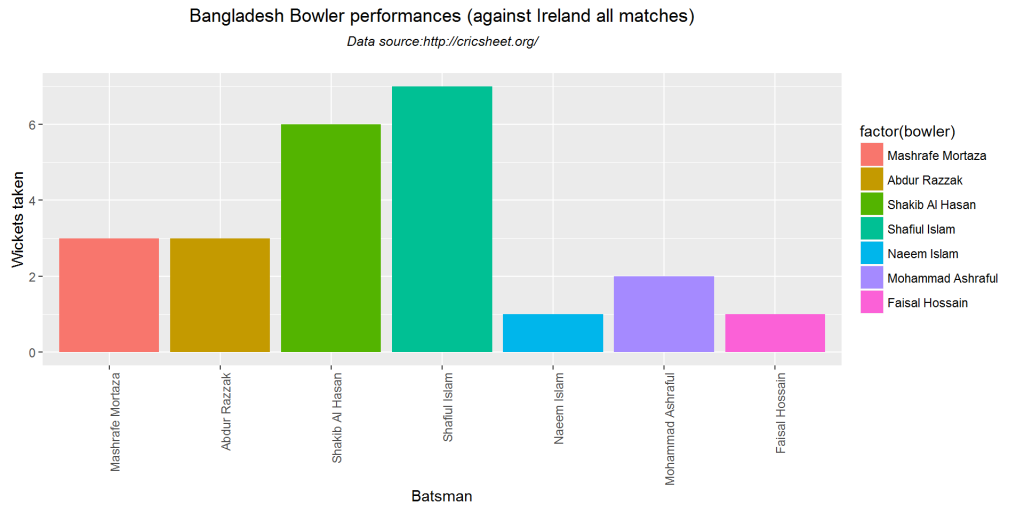
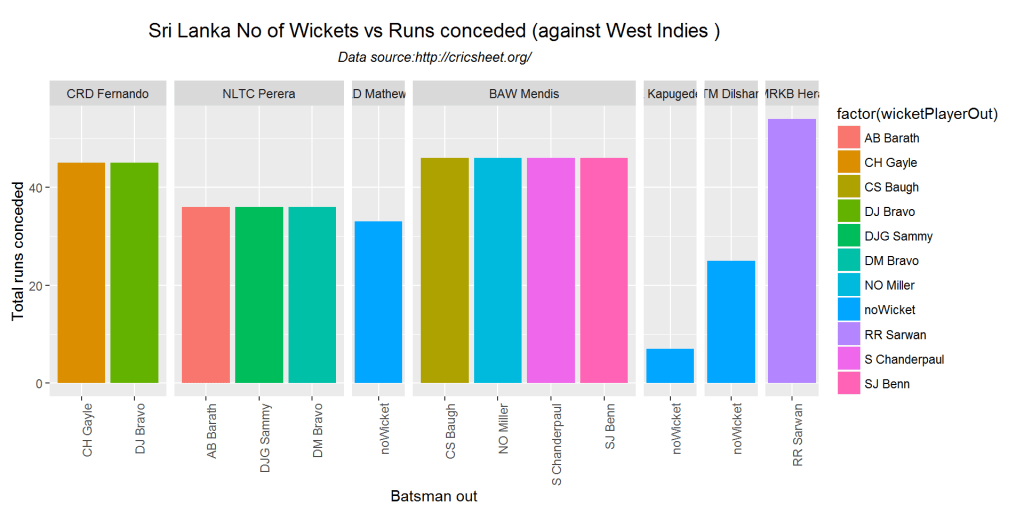
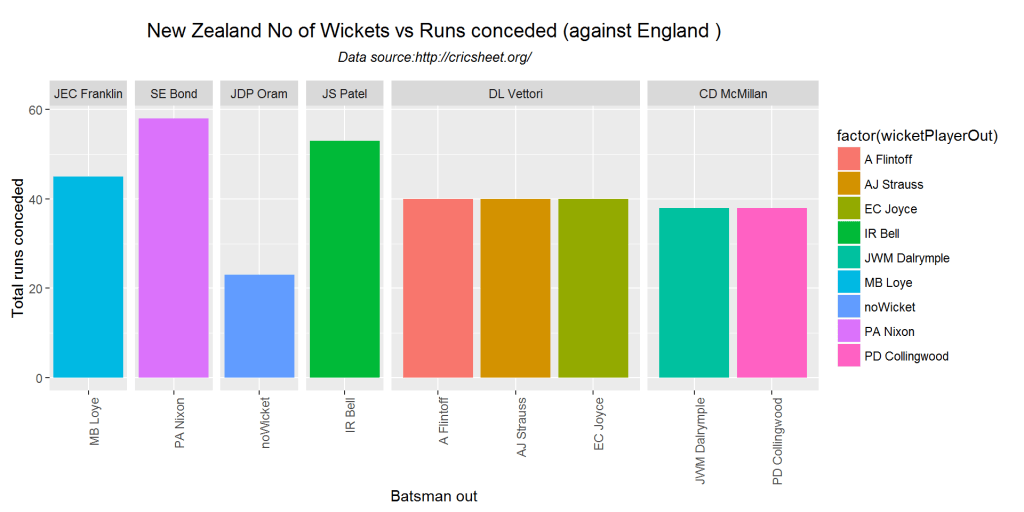
22. Team bowlers versus batsmen report (all oppositions) plot
This function can only be used for rank>0 (rank=1,2,3..)