Into the Telecom vortex

“Ten little Indian boys went out to dine,
One choked his little self and then there were nine
Nine little Indian boys sat up very late;
One overslept himself and then there were eight…”

From the poem “Ten Little Indians”

a

You don’t need to be particularly observant to notice that the telecom landscape over the last decade and a half is full of dead organizations, bloodshed and gore. Organizations have been slain by ruthless times and bigger ones have devoured the weaker, fallen ones. Telecom titans have vanished, giants have been reduced to dwarfs.

Some telecom companies have merged in a deadly embrace trying to beat the market forces only to capitulate to its inexorable death march.

The period from the early 1980s to the late 1990’s were the glorious periods for telecommunication. Digital switches (1972-1982), ISDN (1988), international calling, trunk protocols, mobile (~1991), 2G, 2.5G, and 3G moved in succession, one after another.

Advancement came after advancement. The future had never looked so bright for telecom companies.

The late 1990’s were heady years, not just for telecom companies, but to all technology companies. Stock prices soared. Many stocks were over-valued.  This was mainly due to what was described as the ‘irrational exuberance’ of the stock market.

Lucent, Alcatel, Ericsson, Nortel Networks, Nokia, Siemens, Telecordia all ruled supreme.

1997-2000. then the inevitable happened. There was the infamous dot-com bust of the 2000 which sent reduced many technology stocks to penny stocks. Telecom company stocks went into a major tail spin.  Stock prices of telecom organizations plummeted. This situation, many felt, was further exacerbated by the fact that nothing important or earth shattering was forth-coming from the telecom. In other words, there was no ‘killer app’ from the telecommunication domain.

From 2000 onwards 3G, HSDPA, LTE etc. have all come and gone by. But the markets were largely unimpressed. This was also the period of the downward slide for telecom. The last decade and a half has been extra-ordinarily violent. Technology units of dying organizations have been cannibalized by the more successful ones.

Stellar organizations collapsed, others transformed into ‘white dwarfs’, still others shattered with the ferocity of a super nova.

Here is a short recap of the major events.

  • 2006 – After a couple of unsuccessful attempts Alcatel and Lucent finally decide to merge
  • 2006 – Nokia marries Siemens in a 20 billion Euro deal. N
  • 2009-10 – Ericsson purchases Nortel’s CDMA and LTE business for $1.13 billion
  • 2009-10 – Nortel implodes
  • 2010 – Motorola sells networking unit to Nokia for $1.2 Billion
  • 2011 – Internet giant Google mops up Motorola’s handset division for $12.5 billion, largely for the patents
  • 2012 – Ericsson closes a deal with Telcordia for $1.15 billion
  • 2013 – Nokia sells its handset division to Microsoft after facing a serious beating from smartphones
  • 2015 – Nokia agrees to a $16.6 billion takeover of Alcatel Lucent

And so the story continues like the rhyme in Agatha Christie’s mystery novel

And then there were none

Ten little Indian boys went out to dine,                                                                                                                
One choked his little self and then there were nine…”

The Telecom companies continue their search for the elusive ‘killer app’ as progress comes in small increments – 3G, 3.5G, 3.75G, 4G, and 5G etc.

Personally I think the future of Telecom companies, lies in its ability to embrace the latest technologies of Cloud Computing, Big Data, Software Defined Networks, and Software Defined Datacenters and re-invent themselves. Rather than looking for some elusive ‘killer app’ they have to re-enter the technology scene with a Big Bang

As I referred to in one of my earlier posts “Architecting a cloud Based IP Multimedia System” the proverbial pot at the end of the rainbow may be in

  1. Virtualizing IP Multimedia Switches (IMS) namely the CSCFs (P-CSCF, S-CSCF, I-CSCF etc.),
  2. Using the features of the cloud like Software Defined Storage (SDS) , Load balancers and auto-scaling to elastically scale-up or scale down the CSCF instances to handle varying ‘call traffic’
  3. Having equipment manufacturers (Nokia, Ericsson, and Huawei) will have to use innovating pricing models with the carriers like AT&T, MCI, Airtel or Vodafone. Instead of a one-time cost for hardware and software, the equipment manufacturers will need to charge based on usage or call traffic (utility charging). This will be a win-win for both the equipment manufacturer and carrier
  4. Using SDN to provide the necessary virtualized pipes between users with the necessary policies for advanced services like video-chat, white-boarding, real-time gaming etc.
  5. Using Big Data and Hadoop to analyze Call Detail Records (CDRs) and provide advanced services to customers like differential rates for calls etc

Clearly there will be challenges in this virtualized view of things. Telecom equipment is renowned for its 5 9’s availability. The challenge will be achieving this resiliency, high availability and fault-tolerance with cloud servers. How can WAN latencies be mitigated? How to can SDN provide the QoS required for voice, video and data traffic in IMS?

IMS has many interesting services where video calls from laptops can be transferred as data calls to mobile phones and vice versa, from mobile networks to WiFi  and so on.

Many hurdles will have to be crossed. But this is, in my opinion, will be the path forward.

While the last decade and a half have been bad for the telecom industry, I personally feel we are on the verge on the next big breakthrough in telecom in the next year or two. Telecom will rise like the phoenix from its ashes in the next couple of years

Also see
1. A crime map of India in R: Crimes against women
2.  What’s up Watson? Using IBM Watson’s QAAPI with Bluemix, NodeExpress – Part 1
3.  Bend it like Bluemix, MongoDB with autoscaling – Part 2
4. Informed choices through Machine Learning : Analyzing Kohli, Tendulkar and Dravid
5. Thinking Web Scale (TWS-3): Map-Reduce – Bring compute to data
6. Deblurring with OpenCV:Weiner filter reloaded

Thinking Web Scale (TWS-3): Map-Reduce – Bring compute to data

In the last decade and a half, there has arisen a class of problem that are becoming very critical in the computing domain. These problems deal with computing in a highly distributed environments. A key characteristic of this domain is the need to grow elastically with increasing workloads while tolerating failures without missing a beat.  In short I would like to refer to this as ‘Web Scale Computing’ where the number of servers exceeds several 100’s and the data size is of the order of few hundred terabytes to several Exabytes.

There are several features that are unique to large scale distributed systems

  1. The servers used are not specialized machines but regular commodity, off-the-shelf servers
  2. Failures are not the exception but the norm. The design must be resilient to failures
  3. There is no global clock. Each individual server has its own internal clock with its own skew and drift rates. Algorithms exist that can create a notion of a global clock
  4. Operations happen at these machines concurrently. The order of the operations, things like causality and concurrency, can be evaluated through special algorithms like Lamport or Vector clocks
  5. The distributed system must be able to handle failures where servers crash, disk fails or there is a network problem. For this reason data is replicated across servers, so that if one server fails the data can still be obtained from copies residing on other servers.
  6. Since data is replicated there are associated issues of consistency. Algorithms exist that ensure that the replicated data is either ‘strongly’ consistent or ‘eventually’ consistent. Trade-offs are often considered when choosing one of the consistency mechanisms
  7. Leaders are elected democratically.  Then there are dictators who get elected through ‘bully’ing.

In some ways distributed systems behave like a murmuration of starlings (or a school of fish),  where a leader is elected on the fly (pun unintended) and the starlings or fishes change direction based on a few (typically 6) closest neighbors.

This series of posts, Thinking Web Scale (TWS) ,  will be about Web Scale problems and the algorithms designed to address this.  I would like to keep these posts more essay-like and less pedantic.

In the early days,  computing used to be done in a single monolithic machines with its own CPU, RAM and a disk., This situation was fine for a long time,  as technology promptly kept its date with Moore’s Law which stated that the “ computing power  and memory capacity’ will  double every 18 months. However this situation changed drastically as the data generated from machines grew exponentially – whether it was the call detail records, records from retail stores, click streams, tweets, and status updates of social networks of today

These massive amounts of data cannot be handled by a single machine. We need to ‘divide’ and ‘conquer this data for processing. Hence there is a need for a hundreds of servers each handling a slice of the data.

The first post is about the fairly recent computing paradigm “Map-Reduce”.  Map- Reduce is a product of Google Research and was developed to solve their need to calculate create an Inverted Index of Web pages, to compute the Page Rank etc. The algorithm was initially described in a white paper published by Google on the Map-Reduce algorithm. The Page Rank algorithm now powers Google’s search which now almost indispensable in our daily lives.

The Map-Reduce assumes that these servers are not perfect, failure-proof machines. Rather Map-Reduce folds into its design the assumption that the servers are regular, commodity servers performing a part of the task. The hundreds of terabytes of data is split into 16MB to 64MB chunks and distributed into a file system known as ‘Distributed File System (DFS)’.  There are several implementations of the Distributed File System. Each chunk is replicated across servers. One of the servers is designated as the “Master’. This “Master’ allocates tasks to ‘worker’ nodes. A Master Node also keeps track of the location of the chunks and their replicas.

When the Map or Reduce has to process data, the process is started on the server in which the chunk of data resides.

The data is not transferred to the application from another server. The Compute is brought to the data and not the other way around. In other words the process is started on the server where the data, intermediate results reside

The reason for this is that it is more expensive to transmit data. Besides the latencies associated with data transfer can become significant with increasing distances

Map-Reduce had its genesis from a Lisp Construct of the same name

Where one could apply a common operation over a list of elements and then reduce the resulting list of elements with a reduce operation

The Map-Reduce was originally created by Google solve Page Rank problem Now Map-Reduce is used across a wide variety of problems.

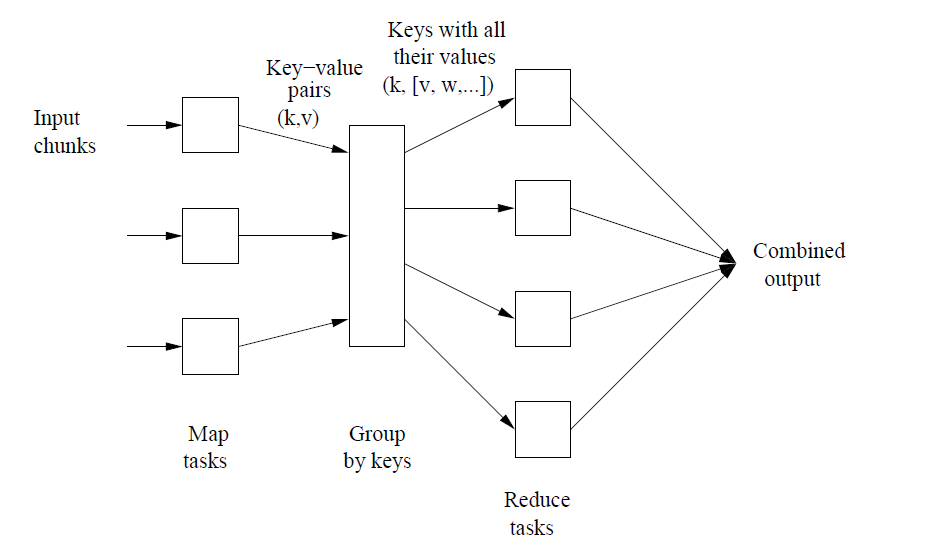
The main components of Map-Reduce are the following

  1. Mapper: Convert all d ∈ D to (key (d), value (d))
  2. Shuffle: Moves all (k, v) and (k’, v’) with k = k’ to same machine.
  3. Reducer: Transforms {(k, v1), (k, v2) . . .} to an output D’ k = f(v1, v2, . . .). …
  4. Combiner: If one machine has multiple (k, v1), (k, v2) with same k then it can perform part of Reduce before Shuffle

A schematic of the Map-Reduce is included below\

2

Map Reduce is usually a perfect fit for problems that have an inherent property of parallelism. To these class of problems the map-reduce paradigm can be applied in simultaneously to a large sets of data.  The “Hello World” equivalent of Map-Reduce is the Word count problem. Here we simultaneously count the occurrences of words in millions of documents

The map operation scans the documents in parallel and outputs a key-value pair. The key is the word and the value is the number of occurrences of the word. E.g. In this case ‘map’ will scan each word and emit the word and the value 1 for the key-value pair

So, if the document contained

“All men are equal. Some men are more equal than others”

Map would output

(all,1),  (men,1), (are,1), (equal,1), (some,1), (men,1), (are,1),  (equal,1), (than,1), (others,1)

The Reduce phase will take the above output and give sum all key value pairs with the same key

(all,1),  (men,2), (are,2),(equal,2), (than,1), (others,1)

So we get to count all the words in the document

In the Map-Reduce the Master node assigns tasks to Worker nodes which process the data on the individual chunks

3

Map-Reduce also makes short work of dealing with large matrices and can crunch matrix operations like matrix addition, subtraction, multiplication etc.

Matrix-Vector multiplication

As an example if we consider a Matrix-Vector multiplication (taken from the book Mining Massive Data Sets by Jure Leskovec, Anand Rajaraman et al

For a n x n matrix if we have M with the value mij in the ith row and jth column. If we need to multiply this with a vector vj, then the matrix-vector product of M x vj is given by xi

1

Here the product of mij x vj   can be performed by the map function and the summation can be performed by a reduce operation. The obvious question is, what if the vector vj or the matrix mij did not fit into memory. In such a situation the vector and matrix are divided into equal sized slices and performed acorss machines. The application would have to work on the data to consolidate the partial results.

Fortunately, several problems in Machine Learning, Computer Vision, Regression and Analytics which require large matrix operations. Map-Reduce can be used very effectively in matrix manipulation operations. Computation of Page Rank itself involves such matrix operations which was one of the triggers for the Map-Reduce paradigm.

Handling failures:  As mentioned earlier the Map-Reduce implementation must be resilient to failures where failures are the norm and not the exception. To handle this the ‘master’ node periodically checks the health of the ‘worker’ nodes by pinging them. If the ping response does not arrive, the master marks the worker as ‘failed’ and restarts the task allocated to worker to generate the output on a server that is accessible.

Stragglers: Executing a job in parallel brings forth the famous saying ‘A chain is as strong as the weakest link’. So if there is one node which is straggler and is delayed in computation due to disk errors, the Master Node starts a backup worker and monitors the progress. When either the straggler or the backup complete, the master kills the other process.

Mining Social Networks, Sentiment Analysis of Twitterverse also utilize Map-Reduce.

However, Map-Reduce is not a panacea for all of the industry’s computing problems (see To Hadoop, or not to Hadoop)

But the Map-Reduce is a very critical paradigm in the distributed computing domain as it is able to handle mountains of data, can handle multiple simultaneous failures, and is blazingly fast.

Also see
1. A crime map of India in R: Crimes against women
2.  What’s up Watson? Using IBM Watson’s QAAPI with Bluemix, NodeExpress – Part 1
3.  Bend it like Bluemix, MongoDB with autoscaling – Part 2
4. Informed choices through Machine Learning : Analyzing Kohli, Tendulkar and Dravid

To see all posts click ‘Index of Posts

The language R

In the universe of programming languages there is a rising staR. It is moving fasteR and getting biggeR and brighteR!

Ok, you get the hint! It is the language R or the R Language.

R language is the successor to the language S. R is extremely powerful for statistical computing and processing. It is an interpreted language much like Python, Perl. The power of the language R comes from the 4000+ software packages that make the R language almost indispensable for any type of statistical computing.

As I mentioned above in my opinion, R, is soon going to play a central role in the technological world. In today’s world we are flooded with data from all sides. To make sense of this information overload we need techniques like Big Data, Analytics and machine learning to make sense of this data deluge. This is where R with its numerous packages that make short work of data becomes critical. The packages also have very interesting graphic packages to display the data in many forms for faster  analysis and easier consumption.

The language R can easily ingest large sets of data in CSV format and perform many computations on them. R language is being used in machine learning, data mining, classification and clustering, text mining besides also being utilized in sentiment analysis from social networks.

The R language contains the usual programming constructs namely logical, loops, assignment etc. The language enables to easily assign values to vectors, matrices, arrays and perform all the associated operations on them.

The R Language can be installed from R-project. The R Language package comes with many datasets which are data collected from various sources. One such dataset is the Iris dataset. The Iris dataset is dataset about the Iris plant( Iris is a genus of 260–300[1][2] species of flowering plants with showy flowers).

The dataset contains 5 parameters

1)      Sepal length 2) Sepal Width 3) Petal length 4) Petal width 5) Species

This dataset has been used in many research papers. R allows you to easily perform any sophisticated set of statistical operations on this data set. Included below are a sample set of operations you can perform on the Iris dataset or any dataset

> iris[1:5,]

Sepal.Length Sepal.Width Petal.Length Petal.Width Species

1          5.1         3.5          1.4         0.2  setosa

2          4.9         3.0          1.4         0.2  setosa

3          4.7         3.2          1.3         0.2  setosa

4          4.6         3.1          1.5         0.2  setosa

5          5.0         3.6          1.4         0.2  setosa

> summary(iris)

Sepal.Length    Sepal.Width     Petal.Length    Petal.Width          Species

Min.   :4.300   Min.   :2.000   Min.   :1.000   Min.   :0.100   setosa    :50

1st Qu.:5.100   1st Qu.:2.800   1st Qu.:1.600   1st Qu.:0.300   versicolor:50

Median :5.800   Median :3.000   Median :4.350   Median :1.300   virginica :50

Mean   :5.843   Mean   :3.057   Mean   :3.758   Mean   :1.199

3rd Qu.:6.400   3rd Qu.:3.300   3rd Qu.:5.100   3rd Qu.:1.800

Max.   :7.900   Max.   :4.400   Max.   :6.900   Max.   :2.500

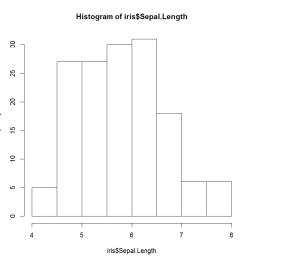
>hist(iris$Sepal.Length)

1

Here is a scatter plot of the Petal width, sepal length and sepal width

>scatterplot3d(iris$Petal.Width, iris$Sepal.Length, iris$Sepal.Width)

2


As can be seen R can really make short work of data with the numerous packages that come along with it. I have just skimmed the surface of R language.

I hope this has whetted your appetite. Do give R a spin!

Watch this space!

You may also like
1. Introducing cricketr! : An R package to analyze performances of cricketers
2. Literacy in India : A deepR dive.
3. Natural Language Processing: What would Shakespeare say?
4. Revisiting crimes against women in India
5. Sixer – R package cricketr’s new Shiny Avatar

Also see
1. Designing a Social Web Portal
2. Design principles of scalable, distributed systems
3. A Cloud Medley with IBM’s Bluemix, Cloudant and Node.js
4. Programming Zen and now – Some essential tips -2 
5. Fun simulation of a Chain in Android

Find me on Google+

Perils and pitfalls of Big Data

Big Data is hurtling towards us in a big way. It is already in the news and the blip seems to getting bigger. Big Data will soon become the key driver for almost any kind of decision that is to be made in manufacturing, retail, finance all the way to astronomy, oceanography etc. The common aspect of all industries and areas is that data is generated in the order of several petabytes to exabytes. Big Data is the technique to analyze such large volumes of data.

Big Data represents the technique to handle the huge deluge of data that is already becoming enmeshed in our lives. Multiple disparate, varied streams of data (text. tweets, click streams, html) flow through with tremendous volume & velocity. The key aspects of data in the world are the volume, variety and the velocity. It is never ending and never seems to stop. How do we handle this deluge? How do we make sense of this data is what Big Data is all about.

Big Data provides algorithms to find patterns, determine trends or classify data depending on the features provided. It is supposed to enable the decision makes to make key decisions based on the answers the algorithms spew forth.

Big Data is also complicated by the fact that data comes is multiple forms from click streams, tweets, html, texts, CSVs, structured and non –structured data.

The ability to detect patterns, determine trends, classify, identify outliers is no easy task

In this post I try to take a philosophical look at Big Data and ask whether it can really help us. Will it help or will take is on wild goose chase? Can we trust the results?

Big Data depends on algorithms to make sense of data. Big Data deals with data that is in the order of Petabytes to Exabytes. At this scale with multiple features our cognitive abilities are of no use. We must rely on machines and algorithms to make sense of these large amounts of data. Our mind can handle a few hundred data points and at most 3 dimensions. Beyond that the data  can hardly make any sense.

Data by itself, in the absence of features & algorithms, is indistinguishable from noise. It is data science that makes sense of data. Data science separates the signal from the noise.

It is the algorithms that try to determine the best fit for a given set of data. But how reliable are the results. For example let us take the following case

1

An unsupervised learning algorithm for the above data points could try to separate the data into 2 sets. Clearly this is one way but what is more appropriate is that we have 2 shapes, the circle & the rectangle. A machine algorithm would try to work based on the features that we choose. Are we in a position to decide whether the answer the algorithm gives us is correct? We have no way of knowing because the amount of data is beyond our cognitive capabilities,

In other words, Big Data is full of perils and pitfalls.

When we let the machine to analyze on our behalf the possibility of coming to a wrong conclusion is fairly high.  This coupled with the fact that we are sometimes led to erroneous judgments, as discussed below, the problem is further compounded.

In his book “Thinking fast, thinking slow” Daniel Kahneman discusses several situations where our mind falls into the traps of lazy thinking. We come to wrong conclusions. Also our minds tend to detect patterns in data where there are none. Sometimes according to Kahneman ‘randomness appears as regularity or a tendency to cluster’. Also he says ‘the tendency to see patterns in randomness is overwhelming’. We could argue that in Big Data it is the algorithm that is determining the pattern we could be tricked into coming to false conclusions. Sometimes the human mind sees causality where there is none. Occasionally we fail to see the obvious.

In the ‘famous gorilla experiment’ the researchers tried to assess selective attention. The participants are asked to count the number of passes those in white t-shirts make. Surprisingly a large number of the participants were complete oblivious a gorilla that appears midway in the video. When we, as human fail to see such large objects, can we expect the machine to accurately identify patterns and perform accurate classifications?

There are techniques that help in determining false positives for e.g. the Bonferroni correction. Simply put the Bonferroni correction tries to determine the possibility of getting at least 1 significant result when one is testing 20 hypothesis simultaneously. If we want to test 20 hypotheses with the significance of 0.05 then the probability of at least 1 significant result is

P(at least one significant result) = 1 – P(no significant results)

= 1 – (1 – 0:05)^20

= 0.64

So, with 20 tests being considered, we have a 64% chance of observing at least one significant result, even if all of the tests are actually not significant. This would be a false positive.

Given that our ability to come to significant conclusions depends largely on being able to choose appropriate features, we must also be able to maneuver between false negatives and false positives. In addition we must also take into account the fallibility of the human mind.

Clearly, Big Data is the future! However with Big Data we are really on treacherous, slippery ground!

Find me on Google+

Close encounters with the future

ss

Published in Telecom Asia, Oct 22,2013 – Close encounters with the future

Where a calculator on the ENIAC is equipped with 18,000 vacuum tubes and weighs 30 tons, computers in the future may have only 1,000 vacuum tubes and perhaps weigh 1.5 tons.—POPULAR MECHANICS, 1949

Introduction: Ray Kurzweil in his non-fiction book “The Singularity is near – When humans transcend biology” predicts that by the year 2045 the Singularity will allow humans to transcend our ‘frail biological bodies’ and our ‘petty, derivative and circumscribed brains’ . Specifically the book claims “that there will be a ‘technological singularity’ in the year 2045, a point where progress is so rapid it outstrips humans’ ability to comprehend it. Irreversibly transformed, people will augment their minds and bodies with genetic alterations, nanotechnology, and artificial intelligence”.

He believes that advances in robotics, AI, nanotechnology and genetics will grow exponentially and will lead us into a future realm of intelligence that will far exceed biological intelligence. This explosion will be the result of ‘accelerating returns from significant advances in technology”

Futurescape

Here is a look at some of the more fascinating key trends in technology. You can decide whether we are heading to Singularity or not.

Autonomous Vehicles (AVs): Self driving cars have moved from the realm of science fiction to reality in recent times. Google’s autonomous cars has already driven around half a million miles. All the major car manufacturers of the world from BMW, Mercedes, Toyota, Nissan, Ford or GM are all coming with their own versions of autonomous cars. These cars are equipped with Adaptive Cruise Control and Collision Avoidance technologies and are already taking away control drivers. Moreover AVs alert drivers, if their attention strays from the road ahead, for too long. Autonomous Vehicles work with the help of Vehicular Communication Technology.

Vehicular Communication along with the Intelligent Transport Systems (ITS) achieves safety by enabling communication between vehicles, people and roads. Vehicle-to-vehicle communications are the fundamental building block of autonomous, self-driving cars. It enables the exchange of data between vehicles and allows automobiles to “see” and adapt to driving obstacles more completely, preventing accidents besides resulting in more efficient driving.

Smart Assistants: From the defeat of Kasparov in chess by IBM’s Deep Blue in 1997, and then subsequently to  the resounding victory of IBM’s Watson in Jeopardy, capable of understanding natural human language, to the more prevalent Apple’s intelligent assistant Siri, Artificially Intelligent  (AI) systems have come a long way. The newest trend in this area is Smart Assistants.  Robots are currently analyzing documents, filling prescriptions, and handling other tasks that were once exclusively done by humans. Smart Assistants are already taking over the tasks of BPO operators, paralegals, store clerks, baby sitters. Robots, in many ways, are not only smarter than humans, but also do not get easily bored,

Intelligent homes and intelligent offices. Rapid advances in technology will be closer to the home both literally and figuratively. The future home will have the ability to detect the presence of people, pets, smoke and changes to humidity, moisture, lighting, temperature. Smart devices will monitor the environment and take appropriate steps to save energy, improve safety and enhance security of homes.  Devices will start learning your habits and enhance your comfort and convenience. Everything from thermostats, fire detectors, washing machines, refrigerators will be equipped electronics that will be capable of adapting to the environment. All gadgets at home will be accessible through laptops, tablets or smartphones from anywhere. We will be able to monitor all aspects of our intelligent home from anywhere.

Smart devices will also make major inroads into offices leading to the birth of intelligent offices where the lighting, heating, cooling will be based on the presence of people in the offices. This will result in an enormous savings in energy. The advances in intelligent homes and intelligent offices will be in the greater context of the Smart Grid.

Swarms of drones: Contrary to the use of weaponized drones for unmanned aerial survey of enemy territory we will soon have commercial drones. Drone will start being used for civilian purposes.  The most compelling aspect of drones these days is the fact that they can be easily manufactured in large quantities, are cheap and can perform complex tasks either singly or collectively. Remotely controlled drones can perform hundreds of civilian jobs, including traffic monitoring, aerial surveying, and oil pipeline inspections and monitoring of crop conditions. Drones are also being employed for conservation of wildlife. In the wilderness of Africa, drones are already helping in providing aerial footage of the landscape, tracking poachers and in also herding elephants. However, before drones become a common sight, it is necessary to ensure that appropriate laws are made for maintaining the safety and security of civilians. This is likely to happen in US in 2015, when the Federal Aviation Administration (FAA) will come up with rules to safely integrate drones into the American skies.

MOOC (Massive Online Open Course): The concept of MOOC, or the ‘Massive Open Online Course’ from top colleges, though just a few years old, is already taking the world by storm. Coursera, edX and Udacity are the top 3 MOOCs besides many others and offer a variety of courses on technology, philosophy, sociology, computer science etc.  As more courses are available online, the requirements of having a uniform start and end date will diminish gradually. The availability of course lectures at all times and through all devices, namely the laptop, tablet or smartphone, will result in large scale adoption by students of all ages.

Contrary to regimented classes MOOCs now allow students to take classes at their own pace. It is likely that some students will breeze through an entire semester worth of classes in a few weeks. It is also likely that a few students will graduate in 4 years with more than a couple of degrees. MOOCs are a natural development considering that the world is going to be more knowledge driven where there will be the need for experts with a diverse set of in-depth skills. Here is an interesting article in WSJ “What College will be like in 2023

3D Printing: This is another technology that is bound to become ubiquitous in our future. 3D printers will revolutionize manufacturing in ways we could never imagine. A 3-D printer is similar to a hot-glue gun attached to a robotic arm. A 3-D printer creates an object by stacking one layer of material, typically plastic or metal, on top of another.  3D printers have been used for making everything from prosthetic limbs, phone cases, lamps all the way to a NASA funded 3D pizza. Here is a great article in New York Times “Dinner is Printed” It is likely that a 3D printer would be indispensable to our future homes much like the refrigerator and microwave.

Artificial sense organs: A recent news items in Science 2.0 “The Future touch sensitive prosthetic limbs”   discusses the invention of a prosthetic limb that can actually provide the sense of touch by stimulating the regions of the brain that deal with the sense of touch. The researchers identified the neural activity that occurs when grasping or feeling an object and successfully induced these patterns in the brain. Two parallel efforts are underway to understand how the human brain works. They are “The Human Brain Project” which has 130 members of the European Union and Obama’s BRAIN project. Both these projects attempt to ‘to give us a deeper and more meaningful understanding of how the human brain operates”. Possibilities as in the movies ‘Avatar’ or ‘Terminator’ may not be far away.

The Others: Besides the above, technologies like Big Data, Cloud Computing, Semantic Web, Internet of Things and Smart Grid will also be swamp us in the future and much has already been said about it.

Conclusion: The above sets of technologies represent seismic shifts and are bound to explode in our future in a million ways.

Given the advances in bionic limbs, Machine Intelligent AI systems, MOOCs, Autonomous Vehicles are we on target for the Singularity?

I wouldn’t be surprised at all!

Find me on Google+

The Next Frontier

Published in Telecom Asia – The next frontier, 21, Mar, 2012

In his classic book “The Innovator’s Dilemma” Prof. Clayton Christensen of Harvard Business School presents several compelling cases of great organizations that fail because they did not address disruptive technologies, occurring in the periphery, with the unique mindset required in managing these disruptions.

In the book the author claims that when these disruptive technologies appeared on the horizon there were few takers for these technologies because there were no immediate applications for them. For e.g. when the hydraulic excavator appeared its performance was inferior to the existing predominant manual excavator. But in course of time the technology behind hydraulic excavators improved significantly to displace existing technologies. Similarly the appearance of 3.5 inch disk had no immediate takers in desktop computers but made its way to the laptop.

Similarly the mini computer giant Digital Equipment Corporation (DEC) ignored the advent of the PC era and focused all its attention on making more powerful mini-computers. This led to the ultimate demise of DEC and several other organizations in this space. This book includes several such examples of organizations that went defunct because disruptive technologies ended up cannibalizing established technologies.

In the last couple of months we have seen technology trends pouring in.  It is now accepted that cloud computing, mobile broadband, social networks, big data, LTE, Smart Grids, and Internet of Things will be key players in the world of our future. We are now at a point in time when serious disruption is not just possible but seems extremely likely. The IT Market Research firm IDC in its Directions 2012 believes that we are in the cusp of a Third Platform that will dominate the IT landscape.

There are several technologies that have been appearing on the periphery and have only gleaned marginal interest for e.g. Super Wi-Fi or Whitespaces which uses unlicensed spectrum to access larger distances of up to 100 kms. Whitespaces has been trialed by a few companies in the last year. Another interesting technology is WiMAX which provides speeds of 40 Mbps for distances of up to 50 km. WiMAX’s deployment has been spotty and has not led to widespread adoption in comparison to its apparent competitor LTE.

In the light of the technology entrants, the disruption in the near future may occur because of a paradigm shift which I would like to refer as the “Neighborhood Area Computing (NAC)” paradigm.  It appears that technology will veer towards neighborhood computing given the bandwidth congestion issues of WAN. A neighborhood area network (NAN) will supplant the WAN for networks which address a community in a smaller geographical area

This will lead to three main trends

Neighborhood Area Networks (NAN):  Major improvements in Neighborhood Area Networks (NAN) are inevitable given the rising importance of smart grids and M2M technology in the context of WAN latencies. Residential homes of the future will have a Home Area Network (HAN) based on bluetooth or Zigbee protocols connecting all electrical appliances. In a smart grid contextNAN provides the connectivity between the Home Area Network (HAN) of a future Smart Home with the WAN network. While it is possible that the utility HAN network will be separate from the IP access network of the residential subscriber, the more likely possibility is that the HAN will be a subnet within the home network and will connect toNAN network.

The data generated from smart grids, m2m networks and mobile broadband will need to be stored and processed immediately through big data analytics on a neighborhood datacenter. Shorter range technologies like WiMAX, Super WiFi/ Whitespaces will transport the data to a neighborhood cloud on which a Hadoop based Big Data analytics will provide real time analytics

Death of the Personal Computer:  The PC/laptop will soon give way to a cloud based computing platform similar to Google’s Chrome book. Not only will we store all our data on the cloud (music, photos, videos) we will also use the cloud for our daily computing needs. Given the high speeds of theNAN this should be quite feasible in the future. The cloud will remove our worries about virus attacks, patch updates and the need to buy new software.  We will also begin to trust our data in the cloud as we progress to the future. Moreover the pay-per-use will be very attractive to consumers.

Exploding Datacenters:  As mentioned above a serious drawback of the cloud is the WAN latency. It is quite likely that with the increases in processing powers and storage capacity coupled with dropping prices that cloud providers will have hundreds of data centers with around 1000 servers for each city rather than a few mega data centers with 10,000’s of servers.  These data centers will address the computing needs of a community in a small geographical area. Such smaller data centers, typically in a small city, will solve 2 problems. One it will build into the cloud geographical redundancy besides also providing excellent performance asNAN latencies will be significantly less in comparison to WAN latencies.

These technologies will improve significantly and fill in the need for handling neighborhood high speed data

The future definitely points to computing in the neighborhood.

Find me on Google+

The promise of predictive analytics

Published in Telecom Asia – Feb 20, 2012 –  The promise of predictive analytics

Published in Telecoms Europe – Feb 20, 2012 – Predictive analytics gold rush due

We are headed towards a more connected, more instrumented and more data driven world. This fact is underscored once again in  Cisco’s latest   Visual Networking Index: Global Mobile Data Traffic Forecast Update, 2011–2016.The statistics from this report is truly mind boggling

By 2016 130 exabytes (130 * 2 ^ 60) will rip through the internet. The number of mobile devices will exceed the human population this year, 2012. By 2016 the number of connected devices will touch almost 10 billion.

The devices that are connected to the net range from mobiles, laptops, tablets, sensors and the millions of devices based on the “internet of things”. All these devices will constantly spew data on the internet and business and strategic decisions will be made by determining patterns, trends and outliers among mountains of data.

Predictive analytics will be a key discipline in our future and experts will be much sought after. Predictive analytics uses statistical methods to mine information and patterns in structured, unstructured and streams of data. The data can be anything from click streams, browsing patterns, tweets, sensor data etc. The data can be static or it could be dynamic. Predictive analytics will have to identify trends from data streams from mobile call records, retail store purchasing patterns etc.

Predictive analytics will be applied across many domains from banking, insurance, retail, telecom, energy. In fact predictive analytics will be the new language of the future akin to what C was a couple of decades ago.  C language was used in all sorts of applications spanning the whole gamut from finance to telecom.

In this context it is worthwhile to mention The R Language. R language is used for statistical programming and graphics. The Wikipedia defines R Language as “R provides a wide variety of statistical and graphical techniques, including linear and nonlinear modeling, classical statistical tests, time-series analysis, classification, clustering, and others”.

Predictive analytics is already being used in traffic management in identifying and preventing traffic gridlocks. Applications have also been identified for energy grids, for water management, besides determining user sentiment by mining data from social networks etc.

One very ambitious undertaking is “the Data-Scope Project” that believes that the universe is made of information and there is a need for a “new eye” to look at this data. The Data-Scope project is described as “a new scientific instrument, capable of ‘observing’ immense volumes of data from various scientific domains such as astronomy, fluid mechanics, and bioinformatics. The system will have over 6PB of storage, about 500GBytes per sec aggregate sequential IO, about 20M IOPS, and about 130TFlops. The Data-Scope is not a traditional multi-user computing cluster, but a new kind of instrument, that enables people to do science with datasets ranging between 100TB and 1000TB The Data-scope project is based on the premise that new discoveries will come from analysis of large amounts of data. Analytics is all about analyzing large datasets and predictive analytics takes it one step further in being able to make intelligent predictions based on available data.

Predictive analytics does open up a whole new universe of possibilities and the applications are endless.  Predictive analytics will be the key tool that will be used in our data intensive future.

Afterthought

I started to wonder whether predictive analytics could be used for some of the problems confronting the world today. Here are a few problems where analytics could be employed

–          Can predictive analytics be used to analyze outbreaks of malaria, cholera or AID and help in preventing their outbreaks in other places?

–          Can analytics analyze economic trends and predict a upward/downward trend ahead of time.

Find me on Google+

Technological hurdles: 2012 and beyond

Published in Telecom Asia, Jan 11,2012 – Technological hurdles – 2012 and beyond

You must have heard it all by now – the technological trends for 2012 and the future. The predictions range over BigData, cloud computing, internet of things, LTE, semantic web, social commerce and so on.

In this post, I thought I should focus on what seems to be significant hurdles as we advance to the future. So for a change, I wanted to play the doomsayer rather than a soothsayer. The positive trends are bound to continue and in our exuberance we may lose sight of the hurdles before us. Besides, “problems are usually opportunities in disguise”. So here is my list of the top issues that is facing the industry now.

Bandwidth shortage: A key issue of the computing infrastructure of today is data affinity, which is the result of the dual issues of data latency and the economics of data transfer. Jim Gray (Turing award in 1998) whose paper on “Distributed Computing Economics” states that that programs need to be migrated to the data on which they operate rather than transferring large amounts of data to the programs. In this paper Jim Gray tells us that the economics of today’s computing depends on four factors namely computation, networking, database storage and database access. He then equates $1 as follows

One dollar equates to

= 1 $

≈ 1 GB sent over the WAN

≈ 10 Tops (tera cpu operations)

≈ 8 hours of cpu time

≈ 1 GB disk space

≈ 10 M database accesses

≈ 10 TB of disk bandwidth

≈ 10 TB of LAN bandwidth

As can be seen from above breakup, there is a disproportionate contribution by the WAN bandwidth in comparison to the others.  In others words while the processing power of CPUs and the storage capacities have multiplied accompanied by dropping prices, the cost of bandwidth has been high. Moreover the available bandwidth is insufficient to handle the explosion of data traffic.

In fact it has been found that  the “cheapest and fastest way to move a Terabyte cross country is sneakernet (i.e. the transfer of electronic information, especially computer files, by physically carrying removable media such as magnetic tape, compact discs, DVDs, USB flash drives, or external drives from one computer to another).

With the burgeoning of bandwidth hungry applications it is obvious that we are going to face a bandwidth shortage. The industry will have to come with innovative solutions to provide what I would like to refer as “bandwidth-on-demand”.

The Spectrum Crunch: Powerful smartphones, extremely fast networks, content-rich applications, and increasing user awareness, have together resulted in a virtual explosion of mobile broadband data usage. There are 2 key drivers behind this phenomenal growth in mobile data. One is the explosion of devices-smartphones, tablet PCs, e-readers, laptops with wireless access. The second is video. Over 30% of overall mobile data traffic is video streaming, which is extremely bandwidth hungry. All these devices deliver high-speed content and web browsing on the move. The second is video. Over 30% of overall mobile data traffic is video streaming, which is extremely bandwidth hungry. The rest of the traffic is web browsing, file downloads, and email

The growth in mobile data traffic has been exponential. According to a report by Ericsson, mobile data is expected to double annually till 2015. Mobile broadband will see a billion subscribers this year (2011), and possibly touch 5 billion by 2015.

In an IDATE (a consulting firm) report,  the total mobile data will exceed 127 exabytes (an exabyte is 1018 bytes, or 1 mn terabytes) by 2020, an increase of over 33% from 2010).

Given the current usage trends, coupled with the theoretical limits of available spectrum, the world will run out of available spectrum for the growing army of mobile users. The current spectrum availability cannot support the surge in mobile data traffic indefinitely, and demand for wireless capacity will outstrip spectrum availability by the middle of this decade or by 2014.

This is a really serious problem. In fact, it is a serious enough issue to have the White House raise a memo titled “Unleashing the Wireless Broadband Revolution”. Now the US Federal Communication Commission (FCC) has taken the step to meet the demand by letting wireless users access content via unused airwaves on the broadcast spectrum known as “White Spaces”. Google and Microsoft are already working on this technology which will allow laptops, smartphones and other wireless devices to transfer in GB instead of MB thro Wi-Fi.

But spectrum shortage is an immediate problem that needs to be addressed immediately.

IPv4 exhaustion: IPv4 address space exhaustion has been around for quite some time and warrants serious attention in the not too distant future.  This problem may be even more serious than the Y2K problem. The issue is that IPv4 can address only 2^32 or 4.3 billion devices. Already the pool has been exhausted because of new technologies like IMS which uses an all IP Core and the Internet of things with more devices, sensors connected to the internet – each identified by an IP address. The solution to this problem has been addressed long back and requires that the Internet adopt IPv6 addressing scheme. IPv6 uses 128-bit long address and allows 3.4 x 1038 or 340 trillion, trillion, trillion unique addresses. However the conversion to IPv6 is not happening at the required pace and pretty soon will have to be adopted on war footing. It is clear that while the transition takes place, both IPv4 and IPv6 will co-exist so there will be an additional requirement of devices on the internet to be able to convert from one to another.

We are bound to run into a wall if organizations and enterprises do not upgrade their devices to be able to handle IPv6.

Conclusion: These are some of the technological hurdles that confront the computing industry.  Given mankind’s ability to come up with innovative solutions we may find new industries being spawned in solving these bottlenecks.

Find me on Google+

Big Data – Getting bigger!

Published in Telecom Asia – Big Data is getting bigger

There are two very significant ways that our world has changed in the past decade. Firstly, we are more “connected”. Secondly we are “awash with data.” In a planet with 7 billion people there are now 2 billion PCs and upward of 6 billion mobile connections. Besides the connection which we as human beings have there are now numerous connections to the internet from devices, sensors and actuators. In other words the world is getting more and more instrumented. There are in excess of 30 billion RFID tags which enable tracking of goods as they move from warehouse, to retail store, sensors on cars and bridges besides cardiac implants in the human body that are constantly sending a stream of data to the network (do look at my post The Internet of Things” . In addition we have the emergence of the Smart Grid with its millions and millions of smart meters that are capable of sensing power loads and appropriately redistributing power and drawing less power during peak hours.

All these devices be it laptops, cell phones, sensors, RFIDs or smart meters are sending enormous amounts of data to the network. In other words there is an enormous data overload happening in the networks of today. According to a Cisco report the projected increase in data traffic between 2014 and 2015 is of the order of 200 exabytes (10^18)). In addition the report states that the total number of connected to the network will be twice the world population or around 15 billion).

Fortunately the explosion in data has been accompanied by falling prices in storage and extraordinary increases in processing capacity. The data that is generated by the devices by the devices, cell phones, PC etc by themselves are useless. However if processed they can provide insights into trends and patterns which can be used to make key decisions. For e.g. the data exhaust that comes from a user’s browsing trail, click stream provide important insight into user behavior which can be mined to make important decisions. Similarly inputs from social media like Twitter, Facebook provide businesses with key inputs which can be used for making business decisions. Call Detail records that are created for mobile calls can also be a source of user behavior. Data from retail store provide insights into consumer choices. For all these to happen the enormous amounts of data has to be analyzed using algorithms to determine statistical trends, patterns and tendencies in the data.

It is here that Big Data enters the picture. Big Data enables the management of the 3 V’s of data , namely volume, velocity and variety. As mentioned above the volume of data is growing at an exponential rate and should exceed 200 exabytes by 2015. The rate at which the data is generated, or the velocity, is also growing phenomenally given the variety and the number of devices that are connected to the network. Besides there is a tremendous variety to the data. Data is both structured, semi-structured and unstructured. Logs could be in plain text, CSV,XML, JSON and so on. The issue of 3 V’s of data makes Big Data most suited for crunching this enormous proliferation of data at the velocity at which it is generated.

Big Data : Big Data or Analytics (see my post “The Rise of Analytics” ) deals with the algorithms that analyze petabytes (10^15)of data and identify key patterns in them. The patterns that are so identified can be used to make important predictions in the future. For example Big Data has been used by energy companies in identifying key locations for positioning their wind turbines. To identify the precise location requires that petabytes of data be crunched rapidly and appropriate patterns be identified. There are several applications of Big Data including identifying brand sentiment from social media, to customer behavior from click exhaust to identifying optimal power usage by consumers.

The key difference between Big Data and traditional processing methods are that the volume of data that has be processed and the speed with which it has to be processed. As mentioned before the 3 V’s of volume, velocity and variety make traditional methods unsuitable for handling this data. In this context, besides the key algorithms of analytics another player is extremely important in Big Data – that is Hadoop. Hadoop is a processing technique that involves tremendous parallelization of the task (for details look at To Hadoop, or not to Hadoop)

The Hadoop Ecosystem – Hadoop had its origins at Google during its work with the Google’s File System (GFS) and the Map Reduce programming paradigm.

HDFS and Map-Reduce : Hadoop in essence is the Hadoop Distributed File System (HDFS) and the Map Reduce paradigm. The Hadoop System is made up of thousands of distributed commodity servers. The data is stored in the HDFS in blocks of 64 MB or 128 MB. The data is replicated among two or more servers to maintain redundancy. Since Hadoop is made of regular commodity servers which are prone to failures, fault tolerance is included by design. The Map Reduce Paradigm essentially breaks a job into multiple tasks which are executed in parallel. Initially the “Map” part processes the input data and outputs a pair of tuples. The “Reduce” part then scans the pair of tuples and generates a consolidated output. For e.g. The “map” part could count the number of occurrences of different words in different sets of files and output the words and their count as pairs. The “reduce” would then sum up the counts of the word from the individual ‘map’ parts and provide the total occurrences of the words in multiple files.

Pig and PigLatin : This is a programming language developed at Yahoo to relieve programmers of the intricacies of programming the Map-Reduce and assigning tasks to individual parts. Pig is made up of two parts namely PigLatin, the language and the environment in which it will execute.

Hive: Hive is a Hadoop run-time support structure that was developed by Facebook. Hive has a distinct SQL flavor to it and also simplifies the task of Hadoop programming.

JAQL : JAQL is a declarative query language developed by IBM for handling JSON objects. JAQL is another programming paradigm that is used to programming Hadoop.

Conclusion: It is a foregone conclusion that Big Data and Hadoop will take center stage in the not too distant future given the explosion of data and the dire need of being able to glean useful business insights from them. Big Data and its algorithms provide the way for identifying useful pearls of wisdom from otherwise useless data. Big Data is bound to become mission critical in the enterprises of the future.

Find me on Google+

Technologies to watch: 2012 and beyond

Published in Telecom Asia – Technologies to watch:2012 and beyond

Published in Telecoms Europe – Hot technologies for 2012 and beyond

A keen observer of the technological firmament, today, will observe a grand spectacle of diverse technological events. Some technological trends will blaze a trail and will become trend setters while others will vanish without a trace. The factors that make certain technologies to endure in comparison to others could be many, ranging from pure necessity to a coolness factor, from innovativeness to a cost factor.  This article looks at some of the technologies that are certain to be trail blazers in the years to come

Software Defined Networks (SDNs):  Software Defined Networks (SDNs) are based on the path breaking paradigm of separating the control of a network flow from the actual flow of data. SDN is the result of pioneering effort by Stanford University and University of California, Berkeley and is based on the Open Flow Protocol and represents a paradigm shift to the way networking elements operate. Software Defined Networks (SDN) decouples the routing and switching of the data flows and moves the control of the flow to a separate network element namely, the Flow controller.   The motivation for this is that the flow of data packets through the network can be controlled in a programmatic manner. The OpenFlow Protocol has 3 components to it. The Flow Controller that controls the flows, the OpenFlow switch and the Flow Table and a secure connection between the Flow Controller and the OpenFlow switch. Software Define Networks (SDNs) also include the ability to virtualize the network resources. Virtualized network resources are known as a “network slice”. A slice can span several network elements including the network backbone, routers and hosts. The ability to control multiple traffic flows programmatically provides enormous flexibility and power in the hands of users.  SDNs are bound to be the networks elements of the future.

Smart Grids: The energy industry is delicately poised for a complete transformation with the evolution of the smart grid concept. There is now an imminent need for an increased efficiency in power generation, transmission and distribution coupled with a reduction of energy losses. In this context many leading players in the energy industry are coming up with a connected end-to-end digital grid to smartly manage energy transmission and distribution.  The digital grid will have smart meters, sensors and other devices distributed throughout the grid capable of sensing, collecting, analyzing and distributing the data to devices that can take action on them. The huge volume of collected data will be sent to intelligent device which will use the wireless 3G networks to transmit the data.  Appropriate action like alternate routing and optimal energy distribution would then happen. Smart Grids are a certainty given that this technology addresses the dire need of efficient energy management. Smart Grids besides managing energy efficiently also save costs by preventing inefficiency and energy losses.

The NoSQL Paradigm: In large web applications where performance and scalability are key concerns a non –relational database like NoSQL is a better choice to the more traditional relational databases. There are several examples of such databases – the more reputed are Google’s BigTable,   HBase, Amazon’s Dynamo, CouchDB  & MongoDB. These databases partition the data horizontally and distribute it among many regular commodity servers.  Accesses to the data are based on get(key) or set(key, value) type of APIs. Accesses to the data are based on a consistent hashing scheme for example the Distributed Hash Table (DHT) method. The ability to distribute data and the queries to one of several servers provides the key benefit of scalability. Clearly having a single database handling an enormous amount of transactions will result in performance degradation as the number of transaction increases. Applications that have to frequently access and manage petabytes of data will clearly have to move to the NoSQL paradigm of databases.

Near Field Communications (NFC): Near Field Communications (NFC) is a technology whose time has come. Mobile phones enabled with NFC technology can be used for a variety of purposes. One such purpose is integrating credit card functionality into mobile phones using NFC. Already the major players in mobile are integrating NFC into their newer versions of mobile phones including Apple’s iPhone, Google’s Android, and Nokia. We will never again have to carry in our wallets with a stack of credit cards. Our mobile phone will double up as a Visa, MasterCard, etc. NFC also allows retail stores to send promotional coupons to subscribers who are in the vicinity of the shopping mall. Posters or trailers of movies running in a theatre can be sent as multi-media clips when travelling near a movie hall. NFC also allows retail stores to send promotional coupons to subscribers who are  in the vicinity of the shopping mall besides allowing exchanging contact lists with friends when they are close proximity.

The Other Suspects: Besides the above we have other usual suspects

Long Term Evolution (LTE): LTE enables is latest wireless technology that enables wireless access speeds of up to 56 Mbps. With the burgeoning interest in tablets, smartphones with the countless apps LTE will be used heavily as we move along. For a vision of where telecom is headed, do read my post ‘The Future of Telecom“.

Cloud Computing: Cloud Computing is the other technology that is bound to gain momentum in the years ahead. Besides obviating the need for upfront capital expenditure the cloud enables quick and easy deployment of applications. Moreover the elasticity of the cloud will make it irresistible to large enterprises and corporations.

The above is a list of technologies to watch as create new paths and blaze new trails. All these technologies are bound to transform the world as we know it and make our lives easier, better and more comfortable. These are the technologies that we need to focus on as we move bravely into our future. Do read my post for the year 2011 “Technology Trends – 2011 and beyond

Find me on Google+