Computing IPL player similarity using Embeddings, Deep Learning

In this post, I revisit the visualisation of IPL batsman and bowler similarities using Google’s Embedding Projector. I had previously done this using multivariate regression in my earlier post ‘Using embeddings, collaborative filtering with Deep Learning to analyse T20 players.’ However, I was not too satisfied with the result since I was not getting the required accuracy.

This post uses the win-loss status of IPL matches from 2014 onwards upto 2023 in Logistic Regression with Deep Learning. A 16-dimensional embedding layer is added for the batsman and the bowler for ball-by-ball data. Since I have used a reduced size data set (from 2014) I get a slightly reduced accuracy, but still I think this is a well-formulated problem.

A Deep Learning network performs gradient descent based using Adam optimisation to arrive at an accuracy of 0.8047. The weights of the learnt Deep Learning network in ‘layer 0’ is used for displaying the batsman and bowler similarities.

Similarity measures – Cosine similarity

A cosine similarity is a value that is bound by a constrained range of 0 and 1. The closer the value is to 0 means that the two vectors are orthogonal or perpendicular to each other. When the value is closer to one, it means the angle is smaller and the batsman and bowler are similar.

a) Data set

For the data set only IPL T20 matches from Jan 2014 upto the present (May 2023) was taken. A Deep Learning model using Logistic Regression with batsman and bowler embedding is used to minimise the error. An accuracy of 0.8047 is obtained. In my earlier post ‘GooglyPlusPlus: Win Probability using Deep Learning and player embeddings‘ I had used data from all T20 leagues (~1.2 million rows) and got an accuracy of 0.8647

b) Import the data

import pandas as pd
import numpy as np
from zipfile import ZipFile
import tensorflow as tf
from tensorflow import keras
from tensorflow.keras import layers
from tensorflow.keras import regularizers
from pathlib import Path
import matplotlib.pyplot as plt

import pandas as pd
import numpy as np
from zipfile import ZipFile
import tensorflow as tf
from tensorflow import keras
from tensorflow.keras import layers
from tensorflow.keras import regularizers

df1=pd.read_csv('ipl2014_23.csv')
print("Shape of dataframe=",df1.shape)

train_dataset = df1.sample(frac=0.8,random_state=0)
test_dataset = df1.drop(train_dataset.index)
train_dataset1 = train_dataset[['batsmanIdx','bowlerIdx','ballNum','ballsRemaining','runs','runRate','numWickets','runsMomentum','perfIndex']]
test_dataset1 = test_dataset[['batsmanIdx','bowlerIdx','ballNum','ballsRemaining','runs','runRate','numWickets','runsMomentum','perfIndex']]
train_dataset1
train_labels = train_dataset.pop('isWinner')
test_labels = test_dataset.pop('isWinner')
train_dataset1

a=train_dataset1.describe()
stats=a.transpose

Shape of dataframe= (138896, 10)
batsmanIdx	bowlerIdx	ballNum	ballsRemaining	runs	runRate	numWickets	runsMomentum	perfIndex
count	111117.000000	111117.000000	111117.000000	111117.000000	111117.000000	111117.000000	111117.000000	111117.000000	111117.000000
mean	218.672939	169.204145	120.372067	60.749822	86.881701	1.636353	2.423167	0.296061	10.578927
std	118.405729	96.934754	69.991408	35.298794	51.643164	2.672564	2.085956	0.620872	4.436981
min	1.000000	1.000000	1.000000	1.000000	-5.000000	-5.000000	0.000000	0.057143	0.000000
25%	111.000000	89.000000	60.000000	30.000000	45.000000	1.160000	1.000000	0.106383	7.733333
50%	220.000000	170.000000	119.000000	60.000000	85.000000	1.375000	2.000000	0.142857	10.329545
75%	325.000000	249.000000	180.000000	91.000000	126.000000	1.640000	4.000000	0.240000	13.108696
max	411.000000	332.000000	262.000000	135.000000	258.000000	251.000000	10.000000	11.000000	66.000000

c) Create a Deep Learning ML model using batsman & bowler embeddings

import pandas as pd
import numpy as np
from keras.layers import Input, Embedding, Flatten, Dense
from keras.models import Model
from keras.layers import Input, Embedding, Flatten, Dense, Reshape, Concatenate, Dropout
from keras.models import Model

tf.random.set_seed(432)
# create input layers for each of the predictors
batsmanIdx_input = Input(shape=(1,), name='batsmanIdx')
bowlerIdx_input = Input(shape=(1,), name='bowlerIdx')
ballNum_input = Input(shape=(1,), name='ballNum')
ballsRemaining_input = Input(shape=(1,), name='ballsRemaining')
runs_input = Input(shape=(1,), name='runs')
runRate_input = Input(shape=(1,), name='runRate')
numWickets_input = Input(shape=(1,), name='numWickets')
runsMomentum_input = Input(shape=(1,), name='runsMomentum')
perfIndex_input = Input(shape=(1,), name='perfIndex')

# Set the embedding size
no_of_unique_batman=len(df1["batsmanIdx"].unique())
print(no_of_unique_batman)
no_of_unique_bowler=len(df1["bowlerIdx"].unique())
print(no_of_unique_bowler)
embedding_size_bat = no_of_unique_batman ** (1/4)
embedding_size_bwl = no_of_unique_bowler ** (1/4)


# create embedding layer for the categorical predictor
batsmanIdx_embedding = Embedding(input_dim=no_of_unique_batman+1, output_dim=16,input_length=1)(batsmanIdx_input)
batsmanIdx_flatten = Flatten()(batsmanIdx_embedding)
bowlerIdx_embedding = Embedding(input_dim=no_of_unique_bowler+1, output_dim=16,input_length=1)(bowlerIdx_input)
bowlerIdx_flatten = Flatten()(bowlerIdx_embedding)

# concatenate all the predictors
x = keras.layers.concatenate([batsmanIdx_flatten,bowlerIdx_flatten, ballNum_input, ballsRemaining_input, runs_input, runRate_input, numWickets_input, runsMomentum_input, perfIndex_input])

# add hidden layers
#x = Dense(64, activation='relu')(x)
#x = Dropout(0.1)(x)
x = Dense(32, activation='relu')(x)
x = Dropout(0.1)(x)
x = Dense(16, activation='relu')(x)
x = Dropout(0.1)(x)
x = Dense(8, activation='relu')(x)
x = Dropout(0.1)(x)
# add output layer
output = Dense(1, activation='sigmoid', name='output')(x)
print(output.shape)
# create model
model = Model(inputs=[batsmanIdx_input,bowlerIdx_input, ballNum_input, ballsRemaining_input, runs_input, runRate_input, numWickets_input, runsMomentum_input, perfIndex_input], outputs=output)
model.summary()

# compile model
optimizer=keras.optimizers.Adam(learning_rate=.01, beta_1=0.9, beta_2=0.999, epsilon=1e-07, amsgrad=True)

model.compile(optimizer=optimizer, loss='binary_crossentropy', metrics=['accuracy'])

# train the model
history=model.fit([train_dataset1['batsmanIdx'],train_dataset1['bowlerIdx'],train_dataset1['ballNum'],train_dataset1['ballsRemaining'],train_dataset1['runs'],
           train_dataset1['runRate'],train_dataset1['numWickets'],train_dataset1['runsMomentum'],train_dataset1['perfIndex']], train_labels, epochs=40, batch_size=1024,
          validation_data = ([test_dataset1['batsmanIdx'],test_dataset1['bowlerIdx'],test_dataset1['ballNum'],test_dataset1['ballsRemaining'],test_dataset1['runs'],
           test_dataset1['runRate'],test_dataset1['numWickets'],test_dataset1['runsMomentum'],test_dataset1['perfIndex']],test_labels), verbose=1)

plt.plot(history.history["loss"])
plt.plot(history.history["val_loss"])
plt.title("model loss")
plt.ylabel("loss")
plt.xlabel("epoch")
plt.legend(["train", "test"], loc="upper left")
plt.show()

d) Project embeddings with Google’s Embedding projector

try:
  # %tensorflow_version only exists in Colab.
  %tensorflow_version 2.x
except Exception:
  pass

%load_ext tensorboard
import os
import tensorflow as tf
import tensorflow_datasets as tfds
from tensorboard.plugins import projector

%pwd
# Set up a logs directory, so Tensorboard knows where to look for files.
log_dir='/logs/batsmen/'
if not os.path.exists(log_dir):
    os.makedirs(log_dir)

df3=pd.read_csv('batsmen.csv')
batsmen = df3["batsman"].unique().tolist()
batsmen
# Create dictionary of batsman to index
batsmen2index = {x: i for i, x in enumerate(batsmen)}
batsmen2index
# Create dictionary of index to batsman
index2batsmen = {i: x for i, x in enumerate(batsmen)}
index2batsmen


# Save Labels separately on a line-by-line manner.
with open(os.path.join(log_dir, 'metadata.tsv'), "w") as f:
  for batsmanIdx in range(1, 411):
       # Get the name of batsman associated at the current index
        batsman = index2batsmen.get([batsmanIdx][0])

        f.write("{}\n".format(batsman))

# Save the weights we want to analyze as a variable. Note that the first
# value represents any unknown word, which is not in the metadata, here
# we will remove this value.
weights = tf.Variable(model.get_weights()[0][1:])
print(weights)
print(type(weights))
print(len(model.get_weights()[0]))
# Create a checkpoint from embedding, the filename and key are the
# name of the tensor.
checkpoint = tf.train.Checkpoint(embedding=weights)
checkpoint.save(os.path.join(log_dir, "embedding.ckpt"))

# Set up config.
config = projector.ProjectorConfig()
embedding = config.embeddings.add()
# The name of the tensor will be suffixed by `/.ATTRIBUTES/VARIABLE_VALUE`.
embedding.tensor_name = "embedding/.ATTRIBUTES/VARIABLE_VALUE"
embedding.metadata_path = 'metadata.tsv'
projector.visualize_embeddings(log_dir, config)
# Now run tensorboard against on log data we just saved.

%reload_ext tensorboard
%tensorboard --logdir /logs/batsmen/

e) Here are similarity measures for some batsmen

I) Principal Component Analysis (PCA) : In the charts and video animation below, the 16-dimensional embedding vector of batsmen and bowler is reduced to 3 principal components in a lower dimension for visualisation and analysis as shown below

a) Yashasvi Jaiswal (similar players

i) PCA – Chart

Yashasvi Jaiswal style of attack is similar to Faf Du Plessis, Quentim De Kock, Bravo etc. In the below chart the ange between Jaiswal and SP Narine is 0.109, and Faf du Plessis is 0.253. These represent the angle in radians. The smaller the angle the more similar the performance style of the players and cos 0=1 or the players are similar.

ii) PCA animation video for Yashasvi Jaiswal

b) Suryakumar Yadav (SKY)

i) PCA -Chart

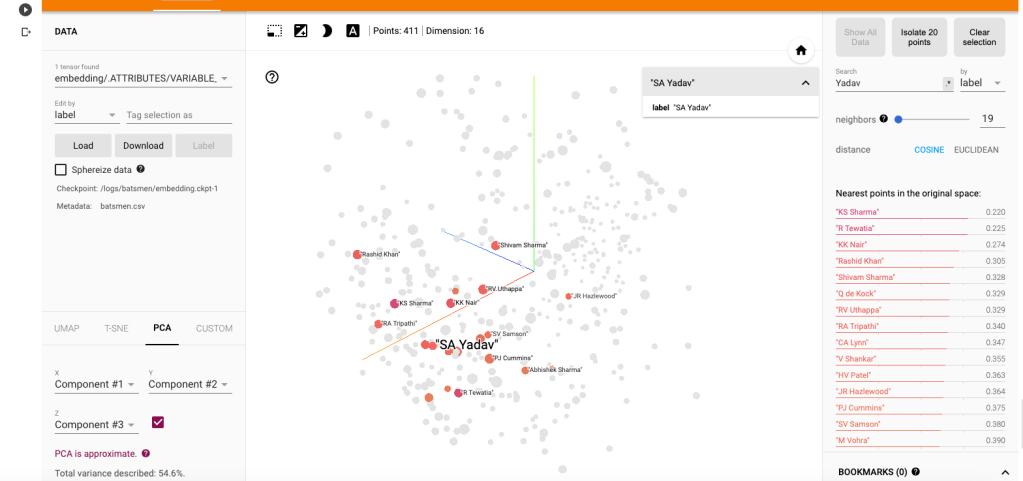
The closest neighbours for SKY is RV Uthappa, Rahul Tripathi, Q de Kock, Samson, Rashid Khan
ii) PCA – Animation video for Suryakumar Yadav

c) M S Dhoni

i) PCA – Chart

Dhoni rubs shoulders with Bravo, AB De Villiers, Shane Watson, Chris Gayle, Rayadu, Gautam Gambhir

ii) PCA – Animation video for M S Dhoni

f) PCA Analysis for bowlers

a) Jasprit Bumrah

i) PCA – Chart

Bumrah bowling performance is similar to Josh Hazzlewood, Chameera, Kuldeep Yadav, Nortje, Adam Zampa etc.

ii) PCA Animation video for Jasprit Bumrah

b) Yuzhvendra Chahal

i) PCA – Chart

Chahal’s performance has a strong similarity to Malinga, Zaheer Khan, Imran Tahir, R Sheperd, Adil Rashid

ii) PCA Animation video for YS Chahal

f) Other similarity measures ( t-SNE & UMAP)

There are 2 other similarity visualisations in Google’s Embedding Projector namely

i) t-SNE (t-distributed Stochastic Neighbor Embedding) – t-SNE tries to find a faithful representation of the data distribution in higher dimensional space to a lower dimensional space. t-SNE differs from PCA by preserving only or local similarities whereas PCA is maintains preserving large pairwise distances.

a) t-SNE Animation video

ii) UMAP – Uniform Manifold Approximation and Projection

UMAP learns the manifold structure of the high dimensional data and finds a low dimensional embedding that preserves the essential topological structure of that manifold.

ii) UMAP – Animation video

The Embedding projector thus helps in identifying players based on how they perform against bowlers, and probably picks up a lot of features like strike rate and performance in different stages of the game.

Hope you enjoyed the post!

Also see

  1. Exploring Quantum Gate operations with QCSimulator
  2. De-blurring revisited with Wiener filter using OpenCV
  3. Using Reinforcement Learning to solve Gridworld
  4. Deep Learning from first principles in Python, R and Octave – Part 4
  5. Big Data 6: The T20 Dance of Apache NiFi and yorkpy
  6. Latency, throughput implications for the Cloud
  7. Programming languages in layman’s language
  8. Practical Machine Learning with R and Python – Part 6
  9. Using Linear Programming (LP) for optimizing bowling change or batting lineup in T20 cricket
  10. A closer look at “Robot Horse on a Trot” in Android

To see all posts click Index of posts

GooglyPlusPlus2021 enhanced with drill-down batsman, bowler analytics

This latest update to GooglyPlusPlus2021 includes the following changes

a) All the functions in the ‘Batsman’ and ‘Bowler ‘tabs now include a date range, which allows you specify a period of interest.

b) The ‘Rank Batsman’ and ‘Rank Bowler’ tabs also include a date range selector, against the earlier version which had a ‘Since year’ slider see GooglyPlusPlus2021 bubbles up top T20 players in all formats!. The earlier ‘Since year’ slider option could only rank for the latest year or for all years up to the current year. Now with the new ‘date range’ picker we can check the batsman and bowler ranks in any IPL season or (any T20 format) or for a range of years.

c) Note: The Head-to-head and Overall performance tabs already include a date range selector.

There are 10 batsman functions and 9 bowler function that have changed for the following T20 and ODI formats and Rank batsman and bowler includes the ‘date range’ and has changed for all T20 formats.

GooglyPlusPlus2021 supports all the following T20 formats

i) IPL ii) Intl T20(men) iii) Intl T20(women) iv) BBL v) NTB vi) PSL vii) WBB viii) CPL ix) SSM T20 formats – ( 9 T20 panels)

i) ODI (men) ii) ODI (women) – 2 ODI panels

i.e. the changes impact (10 + 9) x 11 + (1 + 1 ) x 9 = 227 tabs which have been changed

The addition of date range enables a fine-grained analysis of players as the players progress through the years.

Note: All charts are interactive. To see how to use interactive charts of GooglyPlusPlus2021 see

GooglyPlusPlus2021 is now fully interactive!!!

GooglyPlusPlus2021 is based on my R package yorkr. The data is take from Cricsheet

You can clone/fork this latest version of GooglyPlusPlus2021 from Github at gpp2021-7

Check out the Shiny app here GooglyPlusPlus2021!!!

I have included some random screen shots of some of using these tabs and options in GooglyPlusPlus2021.

A) KL Rahul’s Cumulative average in IPL 2021 vs IPL 2020

a) KL Rahul in IPL 2021

b) KL Rahul in IPL 2020

B) Performance of Babar Azam in Intl. T20 (men)

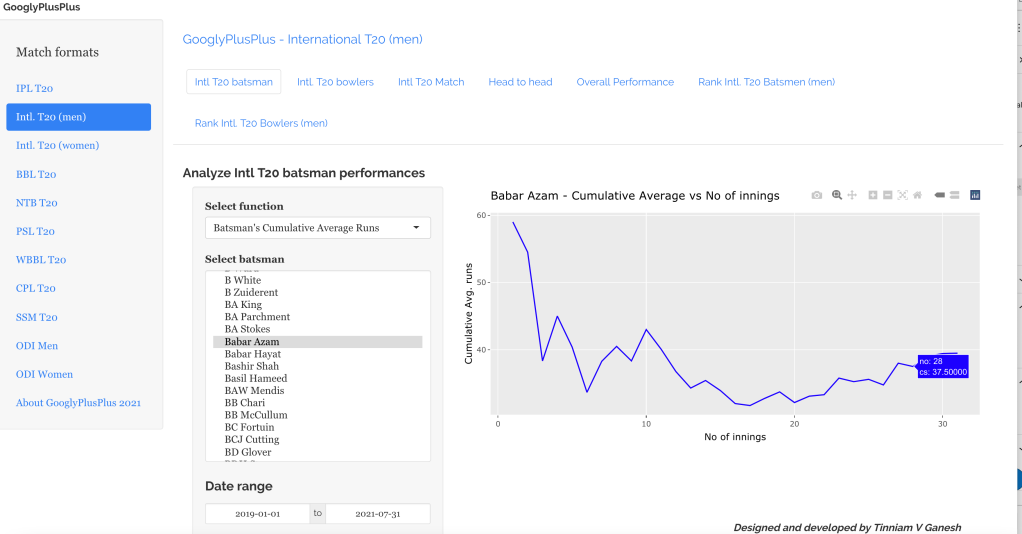
a) Babar Azam’s cumulative average from 2019

b) Babar Azam’s Runs against opposition since 2019

Note: Intl. T20 (women) data available upto Mar 2020 from Cricsheet

a) A J Healy performance between 2010 – 2015

b) A J Healy performance between 2015 – 2020

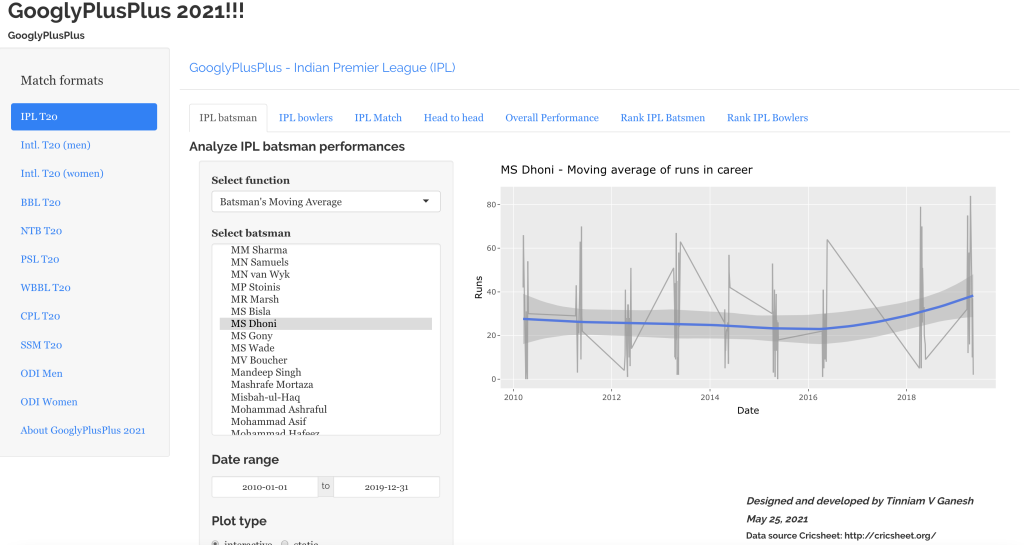
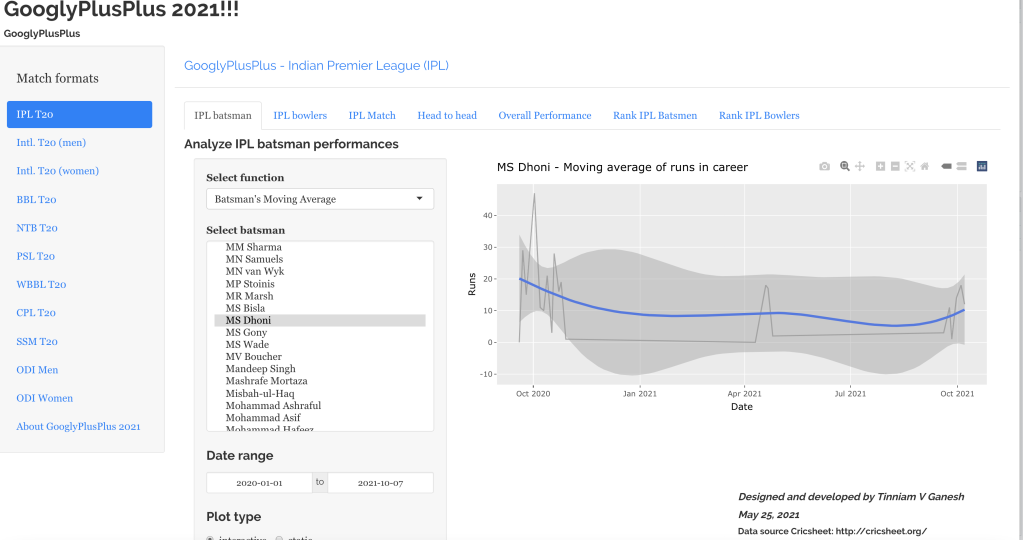
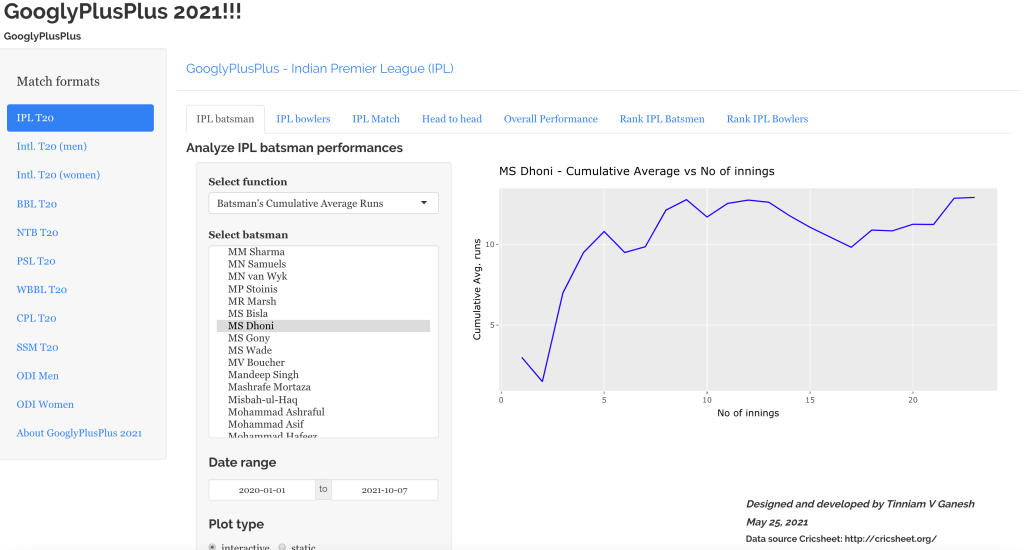
D) M S Dhoni’s performance with the bat pre-2020 and post 2020

There has been a significant decline in Dhoni’s performance in the last couple of years

I) Dhoni’s performance from Jan 2010 to Dec 2019

a) Moving average at 25+ (Dhoni before)

The moving average actually moves up…

b) Cumulative average at 25+ (Dhoni before)

c) Cumulative Strike rate 140+ (Dhoni before)

d) Dhoni’s moving average is ~10-12 (post 2020)

e) Dhoni’s cumulative average (post 2020)

f) Dhoni’s strike rate ~80 (post 2020)

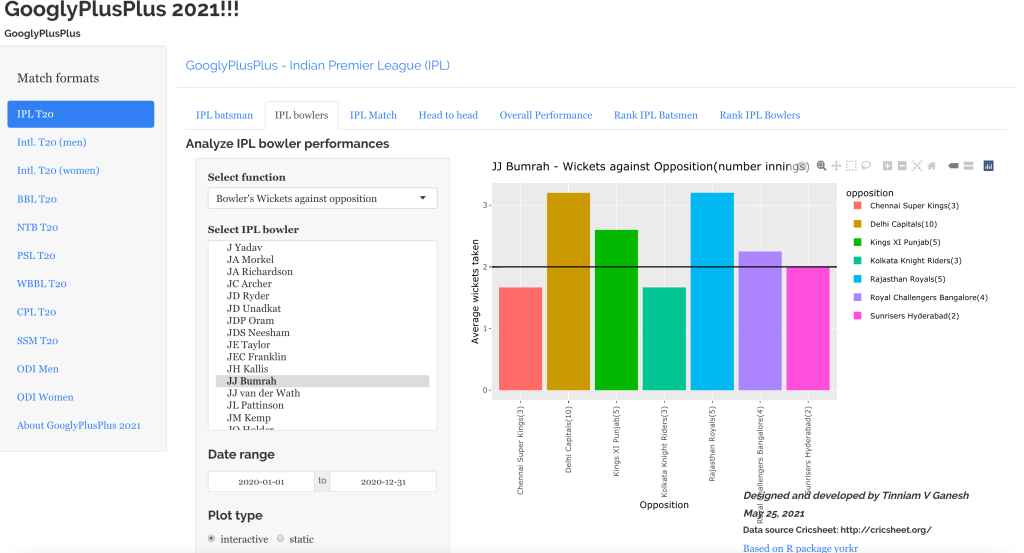
E) Bumrah’s performance in IPL

a) Bumrah’s performance in IPL 2020

b) Bumrah’s performance in IPL 2021

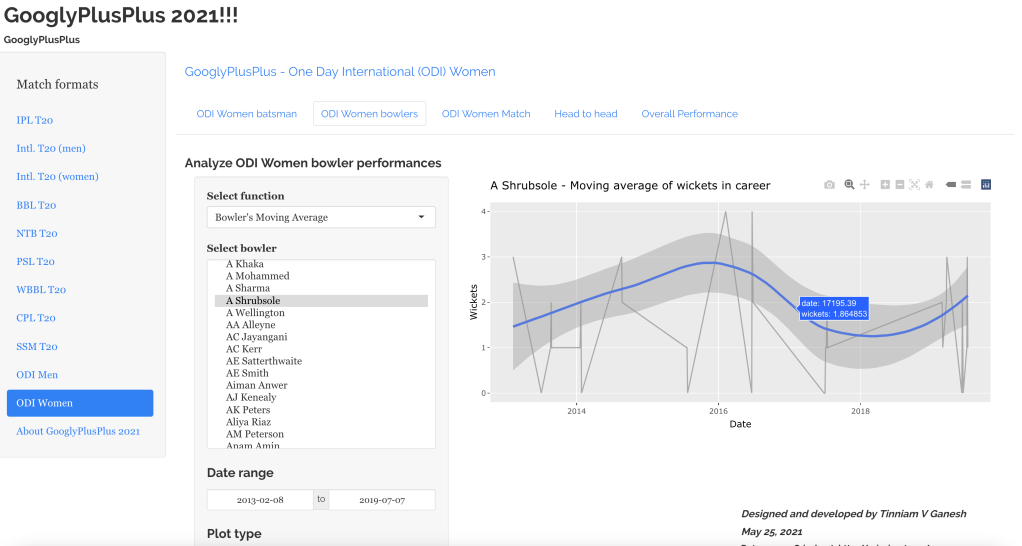
F) Moving average wickets for A. Shrubsole in ODI (women)

G) Chris Jordan’s cumulative economy rate

We can see that Jordan has become more expensive over the years

G) Ranking players

In this latest version the ‘Since year slider’ has been replaced with a Date Range selector. With this we can identify the player ranks in any IPL, CPL, PSL or BBL season. We can also check the performance over the last couple of years. Note: The matches played and Runs over Strike rate or Strike rate over runs can be computed. Similarly for bowlers we have Wickets over Economy rate and Economy rate over wickets options.

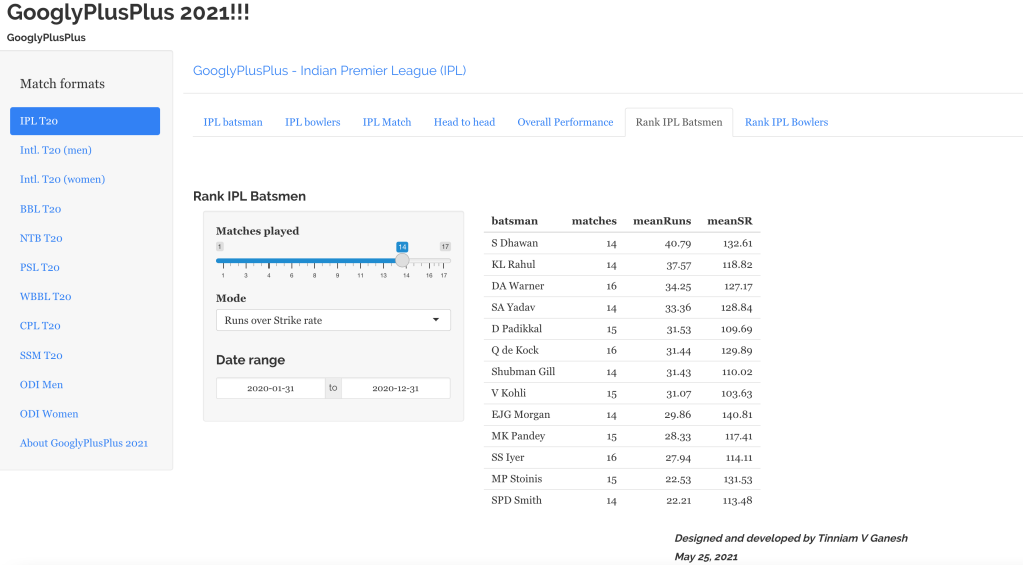
a) Ranking IPL batsman in IPL season 2020

b) Ranking Intl. T20 (batsmen) from Jan 2019 to Jul 2021

c) Ranking Intl. T20 bowlers (women) from Jan 2019 – Jul 2021

d) Best IPL bowlers over the last 3 seasons (Wickets over Economy rate)

e) Best IPL bowlers over the last 3 seasons (Economy rate over wickets)

You can clone/download this latest version of GooglyPlusPlus2021 from Github at gpp2021-7

Take GooglyPlusPlus2021 for a spin!!

Hope you have fun checking out the different tabs with the different options!!

Also see

  1. Deconstructing Convolutional Neural Networks with Tensorflow and Keras
  2. Using Reinforcement Learning to solve Gridworld
  3. Introducing QCSimulator: A 5-qubit quantum computing simulator in R
  4. De-blurring revisited with Wiener filter using OpenCV
  5. Deep Learning from first principles in Python, R and Octave – Part 5
  6. Big Data-4: Webserver log analysis with RDDs, Pyspark, SparkR and SparklyR
  7. Practical Machine Learning with R and Python – Part 4
  8. Pitching yorkpy…on the middle and outside off-stump to IPL – Part 2
  9. What would Shakespeare say?
  10. Bull in a china shop – Behind the scenes in android

To see more posts click Index of posts

GooglyPlusPlus2021: Restarting IPL 2021 as-it-happens!!!

The IPL 2021 extravaganza has restarted again, now in Dubai, and it was time for me to crank up good ol’ GooglyPlusPlus2021. As in my earlier post, GooglyPlus2021 with IPL 2021 as it happens, during the initial set of IPL 2021 games,, a command script will execute automatically every day, download the latest data files, unzip, sort, process and put them in appropriate directories so that GooglyPlusPlus can work its magic on the data, with my R package yorkr. You can do analysis of IPL 2021 matches, batsmen, bowlers, historical performance analysis of head-to-head clashes and performances of teams.

Note: Since the earlier instalment of IPL 2021, there are 2 key changes that have taken place in GooglyPlusPlus.

Now,

a) All charts are interactive. You can hover over charts, click, double-click to get more details. To see more details on how to use the interactive charts, see my post GooglyPlusPlus2021 is now fully interactive!

b) You can now analyse historical performances, compute team batting and bowling scorecards for specified periods. To know details see GooglyPlusPlus2021 adds new bells and whistles!

You can try out my app GooglyPlusPlus2021 by clicking GooglyPlusPlus2021

The code for my R package yorkr is available at Github at yorkr

You can clone/fork GooglyPlusPlus2021 from github at gpp2021-6

IPL 2021 is already underway.

Some key analysis and highlights of the 2 recently concluded IPL matches

  • CSK vs MI
  • KKR vs RCB

a) CSK vs MI (19 Sep 2021) – Batting Partnerships (CSK)

b) CSK vs MI (19 Sep 2021) – Bowling scorecard (MI)

c) CSK vs MI (19 Sep 2021) – Match worm chart

Even though MI had a much better start and were cruising along to a victory, they lost the plot around the 18.1 th over as seen below (hover on the chart)

d

d) KKR vs RCB ( 20 Sep 2021) – Bowling wicket match

This chart gives the wickets taken by the bowler and the total runs conceded

e) KKR vs RCB ( 20 Sep 2021) – Match worm chart

This was a no contest. RCB batting was pathetic and KKR blasted their way to victory as seen in this worm chart

Note: You can also do historical analysis of teams with GooglyPlusPlus2021

For the match to occur today PBKS vs RR (21 Sep 2021) we can perform head-to-head historical analysis. Here Kings XI Punjab has been chosen instead of Punjab Kings as that was its name.

f) Head-to-head (PBKS vs RR) today’s match 21 Sep 2021

For the Rajasthan Royals Sanjy Samson and Jos Buttler have the best performance from 2018 -2021 as seen below

For Punjab Kings KL Rahul and Chris Gayle are the leading scorers for the period 2018-2021

g) Current ranking of batsmen IPL 2021

h) Current ranking of bowlers IPL 2021

Also you analyse individual batsman and bowlers

i) Batsman analysis

To see Rituraj Gaikwad performance checkout the batsman tab

j) Bowler analysis

Performance of Varun Chakaravarty

Remember to check out GooglyPlusPlus2021 for your daily analysis of matches, teams, batsmen and bowlers. Your ride will be waiting for you!!!

You can clone/fork GooglyPlusPlus2021 from github at gpp2021-6

GooglyPlusPlus2021 has been updated with all completed 31 matches


Mumbai Indians-Royal Challengers Bangalore-2021-04-09Chennai Super Kings-Delhi Capitals-2021-04-10
Kolkata Knight Riders-Sunrisers Hyderabad-2021-04-11Punjab Kings-Rajasthan Royals-2021-04-12
Mumbai Indians-Kolkata Knight Riders-2021-04-13Royal Challengers Bangalore-Sunrisers Hyderabad-2021-04-14
Delhi Capitals-Rajasthan Royals-2021-04-15Punjab Kings-Chennai Super Kings-2021-04-16
Mumbai Indians-Sunrisers Hyderabad-2021-04-17Royal Challengers Bangalore-Kolkata Knight Riders-2021-04-18
Punjab Kings-Delhi Capitals-2021-04-18Chennai Super Kings-Rajasthan Royals-2021-04-19
Mumbai Indians-Delhi Capitals-2021-04-20Punjab Kings-Sunrisers Hyderabad-2021-04-21
Chennai Super Kings-Kolkata Knight Riders-2021-04-21Rajasthan Royals-Royal Challengers Bangalore-2021-04-22
Mumbai Indians-Punjab Kings-2021-04-23Kolkata Knight Riders-Rajasthan Royals-2021-04-24
Chennai Super Kings-Royal Challengers Bangalore-2021-04-25Delhi Capitals-Sunrisers Hyderabad-2021-04-25
Punjab Kings-Kolkata Knight Riders-2021-04-26Royal Challengers Bangalore-Delhi Capitals-2021-04-27
Sunrisers Hyderabad-Chennai Super Kings-2021-04-28Rajasthan Royals-Mumbai Indians-2021-04-29
Kolkata Knight Riders-Delhi Capitals-2021-04-29Punjab Kings-Royal Challengers Bangalore-2021-04-30.RData
Chennai Super Kings-Mumbai Indians-2021-05-01Rajasthan Royals-Sunrisers Hyderabad-2021-05-02
Punjab Kings-Delhi Capitals-2021-05-02Chennai Super Kings-Mumbai Indians-2021-09-19
Royal Challengers Bangalore-Kolkata Knight Riders-2021-09-20Rajasthan Royals-Punjab Kings-2021-09-21
Sunrisers Hyderabad-Delhi Capitals-2021-09-22.RDataMumbai Indians-Kolkata Knight Riders-2021-09-23.RData
Royal Challengers Bangalore-Chennai Super Kings-2021-09-24.RDataPunjab Kings-Sunrisers Hyderabad-2021-09-25
Delhi Capitals-Rajasthan Royals-2021-09-25.RDataRoyal Challengers Bangalore-Mumbai Indians-2021-09-26.RData
Kolkata Knight Riders-Chennai Super Kings-2021-09-26.RDataKolkata Knight Riders-Chennai Super Kings-2021-09-26.RData
Delhi Capitals-Kolkata Knight Riders-2021-09-28.RDataRajasthan Royals-Royal Challengers Bangalore-2021-09-29.RData
Sunrisers Hyderabad-Chennai Super Kings-2021-09-30.RDataKolkata Knight Riders-Punjab Kings-2021-10-01.RData
Chennai Super Kings-Rajasthan Royals-2021-10-02.RDataMumbai Indians-Delhi Capitals-2021-10-02.RData
Royal Challengers Bangalore-Punjab Kings-2021-10-03.RDataChennai Super Kings-Delhi Capitals-2021-10-04.RData
Rajasthan Royals-Mumbai Indians-2021-10-05.RDataSunrisers Hyderabad-Royal Challengers Bangalore-2021-10-06.RData

Also see

  1. Deep Learning from first principles in Python, R and Octave – Part 5
  2. Introducing QCSimulator: A 5-qubit quantum computing simulator in R
  3. Computer Vision: Ramblings on derivatives, histograms and contours
  4. Designing a Social Web Portal
  5. Understanding Neural Style Transfer with Tensorflow and Keras
  6. Big Data 6: The T20 Dance of Apache NiFi and yorkpy
  7. Practical Machine Learning with R and Python – Part 6
  8. Introducing cricpy:A python package to analyze performances of cricketers
  9. A closer look at “Robot Horse on a Trot” in Android
  10. Cricketr adds team analytics to its repertoire!!!

To see all posts click Index of posts

Rank IPL batsmen and bowlers post IPL 2020

Introduction

This post ranks IPL batsmen and bowlers post IPL 2020 season based on my R package yorkr. To know more about yorkr see Revisting R package yorkrAnalysis of IPL T20 matches with yorkr templates and others posts on this R package in Index of posts

library(yorkr)

1. Convert YAML files to match data

Convert all the match data as YAML file into .RData

#convertAllYaml2RDataframesT20("ipl","IPLMatches")

2. Rank the IPL Batsmen post IPL 2020

The function below ranks the IPL batsmen post IPL 2020. Note: We can specify the minimum number of matches that should have played by the batsmen for the ranking. By varying this parameter we can identify upcoming stars versus those who are more consistent.

dir="/Users/tvganesh/backup/software/cricket-package/yorkr-cricsheet/ipl2020/IPLMatches"
odir="/Users/tvganesh/backup/software/cricket-package/yorkr-cricsheet/ipl2020/IPLBattingBowlingDetails"


rankIPLBatsmen(dir=dir,odir=odir,minMatches=60)
## [1] "Chennai Super Kings"
## [1] "Delhi Capitals"
## [1] "Deccan Chargers"
## [1] "Delhi Daredevils"
## [1] "Kings XI Punjab"
## [1] "Kochi Tuskers Kerala"
## [1] "Kolkata Knight Riders"
## [1] "Mumbai Indians"
## [1] "Pune Warriors"
## [1] "Rajasthan Royals"
## [1] "Royal Challengers Bangalore"
## [1] "Sunrisers Hyderabad"
## [1] "Gujarat Lions"
## [1] "Rising Pune Supergiants"
## [1] "Chennai Super Kings-BattingDetails.RData"
## [1] "Delhi Capitals-BattingDetails.RData"
## [1] "Deccan Chargers-BattingDetails.RData"
## [1] "Delhi Daredevils-BattingDetails.RData"
## [1] "Kings XI Punjab-BattingDetails.RData"
## [1] "Kochi Tuskers Kerala-BattingDetails.RData"
## [1] "Kolkata Knight Riders-BattingDetails.RData"
## [1] "Mumbai Indians-BattingDetails.RData"
## [1] "Pune Warriors-BattingDetails.RData"
## [1] "Rajasthan Royals-BattingDetails.RData"
## [1] "Royal Challengers Bangalore-BattingDetails.RData"
## [1] "Sunrisers Hyderabad-BattingDetails.RData"
## [1] "Gujarat Lions-BattingDetails.RData"
## [1] "Rising Pune Supergiants-BattingDetails.RData"
## # A tibble: 65 x 4
##    batsman        matches meanRuns meanSR
##    <chr>            <int>    <dbl>  <dbl>
##  1 DA Warner          146     37.5   128.
##  2 CH Gayle           132     36.4   134.
##  3 SE Marsh            67     35.9   120.
##  4 KL Rahul            73     34.2   126.
##  5 RR Pant             68     31.8   133.
##  6 V Kohli            190     31.6   118.
##  7 AB de Villiers     155     30.5   136.
##  8 F du Plessis        79     30.4   118.
##  9 S Dhawan           174     30.0   115.
## 10 Q de Kock           64     29.8   119.
## # … with 55 more rows
rankIPLBatsmen(dir=dir,odir=odir,minMatches=70)
## [1] "Chennai Super Kings"
## [1] "Delhi Capitals"
## [1] "Deccan Chargers"
## [1] "Delhi Daredevils"
## [1] "Kings XI Punjab"
## [1] "Kochi Tuskers Kerala"
## [1] "Kolkata Knight Riders"
## [1] "Mumbai Indians"
## [1] "Pune Warriors"
## [1] "Rajasthan Royals"
## [1] "Royal Challengers Bangalore"
## [1] "Sunrisers Hyderabad"
## [1] "Gujarat Lions"
## [1] "Rising Pune Supergiants"
## [1] "Chennai Super Kings-BattingDetails.RData"
## [1] "Delhi Capitals-BattingDetails.RData"
## [1] "Deccan Chargers-BattingDetails.RData"
## [1] "Delhi Daredevils-BattingDetails.RData"
## [1] "Kings XI Punjab-BattingDetails.RData"
## [1] "Kochi Tuskers Kerala-BattingDetails.RData"
## [1] "Kolkata Knight Riders-BattingDetails.RData"
## [1] "Mumbai Indians-BattingDetails.RData"
## [1] "Pune Warriors-BattingDetails.RData"
## [1] "Rajasthan Royals-BattingDetails.RData"
## [1] "Royal Challengers Bangalore-BattingDetails.RData"
## [1] "Sunrisers Hyderabad-BattingDetails.RData"
## [1] "Gujarat Lions-BattingDetails.RData"
## [1] "Rising Pune Supergiants-BattingDetails.RData"
## # A tibble: 51 x 4
##    batsman        matches meanRuns meanSR
##    <chr>            <int>    <dbl>  <dbl>
##  1 DA Warner          146     37.5   128.
##  2 CH Gayle           132     36.4   134.
##  3 KL Rahul            73     34.2   126.
##  4 V Kohli            190     31.6   118.
##  5 AB de Villiers     155     30.5   136.
##  6 F du Plessis        79     30.4   118.
##  7 S Dhawan           174     30.0   115.
##  8 AM Rahane          124     29.6   105.
##  9 SS Iyer             77     29.3   111.
## 10 G Gambhir          155     29     110.
## # … with 41 more rows

3. Rank IPL bowlers post IPL 2020

The function ranks IPL bowlers post IPL 2020. We can specify the minimum number of matches that should have been played by the bowlers

dir="/Users/tvganesh/backup/software/cricket-package/yorkr-cricsheet/ipl2020/IPLMatches"
odir="/Users/tvganesh/backup/software/cricket-package/yorkr-cricsheet/ipl2020/IPLBattingBowlingDetails"
rankIPLBowlers(dir=dir,odir=odir,minMatches=60)
## [1] "Chennai Super Kings"
## [1] "Delhi Capitals"
## [1] "Deccan Chargers"
## [1] "Delhi Daredevils"
## [1] "Kings XI Punjab"
## [1] "Kochi Tuskers Kerala"
## [1] "Kolkata Knight Riders"
## [1] "Mumbai Indians"
## [1] "Pune Warriors"
## [1] "Rajasthan Royals"
## [1] "Royal Challengers Bangalore"
## [1] "Sunrisers Hyderabad"
## [1] "Gujarat Lions"
## [1] "Rising Pune Supergiants"
## [1] "Chennai Super Kings-BowlingDetails.RData"
## [1] "Delhi Capitals-BowlingDetails.RData"
## [1] "Deccan Chargers-BowlingDetails.RData"
## [1] "Delhi Daredevils-BowlingDetails.RData"
## [1] "Kings XI Punjab-BowlingDetails.RData"
## [1] "Kochi Tuskers Kerala-BowlingDetails.RData"
## [1] "Kolkata Knight Riders-BowlingDetails.RData"
## [1] "Mumbai Indians-BowlingDetails.RData"
## [1] "Pune Warriors-BowlingDetails.RData"
## [1] "Rajasthan Royals-BowlingDetails.RData"
## [1] "Royal Challengers Bangalore-BowlingDetails.RData"
## [1] "Sunrisers Hyderabad-BowlingDetails.RData"
## [1] "Gujarat Lions-BowlingDetails.RData"
## [1] "Rising Pune Supergiants-BowlingDetails.RData"
## # A tibble: 21 x 4
##    bowler          matches totalWickets meanER
##    <chr>             <int>        <dbl>  <dbl>
##  1 SL Malinga          120          184   6.99
##  2 SP Narine           117          143   6.82
##  3 Harbhajan Singh     131          134   7.11
##  4 DJ Bravo             91          125   8.20
##  5 YS Chahal            97          124   7.73
##  6 B Kumar              90          121   7.40
##  7 JJ Bumrah            91          119   7.35
##  8 R Ashwin             92           98   6.81
##  9 RA Jadeja           102           91   8.04
## 10 PP Chawla            85           87   8.02
## # … with 11 more rows
rankIPLBowlers(dir=dir,odir=odir,minMatches=50)
## [1] "Chennai Super Kings"
## [1] "Delhi Capitals"
## [1] "Deccan Chargers"
## [1] "Delhi Daredevils"
## [1] "Kings XI Punjab"
## [1] "Kochi Tuskers Kerala"
## [1] "Kolkata Knight Riders"
## [1] "Mumbai Indians"
## [1] "Pune Warriors"
## [1] "Rajasthan Royals"
## [1] "Royal Challengers Bangalore"
## [1] "Sunrisers Hyderabad"
## [1] "Gujarat Lions"
## [1] "Rising Pune Supergiants"
## [1] "Chennai Super Kings-BowlingDetails.RData"
## [1] "Delhi Capitals-BowlingDetails.RData"
## [1] "Deccan Chargers-BowlingDetails.RData"
## [1] "Delhi Daredevils-BowlingDetails.RData"
## [1] "Kings XI Punjab-BowlingDetails.RData"
## [1] "Kochi Tuskers Kerala-BowlingDetails.RData"
## [1] "Kolkata Knight Riders-BowlingDetails.RData"
## [1] "Mumbai Indians-BowlingDetails.RData"
## [1] "Pune Warriors-BowlingDetails.RData"
## [1] "Rajasthan Royals-BowlingDetails.RData"
## [1] "Royal Challengers Bangalore-BowlingDetails.RData"
## [1] "Sunrisers Hyderabad-BowlingDetails.RData"
## [1] "Gujarat Lions-BowlingDetails.RData"
## [1] "Rising Pune Supergiants-BowlingDetails.RData"
## # A tibble: 28 x 4
##    bowler          matches totalWickets meanER
##    <chr>             <int>        <dbl>  <dbl>
##  1 SL Malinga          120          184   6.99
##  2 SP Narine           117          143   6.82
##  3 Harbhajan Singh     131          134   7.11
##  4 DJ Bravo             91          125   8.20
##  5 YS Chahal            97          124   7.73
##  6 B Kumar              90          121   7.40
##  7 JJ Bumrah            91          119   7.35
##  8 R Ashwin             92           98   6.81
##  9 RA Jadeja           102           91   8.04
## 10 PP Chawla            85           87   8.02
## # … with 18 more rows
  1. Designing a Social Web Portal
  2. ntroducing QCSimulator: A 5-qubit quantum computing simulator in R
  3. Understanding Neural Style Transfer with Tensorflow and Keras
  4. Big Data-5: kNiFi-ing through cricket data with yorkpy
  5. Programming languages in layman’s language

To see all posts click Index of posts

Revitalizing R package yorkr

There is nothing so useless as doing efficiently that which should not be done at all. Peter Drucker

The most important thing in communication is to hear what isn’t being said. Peter Drucker

“Work expands to fill the time available for its completion.” Corollary: “Expenditure rises to meet income.” Parkinson’s law

Introduction

“Operation successful!!!the Programmer Surgeon in me, thought to himself. What should have been a routine surgery, turned out to be a major operation in the end, which involved several grueling hours. The surgeon looked at the large chunks of programming logic in the operation tray, which had been surgically removed, as they had outlived their utility and had partly become dysfunctional. The surgeon glanced at the new, concise code logic which had replaced the earlier somewhat convoluted logic, with a smile of satisfaction,

To, those who tuned in late, I am referring to my R package yorkr which I had created in many years ago, in early 2016. The package had worked well for quite some time on data from Cricsheet. Cricsheet went into a hiatus in late 2017-2018, and came alive back in 2019. Unfortunately, a key function in the package, started to malfunction. The diagnosis was that the format of the YAML files had changed, in newer files, which resulted in the problem. I had got mails from users mentioning that yorkr was not converting the new YAML files. This was on my to do list for a long time, and a week or two back, I decided to “bite the bullet” and fix the issue. I hoped the fix would be trivial but it was anything but. Finally, I took the hard decision of re-designing the core of the yorkr package, which involved converting YAML files to RData (dataframes). Also, since it has been a while since I did R code, having done more of Python stuff in recent times, I had to jog my memory with my earlier 2 posts Essential R and R vs Python

I spent many hours, tweaking and fixing the new logic so that it worked on the older and new files. Finally, I am happy to say that the new code is much more compact and probably less error prone.

I also had to ensure that the converted files performed exactly on all the other yorkr functions. I ran all the my yorkr functions in my yorkr posts on ODI, Intl. T20 and IPL and made sure the results were identical. (Phew!!)

The changes will be available in CRAN in yorkr_0.0.8

Do take a look at my yorkr posts. All the functions work correctly. Do use help, as I have changed a few functions. I will have my posts reflect the correct usage, but some function or other may slip the cracks.

  1. One Day Internationals ODI-Part1ODI-Part2ODI-Part3ODI-Part4
  2. International T20s – T20-Part1,T20-Part2,T20-Part3,T20-Part4
  3. Indian Premier League IPL-Part1IPL-Part2,IPL-Part3IPL-Part4

While making the changes, I also touched up some functions and made them more user friendly (added additional arguments etc). But by and large, yorkr is still yorkr and is intact.It just sports some spanking, new YAML conversion logic.

Note:

  1. The code is available in Github yorkr
  2. This RMarkdown has been published at RPubs Revitalizing yorkr
  3. I have already converted the YAML files for ODI, Intl T20 and IPL. You can access and download the converted data from Github at yorkrData2020
setwd("/Users/tvganesh/backup/software/cricket-package/yorkr-cricsheet/yorkrgit")
install.packages("yorkr_0.0.8.tar.gz",repos = NULL, type="source")
library(yorkr)

Checkout my interactive Shiny apps GooglyPlus2021 (interactive plots ) and GooglyPlusPlus2021 (analysis in specific intervals) which can be used to analyze IPL players, teams and matches.

Below I rank batsmen and bowlers in ODIs, T20 and IPL based on the data from Cricsheet.

1a. Rank ODI Batsmen

dir="/Users/tvganesh/backup/software/cricket-package/yorkr-cricsheet/yorkrData2020/odi/odiMenMatches"
odir="/Users/tvganesh/backup/software/cricket-package/yorkr-cricsheet/yorkrData2020/odi/odiBattingBowlingDetails"

rankODIBatsmen(dir=dir,odir=odir,minMatches=50)

## # A tibble: 151 x 4
##    batsman        matches meanRuns meanSR
##    <chr>            <int>    <dbl>  <dbl>
##  1 Babar Azam          52     50.2   87.2
##  2 SD Hope             51     48.7   71.0
##  3 V Kohli            207     48.4   79.4
##  4 HM Amla            159     46.6   82.4
##  5 DA Warner          114     46.1   88.0
##  6 AB de Villiers     190     45.5   94.5
##  7 JE Root            108     44.9   82.5
##  8 SR Tendulkar        96     43.9   77.1
##  9 IJL Trott           63     43.1   68.9
## 10 Q de Kock          106     42.0   82.7
## # … with 141 more rows

1b. Rank ODI Bowlers

dir="/Users/tvganesh/backup/software/cricket-package/yorkr-cricsheet/yorkrData2020/odi/odiMenMatches"
odir="/Users/tvganesh/backup/software/cricket-package/yorkr-cricsheet/yorkrData2020/odi/odiBattingBowlingDetails"

rankODIBowlers(dir=dir,odir=odir,minMatches=30)
## # A tibble: 265 x 4
##    bowler           matches totalWickets meanER
##    <chr>              <int>        <dbl>  <dbl>
##  1 SL Malinga           191          308   5.25
##  2 MG Johnson           142          238   4.73
##  3 Shakib Al Hasan      157          214   4.72
##  4 Shahid Afridi        166          213   4.69
##  5 JM Anderson          143          207   4.96
##  6 KMDN Kulasekara      161          190   4.94
##  7 SCJ Broad            115          189   5.31
##  8 DW Steyn             114          188   4.96
##  9 Mashrafe Mortaza     139          180   4.97
## 10 Saeed Ajmal          106          180   4.17
## # … with 255 more rows

2a. Rank T20 Batsmen

dir="/Users/tvganesh/backup/software/cricket-package/yorkr-cricsheet/yorkrData2020/t20/t20MenMatches"
odir="/Users/tvganesh/backup/software/cricket-package/yorkr-cricsheet/yorkrData2020/t20/t20BattingBowlingDetails"

rankT20Batsmen(dir=dir,odir=odir,minMatches=50)
## # A tibble: 43 x 4
##    batsman          matches meanRuns meanSR
##    <chr>              <int>    <dbl>  <dbl>
##  1 V Kohli               61     39.0   132.
##  2 Mohammad Shahzad      52     31.8   123.
##  3 CH Gayle              50     31.1   124.
##  4 BB McCullum           69     30.7   126.
##  5 PR Stirling           66     29.6   116.
##  6 MJ Guptill            70     29.6   125.
##  7 DA Warner             75     29.1   128.
##  8 AD Hales              50     28.1   120.
##  9 TM Dilshan            78     26.7   105.
## 10 RG Sharma             72     26.4   120.
## # … with 33 more rows

2b. Rank T20 Bowlers

dir="/Users/tvganesh/backup/software/cricket-package/yorkr-cricsheet/yorkrData2020/t20/t20MenMatches"
odir="/Users/tvganesh/backup/software/cricket-package/yorkr-cricsheet/yorkrData2020/t20/t20BattingBowlingDetails"

rankT20Bowlers(dir=dir,odir=odir,,minMatches=30)

## # A tibble: 153 x 4
##    bowler          matches totalWickets meanER
##    <chr>             <int>        <dbl>  <dbl>
##  1 SL Malinga           78          115   7.39
##  2 Shahid Afridi        89           98   6.80
##  3 Saeed Ajmal          62           92   6.30
##  4 Umar Gul             56           87   7.40
##  5 KMDN Kulasekara      56           72   7.25
##  6 TG Southee           55           69   8.68
##  7 DJ Bravo             60           69   8.41
##  8 DW Steyn             47           69   7.00
##  9 Shakib Al Hasan      57           69   6.82
## 10 SCJ Broad            55           68   7.83
## # … with 143 more rows

3a. Rank IPL Batsmen

dir="/Users/tvganesh/backup/software/cricket-package/yorkr-cricsheet/yorkrData2020/ipl/iplMatches"
odir="/Users/tvganesh/backup/software/cricket-package/yorkr-cricsheet/yorkrData2020/ipl/iplBattingBowlingDetails"


rankIPLBatsmen(dir=dir,odir=odir,,minMatches=50)
## # A tibble: 69 x 4
##    batsman        matches meanRuns meanSR
##    <chr>            <int>    <dbl>  <dbl>
##  1 DA Warner          130     37.9   128.
##  2 CH Gayle           125     36.2   134.
##  3 SE Marsh            67     35.9   120.
##  4 MEK Hussey          59     33.8   105.
##  5 KL Rahul            59     33.5   128.
##  6 V Kohli            175     31.6   119.
##  7 AM Rahane          116     30.7   108.
##  8 AB de Villiers     141     30.3   135.
##  9 F du Plessis        65     29.4   117.
## 10 S Dhawan           140     29.0   114.
## # … with 59 more rows

3a. Rank IPL Bowlers

dir="/Users/tvganesh/backup/software/cricket-package/yorkr-cricsheet/yorkrData2020/ipl/iplMatches"
odir="/Users/tvganesh/backup/software/cricket-package/yorkr-cricsheet/yorkrData2020/ipl/iplBattingBowlingDetails"

rankIPLBowlers(dir=dir,odir=odir,,minMatches=30)
## # A tibble: 143 x 4
##    bowler          matches totalWickets meanER
##    <chr>             <int>        <dbl>  <dbl>
##  1 SL Malinga          120          184   6.99
##  2 SP Narine           108          137   6.71
##  3 Harbhajan Singh     131          134   7.11
##  4 DJ Bravo             85          118   8.18
##  5 B Kumar              86          116   7.43
##  6 YS Chahal            82          102   7.85
##  7 R Ashwin             92           98   6.81
##  8 JJ Bumrah            76           91   7.47
##  9 PP Chawla            85           87   8.02
## 10 RA Jadeja            89           85   7.93
## # … with 133 more rows

##Conclusion

Go ahead and give yorkr a spin once yorkr_0.0.8 is available in CRAN. I hope you have fun. Do get back to me if you have any issues.

I’ll be back. Watch this space!!

You may also like

  1. The mechanics of Convolutional Neural Networks in Tensorflow and Keras
  2. Big Data-5: kNiFi-ing through cricket data with yorkpy
  3. Using Linear Programming (LP) for optimizing bowling change or batting lineup in T20 cricket
  4. Re-introducing cricketr! : An R package to analyze performances of cricketers
  5. Deep Learning from first principles in Python, R and Octave – Part 6
  6. A primer on Qubits, Quantum gates and Quantum Operations
  7. Practical Machine Learning with R and Python – Part 3
  8. Pitching yorkpy … short of good length to IPL – Part 1

To see all posts click Index of posts
Ranking T20 players in Intl T20, IPL, BBL and Natwest using yorkpy

There is a voice that doesn’t use words, listen.
When someone beats a rug, the blows are not against the rug, but against the dust in it.
I lost my hat while gazing at the moon, and then I lost my mind.
Rumi

Introduction

After a long hiatus, I am back to my big, bad, blogging ways! In this post I rank T20 players from several different leagues namely

  • International T20
  • Indian Premier League (IPL) T20
  • Big Bash League (BBL) T20
  • Natwest Blast (NTB) T20

I have added 8 new functions to my Python Package yorkpy, which will perform the ranking for the above 4 T20 League formats. To know more about my Python package see Pitching yorkpy . short of good length to IPL – Part 1, and the related posts on yorkpy. The code can be easily extended to other leagues which have a the same ‘yaml’ format for the matches. I also fixed some issues which started to crop up, possibly because a few things have changed in the new data.

The new functions are

  1. rankIntlT20Batting()
  2. rankIntlT20Batting()
  3. rankIPLT20Batting()
  4. rankIPLT20Batting
  5. rankBBLT20Batting()
  6. rankBBLT20Batting()
  7. rankNTBT20Batting()
  8. rankNTBT20Batting()

The yorkpy package uses data from Cricsheet

You can clone/fork the code for yorkpy at yorkpy

You can download the PDF of the post from Rank T20

yorkpy can be installed with ‘pip install yorkpy

1. International T20

The steps to do before ranking for International T20 matches are 1. Download International T20 zip file from Cricsheet Intl T20 2. Unzip the file. This will create a folder with yaml files

import yorkpy.analytics as yka
#yka.convertAllYaml2PandasDataframesT20("../t20s","../data")

This above step will convert the yaml files into CSV files. Now do the ranking as below

1a. Ranking of International T20 batsmen

import yorkpy.analytics as yka
intlT20RankBatting=yka.rankIntlT20Batting("C:\\software\\cricket-package\\yorkpyPkg\\data\\data")
intlT20RankBatting.head(15)
##                      matches  runs_mean     SR_mean
## batsman                                            
## V Kohli                   58  38.672414  125.212402
## KS Williamson             42  32.595238  122.884631
## Mohammad Shahzad          52  31.942308  118.212288
## CH Gayle                  50  31.140000  111.869984
## BB McCullum               69  29.492754  117.011666
## MM Lanning                48  28.812500   98.582663
## SJ Taylor                 44  28.659091   98.684856
## MJ Guptill                68  28.573529  117.673702
## DA Warner                 71  28.507042  121.142746
## DPMD Jayawardene          53  27.584906  107.787092
## KC Sangakkara             54  26.407407  106.039838
## JP Duminy                 68  26.294118  114.606717
## TM Dilshan                78  26.243590   97.910384
## RG Sharma                 65  25.907692  113.056548
## H Masakadza               53  25.566038   99.453880

1b. Ranking of International T20 bowlers

import yorkpy.analytics as yka
intlT20RankBowling=yka.rankIntlT20Bowling("C:\\software\\cricket-package\\yorkpyPkg\\data\\data")
intlT20RankBowling.head(15)
##                       matches  wicket_mean  econrate_mean
## bowler                                                   
## Umar Gul                   58     1.603448       7.637931
## SL Malinga                 78     1.500000       7.409188
## Saeed Ajmal                63     1.492063       6.451058
## DW Steyn                   46     1.478261       7.014855
## A Shrubsole                45     1.422222       6.294444
## M Morkel                   41     1.292683       7.680894
## KMDN Kulasekara            57     1.280702       7.476608
## TG Southee                 51     1.274510       8.759804
## SCJ Broad                  53     1.264151            inf
## Shakib Al Hasan            58     1.241379       6.836207
## R Ashwin                   44     1.204545       7.162879
## Nida Dar                   44     1.204545       6.083333
## KH Brunt                   44     1.204545       5.982955
## KD Mills                   42     1.166667       8.289683
## SR Watson                  46     1.152174       8.246377

2. Indian Premier League (IPL) T20

The steps to do before ranking for IPL T20 matches are 1. Download IPL T20 zip file from Cricsheet IPL T20 2. Unzip the file. This will create a folder with yaml files

import yorkpy.analytics as yka
#yka.convertAllYaml2PandasDataframesT20("../ipl","../ipldata")

This above step will convert the yaml files into CSV files in the /ipldata folder. Now do the ranking as below

2a. Ranking of batsmen in IPL T20

import yorkpy.analytics as yka
IPLT20RankBatting=yka.rankIPLT20Batting("C:\\software\\cricket-package\\yorkpyPkg\\data\\ipldata")
IPLT20RankBatting.head(15)
##                    matches  runs_mean     SR_mean
## batsman                                          
## DA Warner              129  37.589147  119.917864
## CH Gayle               123  36.723577  125.256818
## SE Marsh                70  36.314286  114.707578
## KL Rahul                59  33.542373  123.424971
## MEK Hussey              60  33.400000  100.439187
## V Kohli                174  32.413793  115.830849
## KS Williamson           42  31.690476  120.443172
## AB de Villiers         143  30.923077  128.967081
## JC Buttler              45  30.800000  132.561154
## AM Rahane              118  30.330508  102.240398
## SR Tendulkar            79  29.949367  101.651959
## F du Plessis            65  29.415385  112.462114
## Q de Kock               51  29.333333  110.973836
## SS Iyer                 47  29.170213  102.144222
## G Gambhir              155  28.741935  103.997558

2b. Ranking of bowlers in IPL T20

import yorkpy.analytics as yka
IPLT20RankBowling=yka.rankIPLT20Bowling("C:\\software\\cricket-package\\yorkpyPkg\\data\\ipldata")
IPLT20RankBowling.head(15)
##                      matches  wicket_mean  econrate_mean
## bowler                                                  
## SL Malinga               122     1.540984       7.173361
## Imran Tahir               43     1.465116       8.155039
## A Nehra                   88     1.375000       7.923295
## MJ McClenaghan            56     1.339286       8.638393
## Rashid Khan               46     1.304348       6.543478
## Sandeep Sharma            79     1.303797       7.860759
## MM Patel                  63     1.301587       7.530423
## DJ Bravo                 131     1.282443       8.458333
## M Morkel                  70     1.257143       7.760714
## SP Narine                109     1.256881       6.747706
## YS Chahal                 83     1.228916       8.103659
## R Vinay Kumar            104     1.221154       8.556090
## RP Singh                  82     1.219512       8.149390
## CH Morris                 52     1.211538       7.854167
## B Kumar                  117     1.205128       7.536325

3. Natwest T20

The steps to do before ranking for Natwest T20 matches are 1. Download Natwest T20 zip file from Cricsheet NTB T20 2. Unzip the file. This will create a folder with yaml files

import yorkpy.analytics as yka
#yka.convertAllYaml2PandasDataframesT20("../ntb","../ntbdata")

This above step will convert the yaml files into CSV files in the /ntbdata folder. Now do the ranking as below

3a. Ranking of NTB batsmen

import yorkpy.analytics as yka
NTBT20RankBatting=yka.rankNTBT20Batting("C:\\software\\cricket-package\\yorkpyPkg\\data\\ntbdata")
NTBT20RankBatting.head(15)
##                      matches  runs_mean     SR_mean
## batsman                                            
## Babar Azam                13  44.461538  121.268809
## T Banton                  13  42.230769  139.376274
## JJ Roy                    12  41.250000  142.182147
## DJM Short                 12  40.250000  131.182294
## AN Petersen               12  37.916667  132.522727
## IR Bell                   13  37.615385  130.104721
## M Klinger                 26  35.346154  112.682922
## EJG Morgan                16  35.062500  129.817650
## AJ Finch                  19  34.578947  137.093465
## MH Wessels                26  33.884615  116.300969
## S Steel                   11  33.545455  140.118207
## DJ Bell-Drummond          21  33.142857  108.566309
## Ashar Zaidi               11  33.000000  178.553331
## DJ Malan                  26  33.000000  120.127202
## T Kohler-Cadmore          23  32.956522  112.493019

3b. Ranking of NTB bowlers

import yorkpy.analytics as yka
NTBT20RankBowling=yka.rankNTBT20Bowling("C:\\software\\cricket-package\\yorkpyPkg\\data\\ntbdata")
NTBT20RankBowling.head(15)
##                        matches  wicket_mean  econrate_mean
## bowler                                                    
## MW Parkinson                11     2.000000       7.628788
## HF Gurney                   23     1.956522       8.831884
## GR Napier                   12     1.916667       8.694444
## R Rampaul                   19     1.736842       7.131579
## P Coughlin                  11     1.727273       8.909091
## AJ Tye                      26     1.692308       8.227564
## GC Viljoen                  12     1.666667       7.708333
## BAC Howell                  21     1.666667       6.857143
## BW Sanderson                12     1.583333       7.902778
## KJ Abbott                   14     1.571429       9.398810
## JE Taylor                   13     1.538462       9.839744
## JDS Neesham                 12     1.500000      10.812500
## MJ Potts                    12     1.500000       8.486111
## TT Bresnan                  21     1.476190       8.817460
## T van der Gugten            13     1.461538       7.211538

4. Big Bash Leagure (BBL) T20

The steps to do before ranking for BBL T20 matches are 1. Download BBL T20 zip file from Cricsheet BBL T20 2. Unzip the file. This will create a folder with yaml files

import yorkpy.analytics as yka
#yka.convertAllYaml2PandasDataframesT20("../bbl","../bbldata")

This above step will convert the yaml files into CSV files in the /bbldata folder. Now do the ranking as below

4a. Ranking of BBL batsmen

import yorkpy.analytics as yka
BBLT20RankBatting=yka.rankBBLT20Batting("C:\\software\\cricket-package\\yorkpyPkg\\data\\bbldata")
BBLT20RankBatting.head(15)
##                 matches  runs_mean     SR_mean
## batsman                                       
## DJM Short            43  40.883721  118.773047
## SE Marsh             47  39.148936  113.616053
## AJ Finch             62  36.306452  120.271231
## AT Carey             37  34.945946  120.125341
## UT Khawaja           41  31.268293  107.355655
## CA Lynn              74  31.162162  121.746578
## MS Wade              46  30.782609  120.310081
## TM Head              45  30.000000  126.769564
## MEK Hussey           23  29.173913  109.492934
## BJ Hodge             29  29.000000  124.438040
## BR Dunk              39  28.230769  106.149913
## AD Hales             31  27.161290  117.678008
## BB McCullum          34  27.058824  115.486392
## GJ Bailey            57  27.000000  121.159220
## MR Marsh             47  26.510638  114.994909

4b. Ranking of BBL bowlers

import yorkpy.analytics as yka
BBLT20RankBowling=yka.rankBBLT20Bowling("C:\\software\\cricket-package\\yorkpyPkg\\data\\bbldata")
BBLT20RankBowling.head(15)
##                    matches  wicket_mean  econrate_mean
## bowler                                                
## Yasir Arafat            15     2.000000       7.587778
## CH Morris               15     1.733333       8.572222
## TK Curran               27     1.629630       8.716049
## TT Bresnan              13     1.615385       8.775641
## JR Hazlewood            18     1.555556       7.361111
## CJ McKay                15     1.533333       8.555556
## DR Sams                 36     1.527778       8.581019
## AC McDermott            14     1.500000       9.166667
## JP Faulkner             20     1.500000       8.345833
## SP Narine               12     1.500000       7.395833
## AJ Tye                  51     1.490196       8.101307
## M Kelly                 21     1.476190       8.908730
## SA Abbott               73     1.438356       8.737443
## B Laughlin              82     1.426829       8.332317
## SW Tait                 31     1.419355       8.895161

Conclusion

You should be able to now rank players in the above formats as new data is added to Cricsheet. yorkpy can also be used for other leagues which follow the Cricsheet format.

Also see
1. Deep Learning from first principles in Python, R and Octave – Part 5
2. Using Linear Programming (LP) for optimizing bowling change or batting lineup in T20 cricket
3. Using Reinforcement Learning to solve Gridworld
4. Big Data-4: Webserver log analysis with RDDs, Pyspark, SparkR and SparklyR
5. My book ‘Practical Machine Learning in R and Python: Third edition’ on Amazon
6. Deblurring with OpenCV: Weiner filter reloaded
7. Rock N’ Roll with Bluemix, Cloudant & NodeExpress
8. Modeling a Car in Android

To see all posts click Index of posts

Analyze cricket players and cricket teams with cricpy template

Introduction

This post shows how you can analyze batsmen, bowlers see Introducing cricpy:A python package to analyze performances of cricketers and cricket teams see Cricpy adds team analytics to its arsenal! in Test, ODI and T20s using cricpy templates, with data from ESPN Cricinfo.

The cricpy package

A. Analyzing batsmen and bowlers in Test, ODI and T20s

The data for a particular player can be obtained with the getPlayerData() function. To do you will need to go to ESPN CricInfo Player and type in the name of the player for e.g Rahul Dravid, Virat Kohli, Alastair Cook etc. This will bring up a page which have the profile number for the player e.g. for Rahul Dravid this would be http://www.espncricinfo.com/india/content/player/28114.html. Hence, Dravid’s profile is 28114. This can be used to get the data for Rahul Dravid as shown below

and select the player you want Please mindful of the ESPN Cricinfo Terms of Use

My posts on Cripy were

  1. Introducing cricpy:A python package to analyze performances of cricketers
  2. Cricpy takes a swing at the ODIs
  3. Cricpy takes guard for the Twenty20s

You can clone/download this cricpy template for your own analysis of players. This can be done using RStudio or IPython notebooks

The cricpy package is now available with pip install cricpy!!!

You can download the latest PDF version of the book  at  ‘Cricket analytics with cricketr and cricpy: Analytics harmony with R and Python-6th edition

1 Importing cricpy – Python

# Install the package
# Do a pip install cricpy
# Import cricpy
import cricpy.analytics as ca 
## C:\Users\Ganesh\ANACON~1\lib\site-packages\statsmodels\compat\pandas.py:56: FutureWarning: The pandas.core.datetools module is deprecated and will be removed in a future version. Please use the pandas.tseries module instead.
##   from pandas.core import datetools

2. Invoking functions with Python package cricpy

import cricpy.analytics as ca 
#ca.batsman4s("aplayer.csv","A Player")

3. Getting help from cricpy – Python

import cricpy.analytics as ca
#help(ca.getPlayerData)

The details below will introduce the different functions that are available in cricpy.

4. Get the player data for a player using the function getPlayerData()

Important Note This needs to be done only once for a player. This function stores the player’s data in the specified CSV file (for e.g. dravid.csv as above) which can then be reused for all other functions). Once we have the data for the players many analyses can be done. This post will use the stored CSV file obtained with a prior getPlayerData for all subsequent analyses

4a. For Test players

import cricpy.analytics as ca
#player1 =ca.getPlayerData(profileNo1,dir="..",file="player1.csv",type="batting",homeOrAway=[1,2], result=[1,2,4])
#player1 =ca.getPlayerData(profileNo2,dir="..",file="player2.csv",type="batting",homeOrAway=[1,2], result=[1,2,4])

4b. For ODI players

import cricpy.analytics as ca
#player1 =ca.getPlayerDataOD(profileNo1,dir="..",file="player1.csv",type="batting")
#player1 =ca.getPlayerDataOD(profileNo2,dir="..",file="player2.csv",type="batting"")

4c For T20 players

import cricpy.analytics as ca
#player1 =ca.getPlayerDataTT(profileNo1,dir="..",file="player1.csv",type="batting")
#player1 =ca.getPlayerDataTT(profileNo2,dir="..",file="player2.csv",type="batting"")

5 A Player’s performance – Basic Analyses

The 3 plots below provide the following for Rahul Dravid

  1. Frequency percentage of runs in each run range over the whole career
  2. Mean Strike Rate for runs scored in the given range
  3. A histogram of runs frequency percentages in runs ranges

import cricpy.analytics as ca
import matplotlib.pyplot as plt


#ca.batsmanRunsFreqPerf("aplayer.csv","A Player")
#ca.batsmanMeanStrikeRate("aplayer.csv","A Player")
#ca.batsmanRunsRanges("aplayer.csv","A Player") 

6. More analyses

This gives details on the batsmen’s 4s, 6s and dismissals

import cricpy.analytics as ca

#ca.batsman4s("aplayer.csv","A Player")
#ca.batsman6s("aplayer.csv","A Player") 
#ca.batsmanDismissals("aplayer.csv","A Player")

# The below function is for ODI and T20 only
#ca.batsmanScoringRateODTT("./kohli.csv","Virat Kohli")  

7. 3D scatter plot and prediction plane

The plots below show the 3D scatter plot of Runs versus Balls Faced and Minutes at crease. A linear regression plane is then fitted between Runs and Balls Faced + Minutes at crease

import cricpy.analytics as ca
#ca.battingPerf3d("aplayer.csv","A Player")

8. Average runs at different venues

The plot below gives the average runs scored at different grounds. The plot also the number of innings at each ground as a label at x-axis.

import cricpy.analytics as ca
#ca.batsmanAvgRunsGround("aplayer.csv","A Player")

9. Average runs against different opposing teams

This plot computes the average runs scored against different countries.

import cricpy.analytics as ca

#ca.batsmanAvgRunsOpposition("aplayer.csv","A Player")

10. Highest Runs Likelihood

The plot below shows the Runs Likelihood for a batsman.

import cricpy.analytics as ca

#ca.batsmanRunsLikelihood("aplayer.csv","A Player")

11. A look at the Top 4 batsman

Choose any number of players

1.Player1 2.Player2 3.Player3 …

The following plots take a closer at their performances. The box plots show the median the 1st and 3rd quartile of the runs

12. Box Histogram Plot

This plot shows a combined boxplot of the Runs ranges and a histogram of the Runs Frequency

import cricpy.analytics as ca

#ca.batsmanPerfBoxHist("aplayer001.csv","A Player001")
#ca.batsmanPerfBoxHist("aplayer002.csv","A Player002")
#ca.batsmanPerfBoxHist("aplayer003.csv","A Player003")
#ca.batsmanPerfBoxHist("aplayer004.csv","A Player004")

13. get Player Data special

import cricpy.analytics as ca

#player1sp = ca.getPlayerDataSp(profile1,tdir=".",tfile="player1sp.csv",ttype="batting")
#player2sp = ca.getPlayerDataSp(profile2,tdir=".",tfile="player2sp.csv",ttype="batting")
#player3sp = ca.getPlayerDataSp(profile3,tdir=".",tfile="player3sp.csv",ttype="batting")
#player4sp = ca.getPlayerDataSp(profile4,tdir=".",tfile="player4sp.csv",ttype="batting")

14. Contribution to won and lost matches

Note:This can only be used for Test matches

import cricpy.analytics as ca

#ca.batsmanContributionWonLost("player1sp.csv","A Player001")
#ca.batsmanContributionWonLost("player2sp.csv","A Player002")
#ca.batsmanContributionWonLost("player3sp.csv","A Player003")
#ca.batsmanContributionWonLost("player4sp.csv","A Player004")

15. Performance at home and overseas

Note:This can only be used for Test matches This function also requires the use of getPlayerDataSp() as shown above

import cricpy.analytics as ca
#ca.batsmanPerfHomeAway("player1sp.csv","A Player001")
#ca.batsmanPerfHomeAway("player2sp.csv","A Player002")
#ca.batsmanPerfHomeAway("player3sp.csv","A Player003")
#ca.batsmanPerfHomeAway("player4sp.csv","A Player004")

16 Moving Average of runs in career

import cricpy.analytics as ca

#ca.batsmanMovingAverage("aplayer001.csv","A Player001")
#ca.batsmanMovingAverage("aplayer002.csv","A Player002")
#ca.batsmanMovingAverage("aplayer003.csv","A Player003")
#ca.batsmanMovingAverage("aplayer004.csv","A Player004")

17 Cumulative Average runs of batsman in career

This function provides the cumulative average runs of the batsman over the career.

import cricpy.analytics as ca

#ca.batsmanCumulativeAverageRuns("aplayer001.csv","A Player001")
#ca.batsmanCumulativeAverageRuns("aplayer002.csv","A Player002")
#ca.batsmanCumulativeAverageRuns("aplayer003.csv","A Player003")
#ca.batsmanCumulativeAverageRuns("aplayer004.csv","A Player004")

18 Cumulative Average strike rate of batsman in career

.

import cricpy.analytics as ca
#ca.batsmanCumulativeStrikeRate("aplayer001.csv","A Player001")
#ca.batsmanCumulativeStrikeRate("aplayer002.csv","A Player002")
#ca.batsmanCumulativeStrikeRate("aplayer003.csv","A Player003")
#ca.batsmanCumulativeStrikeRate("aplayer004.csv","A Player004")

19 Future Runs forecast

import cricpy.analytics as ca

#ca.batsmanPerfForecast("aplayer001.csv","A Player001")

20 Relative Batsman Cumulative Average Runs

The plot below compares the Relative cumulative average runs of the batsman for each of the runs ranges of 10 and plots them.

import cricpy.analytics as ca

frames = ["aplayer1.csv","aplayer2.csv","aplayer3.csv","aplayer4.csv"]
names = ["A Player1","A Player2","A Player3","A Player4"]
#ca.relativeBatsmanCumulativeAvgRuns(frames,names)

21 Plot of 4s and 6s

import cricpy.analytics as ca

frames = ["aplayer1.csv","aplayer2.csv","aplayer3.csv","aplayer4.csv"]
names = ["A Player1","A Player2","A Player3","A Player4"]
#ca.batsman4s6s(frames,names)

22. Relative Batsman Strike Rate

The plot below gives the relative Runs Frequency Percetages for each 10 run bucket. The plot below show

import cricpy.analytics as ca

frames = ["aplayer1.csv","aplayer2.csv","aplayer3.csv","aplayer4.csv"]
names = ["A Player1","A Player2","A Player3","A Player4"]
#ca.relativeBatsmanCumulativeStrikeRate(frames,names)

23. 3D plot of Runs vs Balls Faced and Minutes at Crease

The plot is a scatter plot of Runs vs Balls faced and Minutes at Crease. A prediction plane is fitted

import cricpy.analytics as ca
#ca.battingPerf3d("aplayer001.csv","A Player001")
#ca.battingPerf3d("aplayer002.csv","A Player002")
#ca.battingPerf3d("aplayer003.csv","A Player003")
#ca.battingPerf3d("aplayer004.csv","A Player004")

24. Predicting Runs given Balls Faced and Minutes at Crease

A multi-variate regression plane is fitted between Runs and Balls faced +Minutes at crease.

import cricpy.analytics as ca

import numpy as np
import pandas as pd

BF = np.linspace( 10, 400,15)
Mins = np.linspace( 30,600,15)
newDF= pd.DataFrame({'BF':BF,'Mins':Mins})

#aplayer = ca.batsmanRunsPredict("aplayer.csv",newDF,"A Player")
#print(aplayer)

The fitted model is then used to predict the runs that the batsmen will score for a given Balls faced and Minutes at crease.

25 Analysis of Top 3 wicket takers

Take any number of bowlers from either Test, ODI or T20

  1. Bowler1
  2. Bowler2
  3. Bowler3 …

26. Get the bowler’s data (Test)

This plot below computes the percentage frequency of number of wickets taken for e.g 1 wicket x%, 2 wickets y% etc and plots them as a continuous line

import cricpy.analytics as ca

#abowler1 =ca.getPlayerData(profileNo1,dir=".",file="abowler1.csv",type="bowling",homeOrAway=[1,2], result=[1,2,4])
#abowler2 =ca.getPlayerData(profileNo2,dir=".",file="abowler2.csv",type="bowling",homeOrAway=[1,2], result=[1,2,4])
#abowler3 =ca.getPlayerData(profile3,dir=".",file="abowler3.csv",type="bowling",homeOrAway=[1,2], result=[1,2,4])

26b For ODI bowlers

import cricpy.analytics as ca

#abowler1 =ca.getPlayerDataOD(profileNo1,dir=".",file="abowler1.csv",type="bowling")
#abowler2 =ca.getPlayerDataOD(profileNo2,dir=".",file="abowler2.csv",type="bowling")
#abowler3 =ca.getPlayerDataOD(profile3,dir=".",file="abowler3.csv",type="bowling")

26c For T20 bowlers

import cricpy.analytics as ca

#abowler1 =ca.getPlayerDataTT(profileNo1,dir=".",file="abowler1.csv",type="bowling")
#abowler2 =ca.getPlayerDataTT(profileNo2,dir=".",file="abowler2.csv",type="bowling")
#abowler3 =ca.getPlayerDataTT(profile3,dir=".",file="abowler3.csv",type="bowling")

27. Wicket Frequency Plot

This plot below plots the frequency of wickets taken for each of the bowlers

import cricpy.analytics as ca

#ca.bowlerWktsFreqPercent("abowler1.csv","A Bowler1")
#ca.bowlerWktsFreqPercent("abowler2.csv","A Bowler2")
#ca.bowlerWktsFreqPercent("abowler3.csv","A Bowler3")

28. Wickets Runs plot

The plot below create a box plot showing the 1st and 3rd quartile of runs conceded versus the number of wickets taken

import cricpy.analytics as ca

#ca.bowlerWktsRunsPlot("abowler1.csv","A Bowler1")
#ca.bowlerWktsRunsPlot("abowler2.csv","A Bowler2")
#ca.bowlerWktsRunsPlot("abowler3.csv","A Bowler3")

29 Average wickets at different venues

The plot gives the average wickets taken bat different venues.

import cricpy.analytics as ca

#ca.bowlerAvgWktsGround("abowler1.csv","A Bowler1")
#ca.bowlerAvgWktsGround("abowler2.csv","A Bowler2")
#ca.bowlerAvgWktsGround("abowler3.csv","A Bowler3")

30 Average wickets against different opposition

The plot gives the average wickets taken against different countries.

import cricpy.analytics as ca

#ca.bowlerAvgWktsOpposition("abowler1.csv","A Bowler1")
#ca.bowlerAvgWktsOpposition("abowler2.csv","A Bowler2")
#ca.bowlerAvgWktsOpposition("abowler3.csv","A Bowler3")

31 Wickets taken moving average

import cricpy.analytics as ca

#ca.bowlerMovingAverage("abowler1.csv","A Bowler1")
#ca.bowlerMovingAverage("abowler2.csv","A Bowler2")
#ca.bowlerMovingAverage("abowler3.csv","A Bowler3")

32 Cumulative average wickets taken

The plots below give the cumulative average wickets taken by the bowlers.

import cricpy.analytics as ca

#ca.bowlerCumulativeAvgWickets("abowler1.csv","A Bowler1")
#ca.bowlerCumulativeAvgWickets("abowler2.csv","A Bowler2")
#ca.bowlerCumulativeAvgWickets("abowler3.csv","A Bowler3")

33 Cumulative average economy rate

The plots below give the cumulative average economy rate of the bowlers.

import cricpy.analytics as ca

#ca.bowlerCumulativeAvgEconRate("abowler1.csv","A Bowler1")
#ca.bowlerCumulativeAvgEconRate("abowler2.csv","A Bowler2")
#ca.bowlerCumulativeAvgEconRate("abowler3.csv","A Bowler3")

34 Future Wickets forecast

import cricpy.analytics as ca
#ca.bowlerPerfForecast("abowler1.csv","A bowler1")

35 Get player data special

import cricpy.analytics as ca

#abowler1sp =ca.getPlayerDataSp(profile1,tdir=".",tfile="abowler1sp.csv",ttype="bowling")
#abowler2sp =ca.getPlayerDataSp(profile2,tdir=".",tfile="abowler2sp.csv",ttype="bowling")
#abowler3sp =ca.getPlayerDataSp(profile3,tdir=".",tfile="abowler3sp.csv",ttype="bowling")

36 Contribution to matches won and lost

Note:This can be done only for Test cricketers

import cricpy.analytics as ca

#ca.bowlerContributionWonLost("abowler1sp.csv","A Bowler1")
#ca.bowlerContributionWonLost("abowler2sp.csv","A Bowler2")
#ca.bowlerContributionWonLost("abowler3sp.csv","A Bowler3")

37 Performance home and overseas

Note:This can be done only for Test cricketers

import cricpy.analytics as ca

#ca.bowlerPerfHomeAway("abowler1sp.csv","A Bowler1")
#ca.bowlerPerfHomeAway("abowler2sp.csv","A Bowler2")
#ca.bowlerPerfHomeAway("abowler3sp.csv","A Bowler3")

38 Relative cumulative average economy rate of bowlers

import cricpy.analytics as ca

frames = ["abowler1.csv","abowler2.csv","abowler3.csv"]
names = ["A Bowler1","A Bowler2","A Bowler3"]
#ca.relativeBowlerCumulativeAvgEconRate(frames,names)

39 Relative Economy Rate against wickets taken

import cricpy.analytics as ca

frames = ["abowler1.csv","abowler2.csv","abowler3.csv"]
names = ["A Bowler1","A Bowler2","A Bowler3"]
#ca.relativeBowlingER(frames,names)

40 Relative cumulative average wickets of bowlers in career

import cricpy.analytics as ca
frames = ["abowler1.csv","abowler2.csv","abowler3.csv"]
names = ["A Bowler1","A Bowler2","A Bowler3"]
#ca.relativeBowlerCumulativeAvgWickets(frames,names)

B. Analyzing cricket teams in Test, ODI and T20s

The following functions will get the team data for Tests, ODI and T20s

1a. Get Test team data

import cricpy.analytics as ca
#country1Test= ca.getTeamDataHomeAway(dir=".",teamView="bat",matchType="Test",file="country1Test.csv",save=True,teamName="Country1")
#country2Test= ca.getTeamDataHomeAway(dir=".",teamView="bat",matchType="Test",file="country2Test.csv",save=True,teamName="Country2")
#country3Test= ca.getTeamDataHomeAway(dir=".",teamView="bat",matchType="Test",file="country3Test.csv",save=True,teamName="Country3")

1b. Get ODI team data

import cricpy.analytics as ca
#team1ODI=  ca.getTeamDataHomeAway(dir=".",matchType="ODI",file="team1ODI.csv",save=True,teamName="team1")
#team2ODI=  ca.getTeamDataHomeAway(dir=".",matchType="ODI",file="team2ODI.csv",save=True,teamName="team2")
#team3ODI=  ca.getTeamDataHomeAway(dir=".",matchType="ODI",file="team3ODI.csv",save=True,teamName="team3")

1c. Get T20 team data

import cricpy.analytics as ca
#team1T20 = ca.getTeamDataHomeAway(matchType="T20",file="team1T20.csv",save=True,teamName="team1")
#team2T20 = ca.getTeamDataHomeAway(matchType="T20",file="team2T20.csv",save=True,teamName="team2")
#team3T20 = ca.getTeamDataHomeAway(matchType="T20",file="team3T20.csv",save=True,teamName="team3")

2a. Test – Analyzing test performances against opposition

import cricpy.analytics as ca
# Get the performance of Indian test team against all teams at all venues as a dataframe
#df = ca.teamWinLossStatusVsOpposition("country1Test.csv",teamName="Country1",opposition=["all"],homeOrAway=["all"],matchType="Test",plot=False)
#print(df.head())
# Plot the performance of Country1 Test team  against all teams at all venues
#ca.teamWinLossStatusVsOpposition("country1Test.csv",teamName="Country1",opposition=["all"],homeOrAway=["all"],matchType="Test",plot=True)
# Plot the performance of Country1 Test team  against specific teams at home/away venues
#ca.teamWinLossStatusVsOpposition("country1Test.csv",teamName="Country1",opposition=["Country2","Country3","Country4"],homeOrAway=["home","away","neutral"],matchType="Test",plot=True)

2b. Test – Analyzing test performances against opposition at different grounds

import cricpy.analytics as ca
# Get the performance of Indian test team against all teams at all venues as a dataframe
#df = ca.teamWinLossStatusAtGrounds("country1Test.csv",teamName="Country1",opposition=["all"],homeOrAway=["all"],matchType="Test",plot=False)
#df.head()
# Plot the performance of Country1 Test team  against all teams at all venues
#ca.teamWinLossStatusAtGrounds("country1Test.csv",teamName="Country1",opposition=["all"],homeOrAway=["all"],matchType="Test",plot=True)
# Plot the performance of Country1 Test team  against specific teams at home/away venues
#ca.teamWinLossStatusAtGrounds("country1Test.csv",teamName="Country1",opposition=["Country2","Country3","Country4"],homeOrAway=["home","away","neutral"],matchType="Test",plot=True)

2c. Test – Plot time lines of wins and losses

import cricpy.analytics as ca
#ca.plotTimelineofWinsLosses("country1Test.csv",team="Country1",opposition=["all"], #startDate="1970-01-01",endDate="2017-01-01")
#ca.plotTimelineofWinsLosses("country1Test.csv",team="Country1",opposition=["Country2","Count#ry3","Country4"], homeOrAway=["home",away","neutral"], startDate=<start Date> #,endDate=<endDate>)

3a. ODI – Analyzing test performances against opposition

import cricpy.analytics as ca
#df = ca.teamWinLossStatusVsOpposition("team1ODI.csv",teamName="Team1",opposition=["all"],homeOrAway=["all"],matchType="ODI",plot=False)
#print(df.head())
# Plot the performance of team1  in ODIs against Sri Lanka, India at all venues
#ca.teamWinLossStatusVsOpposition("team1ODI.csv",teamName="Team1",opposition=["all"],homeOrAway=[all"],matchType="ODI",plot=True)
# Plot the performance of Team1 ODI team  against specific teams at home/away venues
#ca.teamWinLossStatusVsOpposition("team1ODI.csv",teamName="Team1",opposition=["Team2","Team3","Team4"],homeOrAway="home","away","neutral"],matchType="ODI",plot=True)

3b. ODI – Analyzing test performances against opposition at different venues

import cricpy.analytics as ca
#df = ca.teamWinLossStatusAtGrounds("team1ODI.csv",teamName="Team1",opposition=["all"],homeOrAway=["all"],matchType="ODI",plot=False)
#print(df.head())
# Plot the performance of Team1s in ODIs specific ODI teams at all venues
#ca.teamWinLossStatusAtGrounds("team1ODI.csv",teamName="Team1",opposition=["all"],homeOrAway=[all"],matchType="ODI",plot=True)
# Plot the performance of Team1 against specific ODI teams at home/away venues
#ca.teamWinLossStatusAtGrounds("team1ODI.csv",teamName="Team1",opposition=["Team2","Team3","Team4"],homeOrAway=["home","away","neutral"],matchType="ODI",plot=True)

3c. ODI – Plot time lines of wins and losses

import cricpy.analytics as ca
#Plot the time line of wins/losses of Bangladesh ODI team between 2 dates all venues
#ca.plotTimelineofWinsLosses("team1ODI.csv",team="Team1",startDate=<start date> ,endDa#te=<end date>,matchType="ODI")
#Plot the time line of wins/losses against specific opposition between 2 dates
#ca.plotTimelineofWinsLosses("team1ODI.csv",team="Team1",opposition=["Team2","Team2"], homeOrAway=["home",away","neutral"], startDate=<start date>,endDate=<end date> ,matchType="ODI")

4a. T20 – Analyzing test performances against opposition

import cricpy.analytics as ca
#df = ca.teamWinLossStatusVsOpposition("teamT20.csv",teamName="Team1",opposition=["all"],homeOrAway=["all"],matchType="T20",plot=False)
#print(df.head())
# Plot the performance of Team1 in T20s  against  all opposition at all venues
#ca.teamWinLossStatusVsOpposition("teamT20.csv",teamName="Team1",opposition=["all"],homeOrAway=[all"],matchType="T20",plot=True)
# Plot the performance of T20 Test team  against specific teams at home/away venues
#ca.teamWinLossStatusVsOpposition("teamT20.csv",teamName="Team1",opposition=["Team2","Team3","Team4"],homeOrAway=["home","away","neutral"],matchType="T20",plot=True)

4b. T20 – Analyzing test performances against opposition at different venues

import cricpy.analytics as ca
#df = ca.teamWinLossStatusAtGrounds("teamT20.csv",teamName="Team1",opposition=["all"],homeOrAway=["all"],matchType="T20",plot=False)
#df.head()
# Plot the performance of Team1s in ODIs specific ODI teams at all venues
#ca.teamWinLossStatusAtGrounds("teamT20.csv",teamName="Team1",opposition=["all"],homeOrAway=["all"],matchType="T20",plot=True)
# Plot the performance of Team1 against specific ODI teams at home/away venues
#ca.teamWinLossStatusAtGrounds("teamT20.csv",teamName="Team1",opposition=["Team2","Team3","Team4"],homeOrAway=["home","away","neutral"],matchType="T20",plot=True)

4c. T20 – Plot time lines of wins and losses

import cricpy.analytics as ca
#Plot the time line of wins/losses of Bangladesh ODI team between 2 dates all venues
#ca.plotTimelineofWinsLosses("teamT20.csv",team="Team1",startDate=<start date> ,endDa#te=<end date>,matchType="T20")
#Plot the time line of wins/losses against specific opposition between 2 dates
#ca.plotTimelineofWinsLosses("teamT20.csv",team="Team1",opposition=c("Team2","Team2"), homeOrAway=c("home",away","neutral"), startDate=<start date>,endDate=<end date> ,matchType="T20")

Conclusion

Key Findings

Analysis of batsman

Analysis of bowlers

Analysis of teams

Have fun with cripy!!!

Analyzing cricketers’ and cricket team’s performances with cricketr template

This post includes a template which you can use for analyzing the performances of cricketers, both batsmen and bowlers in Test, ODI and Twenty 20 cricket. Additionally this template can also be used for analyzing performances of teams in Test, ODI and T20 matches using my R package cricketr. To see actual usage of functions related to players in the R package cricketr see Introducing cricketr! : An R package to analyze performances of cricketers and associated posts on cricket in Index of posts. For the analyses on team performances see https://gigadom.in/2019/06/21/cricpy-adds-team-analytics-to-its-repertoire/

The ‘cricketr’ package uses the statistics info available in ESPN Cricinfo Statsguru. The current version of this package supports all formats of the game including Test, ODI and Twenty20 versions.

You should be able to install the package from GitHub and use the many functions available in the package. Please mindful of the ESPN Cricinfo Terms of Use

Take a look at my short video tutorial on my R package cricketr on Youtube – R package cricketr – A short tutorial

Do check out my interactive Shiny app implementation using the cricketr package – Sixer – R package cricketr’s new Shiny avatar

You can download this RMarkdown file from Github at cricketr-template

You can download the latest PDF version of the book  at  ‘Cricket analytics with cricketr and cricpy: Analytics harmony with R and Python-6th edition

The cricketr package

The cricketr package has several functions that perform several different analyses on both batsman and bowlers. The package can also analyze performances of teams The package has function that plot percentage frequency runs or wickets, runs likelihood for a batsman, relative run/strike rates of batsman and relative performance/economy rate for bowlers are available. Other interesting functions include batting performance moving average, forecast and a function to check whether the batsmans in in-form or out-of-form.

In addition performances of teams against different oppositions at different venues can be computed and plotted. The timeline of wins & losses can be plotted.

A. Performances of batsmen and bowlers

The data for a particular player can be obtained with the getPlayerData() function. To do you will need to go to ESPN CricInfo Player and type in the name of the player for e.g Ricky Ponting, Sachin Tendulkar etc. This will bring up a page which have the profile number for the player e.g. for Sachin Tendulkar this would be http://www.espncricinfo.com/india/content/player/35320.html. Hence, Sachin’s profile is 35320. This can be used to get the data for Tendulkar as shown below

The cricketr package is now available from CRAN!!! You should be able to install as below

1. Install the cricketr package

if (!require("cricketr")){
    install.packages("cricketr",lib = "c:/test")
}
library(cricketr)

The cricketr package includes some pre-packaged sample (.csv) files. You can use these sample to test functions as shown below
# Retrieve the file path of a data file installed with cricketr
#pathToFile <- system.file("data", "tendulkar.csv", package = "cricketr")
#batsman4s(pathToFile, "Sachin Tendulkar")

# The general format is pkg-function(pathToFile,par1,...)
#batsman4s(<path-To-File>,"Sachin Tendulkar")

The pre-packaged files can be accessed as shown above. To get the data of any player use the function in Test, ODI and Twenty20 use the following

2. For Test cricket

#tendulkar <- getPlayerData(35320,dir="..",file="tendulkar.csv",type="batting",homeOrAway=c(1,2), result=c(1,2,4))

2a. For ODI cricket

#tendulkarOD <- getPlayerDataOD(35320,dir="..",file="tendulkarOD.csv",type="batting")

2b For Twenty 20 cricket

#tendulkarT20 <- getPlayerDataTT(35320,dir="..",file="tendulkarT20.csv",type="batting")

Important Note 1: This needs to be done only once for a player. This function stores the player’s data in a CSV file (for e.g. tendulkar.csv as above) which can then be reused for all other functions. Once we have the data for the players many analyses can be done. This post will use the stored CSV file obtained with a prior getPlayerData for all subsequent analyses

Important Note 2: The same set of functions can be used for Tests, ODI and T20s. I have mentioned wherever you may need special functions for ODI and T20 below

Sachin Tendulkar’s performance – Basic Analyses

The 3 plots below provide the following for Tendulkar

  1. Frequency percentage of runs in each run range over the whole career
  2. Mean Strike Rate for runs scored in the given range
  3. A histogram of runs frequency percentages in runs ranges For example

3. Basic analyses

par(mfrow=c(1,3))
par(mar=c(4,4,2,2))
#batsmanRunsFreqPerf("./tendulkar.csv","Tendulkar")
#batsmanMeanStrikeRate("./tendulkar.csv","Tendulkar")
#batsmanRunsRanges("./tendulkar.csv","Tendulkar")
dev.off()
## null device 
##           1
  1. Player 1
  2. Player 2
  3. Player 3
  4. Player 4

4. More analyses

par(mfrow=c(1,3))
par(mar=c(4,4,2,2))
#batsman4s("./player1.csv","Player1")
#batsman6s("./player1.csv","Player1")
#batsmanMeanStrikeRate("./player1.csv","Player1")

# For ODI and T20
#batsmanScoringRateODTT("./player1.csv","Player1")
dev.off()
## null device 
##           1
par(mfrow=c(1,3))
par(mar=c(4,4,2,2))
#batsman4s("./player2.csv","Player2")
#batsman6s("./player2.csv","Player2")
#batsmanMeanStrikeRate("./player2.csv","Player2")
# For ODI and T20
#batsmanScoringRateODTT("./player1.csv","Player1")
dev.off()
## null device 
##           1
par(mfrow=c(1,3))
par(mar=c(4,4,2,2))
#batsman4s("./player3.csv","Player3")
#batsman6s("./player3.csv","Player3")
#batsmanMeanStrikeRate("./player3.csv","Player3")
# For ODI and T20
#batsmanScoringRateODTT("./player1.csv","Player1")

dev.off()
## null device 
##           1
par(mfrow=c(1,3))
par(mar=c(4,4,2,2))
#batsman4s("./player4.csv","Player4")
#batsman6s("./player4.csv","Player4")
#batsmanMeanStrikeRate("./player4.csv","Player4")
# For ODI and T20
#batsmanScoringRateODTT("./player1.csv","Player1")
dev.off()
## null device 
##           1

Note: For mean strike rate in ODI and Twenty20 use the function batsmanScoringRateODTT()

5.Boxplot histogram plot

This plot shows a combined boxplot of the Runs ranges and a histogram of the Runs Frequency

#batsmanPerfBoxHist("./player1.csv","Player1")
#batsmanPerfBoxHist("./player2.csv","Player2")
#batsmanPerfBoxHist("./player3.csv","Player3")
#batsmanPerfBoxHist("./player4.csv","Player4")

6. Contribution to won and lost matches

For the 2 functions below you will have to use the getPlayerDataSp() function. I have commented this as I already have these files. This function can only be used for Test matches

#player1sp <- getPlayerDataSp(xxxx,tdir=".",tfile="player1sp.csv",ttype="batting")
#player2sp <- getPlayerDataSp(xxxx,tdir=".",tfile="player2sp.csv",ttype="batting")
#player3sp <- getPlayerDataSp(xxxx,tdir=".",tfile="player3sp.csv",ttype="batting")
#player4sp <- getPlayerDataSp(xxxx,tdir=".",tfile="player4sp.csv",ttype="batting")
par(mfrow=c(2,2))
par(mar=c(4,4,2,2))
#batsmanContributionWonLost("player1sp.csv","Player1")
#batsmanContributionWonLost("player2sp.csv","Player2")
#batsmanContributionWonLost("player3sp.csv","Player3")
#batsmanContributionWonLost("player4sp.csv","Player4")
dev.off()
## null device 
##           1

7, Performance at home and overseas

This function also requires the use of getPlayerDataSp() as shown above. This can only be used for Test matches

par(mfrow=c(2,2))
par(mar=c(4,4,2,2))
#batsmanPerfHomeAway("player1sp.csv","Player1")
#batsmanPerfHomeAway("player2sp.csv","Player2")
#batsmanPerfHomeAway("player3sp.csv","Player3")
#batsmanPerfHomeAway("player4sp.csv","Player4")
dev.off()
## null device 
##           1

8. Batsman average at different venues

par(mfrow=c(2,2))
par(mar=c(4,4,2,2))
#batsmanAvgRunsGround("./player1.csv","Player1")
#batsmanAvgRunsGround("./player2.csv","Player2")
#batsmanAvgRunsGround("./player3.csv","Ponting")
#batsmanAvgRunsGround("./player4.csv","Player4")
dev.off()
## null device 
##           1

9. Batsman average against different opposition

par(mfrow=c(2,2))
par(mar=c(4,4,2,2))
#batsmanAvgRunsOpposition("./player1.csv","Player1")
#batsmanAvgRunsOpposition("./player2.csv","Player2")
#batsmanAvgRunsOpposition("./player3.csv","Ponting")
#batsmanAvgRunsOpposition("./player4.csv","Player4")
dev.off()
## null device 
##           1

10. Runs Likelihood of batsman

par(mfrow=c(2,2))
par(mar=c(4,4,2,2))
#batsmanRunsLikelihood("./player1.csv","Player1")
#batsmanRunsLikelihood("./player2.csv","Player2")
#batsmanRunsLikelihood("./player3.csv","Ponting")
#batsmanRunsLikelihood("./player4.csv","Player4")
dev.off()
## null device 
##           1

11. Moving Average of runs in career

par(mfrow=c(2,2))
par(mar=c(4,4,2,2))
#batsmanMovingAverage("./player1.csv","Player1")
#batsmanMovingAverage("./player2.csv","Player2")
#batsmanMovingAverage("./player3.csv","Ponting")
#batsmanMovingAverage("./player4.csv","Player4")
dev.off()
## null device 
##           1

12. Cumulative Average runs of batsman in career

par(mfrow=c(2,2))
par(mar=c(4,4,2,2))
#batsmanCumulativeAverageRuns("./player1.csv","Player1")
#batsmanCumulativeAverageRuns("./player2.csv","Player2")
#batsmanCumulativeAverageRuns("./player3.csv","Ponting")
#batsmanCumulativeAverageRuns("./player4.csv","Player4")
dev.off()
## null device 
##           1

13. Cumulative Average strike rate of batsman in career

par(mfrow=c(2,2))
par(mar=c(4,4,2,2))
#batsmanCumulativeStrikeRate("./player1.csv","Player1")
#batsmanCumulativeStrikeRate("./player2.csv","Player2")
#batsmanCumulativeStrikeRate("./player3.csv","Ponting")
#batsmanCumulativeStrikeRate("./player4.csv","Player4")
dev.off()
## null device 
##           1

14. Future Runs forecast

Here are plots that forecast how the batsman will perform in future. In this case 90% of the career runs trend is uses as the training set. the remaining 10% is the test set.

A Holt-Winters forecating model is used to forecast future performance based on the 90% training set. The forecated runs trend is plotted. The test set is also plotted to see how close the forecast and the actual matches

Take a look at the runs forecasted for the batsman below.

par(mfrow=c(2,2))
par(mar=c(4,4,2,2))
#batsmanPerfForecast("./player1.csv","Player1")
#batsmanPerfForecast("./player2.csv","Player2")
#batsmanPerfForecast("./player3.csv","Player3")
#batsmanPerfForecast("./player4.csv","Player4")
dev.off()
## null device 
##           1

15. Relative Mean Strike Rate plot

The plot below compares the Mean Strike Rate of the batsman for each of the runs ranges of 10 and plots them. The plot indicate the following

frames <- list("./player1.csv","./player2.csv","player3.csv","player4.csv")
names <- list("Player1","Player2","Player3","Player4")
#relativeBatsmanSR(frames,names)

16. Relative Runs Frequency plot

The plot below gives the relative Runs Frequency Percetages for each 10 run bucket. The plot below show

frames <- list("./player1.csv","./player2.csv","player3.csv","player4.csv")
names <- list("Player1","Player2","Player3","Player4")
#relativeRunsFreqPerf(frames,names)

17. Relative cumulative average runs in career

frames <- list("./player1.csv","./player2.csv","player3.csv","player4.csv")
names <- list("Player1","Player2","Player3","Player4")
#relativeBatsmanCumulativeAvgRuns(frames,names)

18. Relative cumulative average strike rate in career

frames <- list("./player1.csv","./player2.csv","player3.csv","player4.csv")
names <- list("Player1","Player2","Player3","player4")
#relativeBatsmanCumulativeStrikeRate(frames,names)

19. Check Batsman In-Form or Out-of-Form

The below computation uses Null Hypothesis testing and p-value to determine if the batsman is in-form or out-of-form. For this 90% of the career runs is chosen as the population and the mean computed. The last 10% is chosen to be the sample set and the sample Mean and the sample Standard Deviation are caculated.

The Null Hypothesis (H0) assumes that the batsman continues to stay in-form where the sample mean is within 95% confidence interval of population mean The Alternative (Ha) assumes that the batsman is out of form the sample mean is beyond the 95% confidence interval of the population mean.

A significance value of 0.05 is chosen and p-value us computed If p-value >= .05 – Batsman In-Form If p-value < 0.05 – Batsman Out-of-Form

Note Ideally the p-value should be done for a population that follows the Normal Distribution. But the runs population is usually left skewed. So some correction may be needed. I will revisit this later

This is done for the Top 4 batsman

#checkBatsmanInForm("./player1.csv","Player1")
#checkBatsmanInForm("./player2.csv","Player2")
#checkBatsmanInForm("./player3.csv","Player3")
#checkBatsmanInForm("./player4.csv","Player4")

20. 3D plot of Runs vs Balls Faced and Minutes at Crease

The plot is a scatter plot of Runs vs Balls faced and Minutes at Crease. A prediction plane is fitted

par(mfrow=c(1,2))
par(mar=c(4,4,2,2))
#battingPerf3d("./player1.csv","Player1")
#battingPerf3d("./player2.csv","Player2")
par(mfrow=c(1,2))
par(mar=c(4,4,2,2))
#battingPerf3d("./player3.csv","Player3")
#battingPerf3d("./player4.csv","player4")
dev.off()
## null device 
##           1

21. Predicting Runs given Balls Faced and Minutes at Crease

A multi-variate regression plane is fitted between Runs and Balls faced +Minutes at crease.

BF <- seq( 10, 400,length=15)
Mins <- seq(30,600,length=15)
newDF <- data.frame(BF,Mins)
#Player1 <- batsmanRunsPredict("./player1.csv","Player1",newdataframe=newDF)
#Player2 <- batsmanRunsPredict("./player2.csv","Player2",newdataframe=newDF)
#ponting <- batsmanRunsPredict("./player3.csv","Player3",newdataframe=newDF)
#sangakkara <- batsmanRunsPredict("./player4.csv","Player4",newdataframe=newDF)
#batsmen <-cbind(round(Player1$Runs),round(Player2$Runs),round(Player3$Runs),round(Player4$Runs))
#colnames(batsmen) <- c("Player1","Player2","Player3","Player4")
#newDF <- data.frame(round(newDF$BF),round(newDF$Mins))
#colnames(newDF) <- c("BallsFaced","MinsAtCrease")
#predictedRuns <- cbind(newDF,batsmen)
#predictedRuns

Analysis of bowlers

  1. Bowler1
  2. Bowler2
  3. Bowler3
  4. Bowler4

player1 <- getPlayerData(xxxx,dir=“..”,file=“player1.csv”,type=“bowling”) Note For One day you will have to use getPlayerDataOD() and for Twenty20 it is getPlayerDataTT()

21. Wicket Frequency Plot

This plot below computes the percentage frequency of number of wickets taken for e.g 1 wicket x%, 2 wickets y% etc and plots them as a continuous line

par(mfrow=c(1,3))
par(mar=c(4,4,2,2))
#bowlerWktsFreqPercent("./bowler1.csv","Bowler1")
#bowlerWktsFreqPercent("./bowler2.csv","Bowler2")
#bowlerWktsFreqPercent("./bowler3.csv","Bowler3")
dev.off()
## null device 
##           1

22. Wickets Runs plot

par(mfrow=c(1,3))
par(mar=c(4,4,2,2))
#bowlerWktsRunsPlot("./bowler1.csv","Bowler1")
#bowlerWktsRunsPlot("./bowler2.csv","Bowler2")
#bowlerWktsRunsPlot("./bowler3.csv","Bowler3")
dev.off()
## null device 
##           1

23. Average wickets at different venues

#bowlerAvgWktsGround("./bowler3.csv","Bowler3")

24. Average wickets against different opposition

#bowlerAvgWktsOpposition("./bowler3.csv","Bowler3")

25. Wickets taken moving average

par(mfrow=c(1,3))
par(mar=c(4,4,2,2))
#bowlerMovingAverage("./bowler1.csv","Bowler1")
#bowlerMovingAverage("./bowler2.csv","Bowler2")
#bowlerMovingAverage("./bowler3.csv","Bowler3")

dev.off()
## null device 
##           1

26. Cumulative Wickets taken

par(mfrow=c(1,3))
par(mar=c(4,4,2,2))
#bowlerCumulativeAvgWickets("./bowler1.csv","Bowler1")
#bowlerCumulativeAvgWickets("./bowler2.csv","Bowler2")
#bowlerCumulativeAvgWickets("./bowler3.csv","Bowler3")
dev.off()
## null device 
##           1

27. Cumulative Economy rate

par(mfrow=c(1,3))
par(mar=c(4,4,2,2))
#bowlerCumulativeAvgEconRate("./bowler1.csv","Bowler1")
#bowlerCumulativeAvgEconRate("./bowler2.csv","Bowler2")
#bowlerCumulativeAvgEconRate("./bowler3.csv","Bowler3")
dev.off()
## null device 
##           1

28. Future Wickets forecast

Here are plots that forecast how the bowler will perform in future. In this case 90% of the career wickets trend is used as the training set. the remaining 10% is the test set.

A Holt-Winters forecating model is used to forecast future performance based on the 90% training set. The forecated wickets trend is plotted. The test set is also plotted to see how close the forecast and the actual matches

par(mfrow=c(1,3))
par(mar=c(4,4,2,2))
#bowlerPerfForecast("./bowler1.csv","Bowler1")
#bowlerPerfForecast("./bowler2.csv","Bowler2")
#bowlerPerfForecast("./bowler3.csv","Bowler3")
dev.off()
## null device 
##           1

29. Contribution to matches won and lost

As discussed above the next 2 charts require the use of getPlayerDataSp(). This can only be done for Test matches

#bowler1sp <- getPlayerDataSp(xxxx,tdir=".",tfile="bowler1sp.csv",ttype="bowling")
#bowler2sp <- getPlayerDataSp(xxxx,tdir=".",tfile="bowler2sp.csv",ttype="bowling")
#bowler3sp <- getPlayerDataSp(xxxx,tdir=".",tfile="bowler3sp.csv",ttype="bowling")
par(mfrow=c(1,3))
par(mar=c(4,4,2,2))
#bowlerContributionWonLost("bowler1sp","Bowler1")
#bowlerContributionWonLost("bowler2sp","Bowler2")
#bowlerContributionWonLost("bowler3sp","Bowler3")
dev.off()
## null device 
##           1

30. Performance home and overseas.

This can only be done for Test matches

par(mfrow=c(1,3))
par(mar=c(4,4,2,2))
#bowlerPerfHomeAway("bowler1sp","Bowler1")
#bowlerPerfHomeAway("bowler2sp","Bowler2")
#bowlerPerfHomeAway("bowler3sp","Bowler3")
dev.off()
## null device 
##           1

31 Relative Wickets Frequency Percentage

frames <- list("./bowler1.csv","./bowler3.csv","bowler2.csv")
names <- list("Bowler1","Bowler3","Bowler2")
#relativeBowlingPerf(frames,names)

32 Relative Economy Rate against wickets taken

frames <- list("./bowler1.csv","./bowler3.csv","bowler2.csv")
names <- list("Bowler1","Bowler3","Bowler2")
#relativeBowlingER(frames,names)

33 Relative cumulative average wickets of bowlers in career

frames <- list("./bowler1.csv","./bowler3.csv","bowler2.csv")
names <- list("Bowler1","Bowler3","Bowler2")
#relativeBowlerCumulativeAvgWickets(frames,names)

34 Relative cumulative average economy rate of bowlers

frames <- list("./bowler1.csv","./bowler3.csv","bowler2.csv")
names <- list("Bowler1","Bowler3","Bowler2")
#relativeBowlerCumulativeAvgEconRate(frames,names)

35 Check for bowler in-form/out-of-form

The below computation uses Null Hypothesis testing and p-value to determine if the bowler is in-form or out-of-form. For this 90% of the career wickets is chosen as the population and the mean computed. The last 10% is chosen to be the sample set and the sample Mean and the sample Standard Deviation are caculated.

The Null Hypothesis (H0) assumes that the bowler continues to stay in-form where the sample mean is within 95% confidence interval of population mean The Alternative (Ha) assumes that the bowler is out of form the sample mean is beyond the 95% confidence interval of the population mean.

A significance value of 0.05 is chosen and p-value us computed If p-value >= .05 – Batsman In-Form If p-value < 0.05 – Batsman Out-of-Form

Note Ideally the p-value should be done for a population that follows the Normal Distribution. But the runs population is usually left skewed. So some correction may be needed. I will revisit this later

Note: The check for the form status of the bowlers indicate

#checkBowlerInForm("./bowler1.csv","Bowler1")
#checkBowlerInForm("./bowler2.csv","Bowler2")
#checkBowlerInForm("./bowler3.csv","Bowler3")
dev.off()
## null device 
##           1

36. Performing granular analysis of batsmen and bowlers

To perform granular analysis of batsmen and bowlers do the following 2 steps

  1. Step 1: getPlayerDataHA – This function is a wrapper around getPlayerData(), getPlayerDataOD() and getPlayerDataTT(), and adds an extra column ‘homeOrAway’ which says whether the match was played at home/away/neutral venues. A CSV file is created with this new column.
  2. Step2:getPlayerDataOppnHA – This function allows you to slice & dice the data for batsmen and bowlers against specific oppositions, at home/away/neutral venues and between certain periods. This reduced subset of data can be used to perform analyses. A CSV file is created as an output based on the parameters of opposition, home or away and the interval of time

37. GetPlayerDataHA (Batsmen, Tests)

#This saves a file playerTestHA.csv
#df=getPlayerDataHA(<profileNo>,tfile="playerTestHA.csv",type="batting", matchType="Test")

#Use the generate file to create a subset of data
#df1=getPlayerDataOppnHA(infile="playerTestHA.csv",outfile="playerTestFile1.csv",
#                         startDate=<start Date>,endDate=<end Date>)

38. GetPlayerDataHA (Bowlers, Tests)

#This saves a file playerTestHA.csv
#df=getPlayerDataHA(<profileNo>,tfile="playerTestHA.csv",type="bowling", matchType="Test")

#Use the generate file to create a subset of data
#df1=getPlayerDataOppnHA(infile="playerTestHA.csv",outfile="playerTestFile1.csv",
#                         startDate=<start Date>,endDate=<end Date>)

39. GetPlayerDataHA (Batsmen, ODI)

#This saves a file playerTestHA.csv
#df=getPlayerDataHA(<profileNo>,tfile="playerODIHA.csv",type="batting", matchType="ODI")

#Use the generate file to create a subset of data
#df1=getPlayerDataOppnHA(infile="playerODIHA.csv",outfile="playerODIFile1.csv",
#                         startDate=<start Date>,endDate=<end Date>)

40. GetPlayerDataHA (Bowlers, ODI)

#This saves a file playerTestHA.csv
#df=getPlayerDataHA(<profileNo>,tfile="playerODIHA.csv",type="bowling", matchType="ODI")

#Use the generate file to create a subset of data
#df1=getPlayerDataOppnHA(infile="playerODIHA.csv",outfile="playerODIFile1.csv",
#                         startDate=<start Date>,endDate=<end Date>)

41. GetPlayerDataHA (Batsmen, T20)

#This saves a file playerTestHA.csv
#df=getPlayerDataHA(<profileNo>,tfile="playerT20HA.csv",type="batting", matchType="T20")

#Use the generate file to create a subset of data
#df1=getPlayerDataOppnHA(infile="playerT20HA.csv",outfile="playerT20File1.csv",
#                         startDate=<start Date>,endDate=<end Date>)

42. GetPlayerDataHA (Bowlers, T20)

#This saves a file playerTestHA.csv
#df=getPlayerDataHA(<profileNo>,tfile="playerT20HA.csv",type="bowling", matchType="T20")

#Use the generate file to create a subset of data
#df1=getPlayerDataOppnHA(infile="playerT20HA.csv",outfile="playerT20File1.csv",
#                         startDate=<start Date>,endDate=<end Date>)

Important Note Once you get the subset of data for batsmen and bowlers playerTestFile1.csv, playerODIFile1.csv or playerT20File1.csv , you can use any of the cricketr functions on the subset of data for a fine-grained analysis

B. Performances of teams

The following functions will get the team data for Tests, ODI and T20s

1a. Get Test team data

#country1Test= getTeamDataHomeAway(dir=".",teamView="bat",matchType="Test",file="country1Test.csv",save=True,teamName="Country1")
#country2Test= getTeamDataHomeAway(dir=".",teamView="bat",matchType="Test",file="country2Test.csv",save=True,teamName="Country2")
#country3Test= getTeamDataHomeAway(dir=".",teamView="bat",matchType="Test",file="country3Test.csv",save=True,teamName="Country3")

1b. Get ODI team data

#team1ODI=  getTeamDataHomeAway(dir=".",matchType="ODI",file="team1ODI.csv",save=True,teamName="team1")
#team2ODI=  getTeamDataHomeAway(dir=".",matchType="ODI",file="team2ODI.csv",save=True,teamName="team2")
#team3ODI=  getTeamDataHomeAway(dir=".",matchType="ODI",file="team3ODI.csv",save=True,teamName="team3")

1c. Get T20 team data

#team1T20 = getTeamDataHomeAway(matchType="T20",file="team1T20.csv",save=True,teamName="team1")
#team2T20 = getTeamDataHomeAway(matchType="T20",file="team2T20.csv",save=True,teamName="team2")
#team3T20 = getTeamDataHomeAway(matchType="T20",file="team3T20.csv",save=True,teamName="team3")

2a. Test – Analyzing test performances against opposition

# Get the performance of Indian test team against all teams at all venues as a dataframe
#df <- teamWinLossStatusVsOpposition("country1Test.csv",teamName="Country1",opposition=c("all"),homeOrAway=c("all"),matchType="Test",plot=FALSE)
#head(df)

# Plot the performance of Country1 Test team  against all teams at all venues
#teamWinLossStatusVsOpposition("country1Test.csv",teamName="Country1",opposition=c("all"),homeOrAway=c("all"),matchType="Test",plot=TRUE)

# Plot the performance of Country1 Test team  against specific teams at home/away venues
#teamWinLossStatusVsOpposition("country1Test.csv",teamName="Country1",opposition=c("Country2","Country3","Country4"),homeOrAway=c("home","away","neutral"),matchType="Test",plot=TRUE)

2b. Test – Analyzing test performances against opposition at different grounds

# Get the performance of Indian test team against all teams at all venues as a dataframe
#df <- teamWinLossStatusAtGrounds("country1Test.csv",teamName="Country1",opposition=c("all"),homeOrAway=c("all"),matchType="Test",plot=FALSE)
#head(df)

# Plot the performance of Country1 Test team  against all teams at all venues
#teamWinLossStatusAtGrounds("country1Test.csv",teamName="Country1",opposition=c("all"),homeOrAway=c("all"),matchType="Test",plot=TRUE)

# Plot the performance of Country1 Test team  against specific teams at home/away venues
#teamWinLossStatusAtGrounds("country1Test.csv",teamName="Country1",opposition=c("Country2","Country3","Country4"),homeOrAway=c("home","away","neutral"),matchType="Test",plot=TRUE)

2c. Test – Plot time lines of wins and losses

#plotTimelineofWinsLosses("country1Test.csv",team="Country1",opposition=c("all"), #startDate="1970-01-01",endDate="2017-01-01")
#plotTimelineofWinsLosses("country1Test.csv",team="Country1",opposition=c("Country2","Count#ry3","Country4"), homeOrAway=c("home",away","neutral"), startDate=<start Date> #,endDate=<endDate>)

3a. ODI – Analyzing test performances against opposition

#df <- teamWinLossStatusVsOpposition("team1ODI.csv",teamName="Team1",opposition=c("all"),homeOrAway=c("all"),matchType="ODI",plot=FALSE)
#head(df)

# Plot the performance of team1  in ODIs against Sri Lanka, India at all venues
#teamWinLossStatusVsOpposition("team1ODI.csv",teamName="Team1",opposition=c("all"),homeOrAway=c(all"),matchType="ODI",plot=TRUE)

# Plot the performance of Team1 ODI team  against specific teams at home/away venues
#teamWinLossStatusVsOpposition("team1ODI.csv",teamName="Team1",opposition=c("Team2","Team3","Team4"),homeOrAway=c("home","away","neutral"),matchType="ODI",plot=TRUE)

3b. ODI – Analyzing test performances against opposition at different venues

#df <- teamWinLossStatusAtGrounds("team1ODI.csv",teamName="Team1",opposition=c("all"),homeOrAway=c("all"),matchType="ODI",plot=FALSE)
#head(df)

# Plot the performance of Team1s in ODIs specific ODI teams at all venues
#teamWinLossStatusAtGrounds("team1ODI.csv",teamName="Team1",opposition=c("all"),homeOrAway=c(all"),matchType="ODI",plot=TRUE)

# Plot the performance of Team1 against specific ODI teams at home/away venues
#teamWinLossStatusAtGrounds("team1ODI.csv",teamName="Team1",opposition=c("Team2","Team3","Team4"),homeOrAway=c("home","away","neutral"),matchType="ODI",plot=TRUE)

3c. ODI – Plot time lines of wins and losses

#Plot the time line of wins/losses of Bangladesh ODI team between 2 dates all venues
#plotTimelineofWinsLosses("team1ODI.csv",team="Team1",startDate=<start date> ,endDa#te=<end date>,matchType="ODI")

#Plot the time line of wins/losses against specific opposition between 2 dates
#plotTimelineofWinsLosses("team1ODI.csv",team="Team1",opposition=c("Team2","Team2"), homeOrAway=c("home",away","neutral"), startDate=<start date>,endDate=<end date> ,matchType="ODI")

4a. T20 – Analyzing test performances against opposition

#df <- teamWinLossStatusVsOpposition("teamT20.csv",teamName="Team1",opposition=c("all"),homeOrAway=c("all"),matchType="T20",plot=FALSE)
#head(df)

# Plot the performance of Team1 in T20s  against  all opposition at all venues
#teamWinLossStatusVsOpposition("teamT20.csv",teamName="Team1",opposition=c("all"),homeOrAway=c(all"),matchType="T20",plot=TRUE)

# Plot the performance of T20 Test team  against specific teams at home/away venues
#teamWinLossStatusVsOpposition("teamT20.csv",teamName="Team1",opposition=c("Team2","Team3","Team4"),homeOrAway=c("home","away","neutral"),matchType="T20",plot=TRUE)

4b. T20 – Analyzing test performances against opposition at different venues

#df <- teamWinLossStatusAtGrounds("teamT20.csv",teamName="Team1",opposition=c("all"),homeOrAway=c("all"),matchType="T20",plot=FALSE)
#head(df)

# Plot the performance of Team1s in ODIs specific ODI teams at all venues
#teamWinLossStatusAtGrounds("teamT20.csv",teamName="Team1",opposition=c("all"),homeOrAway=c(all"),matchType="T20",plot=TRUE)

# Plot the performance of Team1 against specific ODI teams at home/away venues
#teamWinLossStatusAtGrounds("teamT20.csv",teamName="Team1",opposition=c("Team2","Team3","Team4"),homeOrAway=c("home","away","neutral"),matchType="T20",plot=TRUE)

4c. T20 – Plot time lines of wins and losses

#Plot the time line of wins/losses of Bangladesh ODI team between 2 dates all venues
#plotTimelineofWinsLosses("teamT20.csv",team="Team1",startDate=<start date> ,endDa#te=<end date>,matchType="T20")

#Plot the time line of wins/losses against specific opposition between 2 dates
#plotTimelineofWinsLosses("teamT20.csv",team="Team1",opposition=c("Team2","Team2"), homeOrAway=c("home",away","neutral"), startDate=<start date>,endDate=<end date> ,matchType="T20")

Key Findings

Analysis of batsman

Analysis of bowlers

Analysis of teams

Conclusion

Using the above template, analysis can be done for both batsmen and bowlers in Test, ODI and T20. Also analysis of any any team in Test, ODI and T20 against other specific opposition, at home/away and neutral venues can be performed.

Have fun with cricketr!!

Also see
1. Practical Machine Learning with R and Python – Part 5
2. Using Linear Programming (LP) for optimizing bowling change or batting lineup in T20 cricket
3. yorkr crashes the IPL party ! – Part 1
4. Deep Learning from first principles in Python, R and Octave – Part 6
5. Cricpy takes a swing at the ODIs
6. Bull in a china shop – Behind the scenes in Android
7. Eliminating the Performance Drag
To see all posts click Index of posts

Cricketr adds team analytics to its repertoire!!!

And she’s got brains enough for two, which is the exact quantity the girl who marries you will need.

“I’m not absolutely certain of the facts, but I rather fancy it’s Shakespeare who says that it’s always just when a fellow is feeling particularly braced with things in general that Fate sneaks up behind him with the bit of lead piping.”

“A melancholy-looking man, he had the appearance of one who has searched for the leak in life’s gas-pipe with a lighted candle.”

“It isn’t often that Aunt Dahlia lets her angry passions rise, but when she does, strong men climb trees and pull them up after them.”

“Some minds are like soup in a poor restaurant – better left unstirred.”

                                      P.G. Wodehouse

Introduction

My R package cricketr had its genesis about 4 years ago, sometime around June 2015. There were some minor updates afterwards and the package performed analytics on cricketers (Test, ODI and T20) based on data from ESPN Cricinfo see Re-introducing cricketr! : An R package to analyze performances of cricketers. Now, in the latest release of cricketr, I have included 8 functions which can perform Team analytics. Team analysis can be done for Test, ODI and T20 teams.

This package uses the statistics info available in ESPN Cricinfo Statsguru. The current version of this package can handle all formats of the game including Test, ODI and Twenty20 cricket for players (batsmen & bowlers) and also teams (Test, ODI and T20)

You should be able to install the package directly from CRAN. Please be mindful of ESPN Cricinfo Terms of Use

A total of 8 new functions which deal with team analytics has been included in the latest release.

There are 5 functions which are used internally 1) getTeamData b) getTeamNumber c) getMatchType d) getTeamDataHomeAway e) cleanTeamData

and the external functions which are
a) teamWinLossStatusVsOpposition
b) teamWinLossStatusAtGrounds
c) plotTimelineofWinsLosses

All the above functions are common to Test, ODI and T20 teams

The data for a particular Team can be obtained with the getTeamDataHomeAway() function from the package. This will return a dataframe of the team’s win/loss status at home and away venues over a period of time. This can be saved as a CSV file. Once this is done, you can use this CSV file for all subsequent analysis

As before you can get the help for any of the cricketr functions as below

#help(teamWinLossStatusVsOpposition)
Compute the wins/losses/draw/tied etc for a Team in Test, ODI or T20 against opposition
Description
This function computes the won,lost,draw,tied or no result for a team against other teams in home/away or neutral venues and either returns a dataframe or plots it against opposition
Usage
teamWinLossStatusVsOpposition(file,teamName,opposition=c("all"),homeOrAway=c("all"),
      matchType="Test",plot=FALSE)
Arguments
file	
The CSV file for which the plot is required
teamName	
The name of the team for which plot is required
opposition	
Opposition is a vector namely c("all") or c("Australia", "India", "England")
homeOrAway	
This parameter is a vector which is either c("all") or a vector of venues c("home","away","neutral")
matchType	
Match type - Test, ODI or T20
plot	
If plot=FALSE then a data frame is returned, If plot=TRUE then a plot is generated
Value
None
Note
Maintainer: Tinniam V Ganesh tvganesh.85@gmail.com
Author(s)
Tinniam V Ganesh
References

http://www.espncricinfo.com/ci/content/stats/index.html
https://gigadom.in/
See Also
teamWinLossStatusVsOpposition teamWinLossStatusAtGrounds plotTimelineofWinsLosses
Examples
## Not run: 
#Get the team data for India for Tests
df <- getTeamDataHomeAway(teamName="India",file="indiaOD.csv",matchType="ODI")
teamWinLossStatusAtGrounds("india.csv",teamName="India",opposition=c("Australia","England","India"),
                          homeOrAway=c("home","away"),plot=TRUE)
## End(Not run)

This post has been published at RPubs and is available at TeamAnalyticsWithCricketr

You can download PDF version of this post at TeamAnalyticsWithCricketr

You can download the latest PDF version of the book  at  ‘Cricket analytics with cricketr and cricpy: Analytics harmony with R and Python-6th edition

1. Get team data

1a. Test

The teams in Test cricket are included below

  1. Afghanistan 2.Bangladesh 3. England 4. World 5. India 6. Ireland 7. New Zealand 8. Pakistan 9. South Africa 10.Sri Lanka 11. West Indies 12.Zimbabwe

You can use this for the teamName paramater. This will return a dataframe and also save the file as a CSV , if save=TRUE

Note: – Since I have already got the data as CSV files I am not executing the lines below

# Get the data for the teams. Save as CSV
#indiaTest <-getTeamDataHomeAway(dir=".",teamView="bat",matchType="Test",file="indiaTest.csv",save=TRUE,teamName="India")
#australiaTest <- getTeamDataHomeAway(matchType="Test",file="australiaTest.csv",save=TRUE,teamName="Australia")
#pakistanTest <- getTeamDataHomeAway(matchType="Test",file="pakistanTest.csv",save=TRUE,teamName="Pakistan")
#newzealandTest <- getTeamDataHomeAway(matchType="Test",file="newzealandTest.csv",save=TRUE,teamName="New Zealand")

1b. ODI

The ODI teams in the world are below. The data for these teams can be got by names as shown below

  1. Afghanistan 2. Africa XI 3. Asia XI 4.Australia 5.Bangladesh
  2. Bermuda 7. England 8. ICC World X1 9. India 11.Ireland 12. New Zealand
  3. Pakistan 14. South Africa 15. Sri Lanka 17. West Indies 18. Zimbabwe
  4. Canada 21. East Africa 22. Hong Kong 23.Ireland 24. Kenya 25. Namibia
  5. Nepal 27.Netherlands 28. Oman 29.Papua New Guinea 30. Scotland
  6. United Arab Emirates 32. United States of America
#indiaODI <- getTeamDataHomeAway(matchType="ODI",file="indiaODI.csv",save=TRUE,teamName="India")
#englandODI <- getTeamDataHomeAway(matchType="ODI",file="englandODI.csv",save=TRUE,teamName="England")
#westindiesODI <- getTeamDataHomeAway(matchType="ODI",file="westindiesODI.csv",save=TRUE,teamName="West Indies")
#irelandODI <- getTeamDataHomeAway(matchType="ODI",file="irelandODI.csv",save=TRUE,teamName="Ireland")

1c T20

The T20 teams in the world are
1.Afghanistan 2. Australia 3. Bahrain 4. Bangladesh 5. Belgium 6. Belize
2.Bermuda 8.Botswana 9. Canada 11. Costa Rica 12. Germany 13. Ghana
14.Guernsey 15. Hong Kong 16. ICC World X1 17.India 18. Ireland 19.Italy
20.Jersey 21. Kenya 22.Kuwait 23.Maldives 24.Malta 25.Mexico 26.Namibia
27.Nepal 28.Netherlands 29. New Zealand 30.Nigeria 31.Oman 32. Pakistan
33.Panama 34.Papua New Guinea 35. Philippines 36.Qatar 37.Saudi Arabia
38.Scotland 39.South Africa 40.Spain 41.Sri Lanka 42.Uganda
43.United Arab Emirates United States of America 44.Vanuatu 45.West Indies

#southafricaT20 <- getTeamDataHomeAway(matchType="T20",file="southafricaT20.csv",save=TRUE,teamName="South Africa")
#srilankaT20 <- getTeamDataHomeAway(matchType="T20",file="srilankaT20.csv",save=TRUE,teamName="Sri Lanka")
#canadaT20 <- getTeamDataHomeAway(matchType="T20",file="canadaT20.csv",save=TRUE,teamName="Canada")
#afghanistanT20 <- getTeamDataHomeAway(matchType="T20",file="afghanistanT20.csv",save=TRUE,teamName="Afghanistan")

2 Analysis of Test matches

The functions below perform analysis of Test teams

2a. Wins vs Loss against opposition

This function performs analysis of Test teams against other teams at home/away or neutral venue. Note:- The opposition can be a vector of opposition teams. Similarly homeOrAway can also be a vector of home/away/neutral venues.

# Get the performance of Indian test team against all teams at all venues as a dataframe
df <- teamWinLossStatusVsOpposition("india.csv",teamName="India",opposition=c("all"),homeOrAway=c("all"),matchType="Test",plot=FALSE)
head(df)
## # A tibble: 6 x 4
## # Groups:   Opposition, Result [4]
##   Opposition  Result ha    count
##   <chr>       <chr>  <chr> <int>
## 1 Afghanistan won    home      1
## 2 Australia   draw   away     20
## 3 Australia   draw   home     23
## 4 Australia   lost   away     58
## 5 Australia   lost   home     26
## 6 Australia   tied   home      2
# Plot the performance of Indian Test team  against all teams at all venues
teamWinLossStatusVsOpposition("indiaTest.csv",teamName="India",opposition=c("all"),homeOrAway=c("all"),matchType="Test",plot=TRUE)

# Get the performance of Australia against India, England and New Zealand at all venues in Tests
df <-teamWinLossStatusVsOpposition("australiaTest.csv",teamName="Australia",opposition=c("India","England","New Zealand"),homeOrAway=c("all"),matchType="Test",plot=FALSE)

#Plot the performance of Australia against England, India and New Zealand only at home (Australia) 
teamWinLossStatusVsOpposition("australiaTest.csv",teamName="Australia",opposition=c("India","England","New Zealand"),homeOrAway=c("home"),matchType="Test",plot=TRUE)

If you are passionate about cricket, and love analyzing cricket performances, then check out my racy book on cricket ‘Cricket analytics with cricketr and cricpy – Analytics harmony with R & Python’! This book discusses and shows how to use my R package ‘cricketr’ and my Python package ‘cricpy’ to analyze batsmen and bowlers in all formats of the game (Test, ODI and T20). The paperback is available on Amazon at $21.99 and  the kindle version at $9.99/Rs 449/-. A must read for any cricket lover! Check it out!!

Untitled

2b Wins vs losses of Test teams against opposition at different venues

# Get the  performance of Pakistan against India, West Indies, South Africa at all venues in Tests and show performances at the venues
df <- teamWinLossStatusAtGrounds("pakistanTest.csv",teamName="Pakistan",opposition=c("India","West Indies","South Africa"),homeOrAway=c("all"),matchType="Test",plot=FALSE)
head(df)
## # A tibble: 6 x 4
## # Groups:   Ground, Result [6]
##   Ground     Result ha      count
##   <chr>      <chr>  <chr>   <int>
## 1 Abu Dhabi  draw   neutral     2
## 2 Abu Dhabi  won    neutral     4
## 3 Ahmedabad  draw   away        2
## 4 Bahawalpur draw   home        1
## 5 Basseterre won    away        2
## 6 Bengaluru  draw   away        5
# Plot the performance of New Zealand Test team against England, Sri Lanka and Bangladesh at all grounds playes 
teamWinLossStatusAtGrounds("newzealandTest.csv",teamName="New Zealand",opposition=c("England","Sri Lanka","Bangladesh"),homeOrAway=c("all"),matchType="Test",plot=TRUE)

2c. Plot the time line of wins vs losses of Test teams against opposition at different venues during an interval

# Plot the time line of wins/losses of India against Australia, West Indies, South Africa in away/neutral venues
#from 2000-01-01 to 2017-01-01
plotTimelineofWinsLosses("indiaTest.csv",team="India",opposition=c("Australia","West Indies","South Africa"),
                         homeOrAway=c("away","neutral"), startDate="2000-01-01",endDate="2017-01-01")

#Plot the time line of wins/losses of Indian Test team from 1970 onwards
plotTimelineofWinsLosses("indiaTest.csv",team="India",startDate="1970-01-01",endDate="2017-01-01")

3 ODI

The functions below perform analysis of ODI teams listed above

3a. Wins vs Loss against opposition ODI teams

This function performs analysis of ODI teams against other teams at home/away or neutral venue. Note:- The opposition can be a vector of opposition teams. Similarly homeOrAway can also be a vector of home/away/neutral venues.

# Get the performance of West Indies in ODIs against all other ODI teams at all venues and retirn as a dataframe
df <- teamWinLossStatusVsOpposition("westindiesODI.csv",teamName="West Indies",opposition=c("all"),homeOrAway=c("all"),matchType="ODI",plot=FALSE)
head(df)
## # A tibble: 6 x 4
## # Groups:   Opposition, Result [3]
##   Opposition  Result ha      count
##   <chr>       <chr>  <chr>   <int>
## 1 Afghanistan lost   home        1
## 2 Afghanistan lost   neutral     2
## 3 Afghanistan won    home        1
## 4 Australia   lost   away       41
## 5 Australia   lost   home       25
## 6 Australia   lost   neutral     8
# Plot the performance of West Indies in ODIs against Sri Lanka, India at all venues
teamWinLossStatusVsOpposition("westindiesODI.csv",teamName="West Indies",opposition=c("Sri Lanka", "India"),homeOrAway=c("all"),matchType="ODI",plot=TRUE)

#Plot the performance of Ireland in ODIs against Zimbabwe, Kenya, bermuda, UAE, Oman and Scotland at all venues
teamWinLossStatusVsOpposition("irelandODI.csv",teamName="Ireland",opposition=c("Zimbabwe","Kenya","Bermuda","U.A.E.","Oman","Scotland"),homeOrAway=c("all"),matchType="ODI",plot=TRUE)

3b Wins vs losses of ODI teams against opposition at different venues

# Plot the performance of England ODI team against Bangladesh, West Indies and Australia at all venues
teamWinLossStatusAtGrounds("englandODI.csv",teamName="England",opposition=c("Bangladesh","West Indies","Australia"),homeOrAway=c("all"),matchType="ODI",plot=TRUE)

#Plot the performance of India against South Africa, West Indies and Australia at 'home' venues
teamWinLossStatusAtGrounds("indiaODI.csv",teamName="India",opposition=c("South Africa","West Indies","Australia"),homeOrAway=c("home"),matchType="ODI",plot=TRUE)

3c. Plot the time line of wins vs losses of ODI teams against opposition at different venues during an interval

#Plot the time line of wins/losses of Bangladesh ODI team between 2015 and 2019 against all other teams and at
# all venues
plotTimelineofWinsLosses("bangladeshOD.csv",team="Bangladesh",startDate="2015-01-01",endDate="2019-01-01",matchType="ODI")

#Plot the time line of wins/losses of India ODI against Sri Lanka, Bangladesh from 2016 to 2019
plotTimelineofWinsLosses("indiaODI.csv",team="India",opposition=c("Sri Lanka","Bangladesh"),startDate="2016-01-01",endDate="2019-01-01",matchType="ODI")

4 Twenty 20

The functions below perform analysis of Twenty 20 teams listed above

4a. Wins vs Loss against opposition ODI teams

This function performs analysis of T20 teams against other T20 teams at home/away or neutral venue. Note:- The opposition can be a vector of opposition teams. Similarly homeOrAway can also be a vector of home/away/neutral venues.

# Get the performance of South Africa T20 team against England, India and Sri Lanka at home grounds at England
df <- teamWinLossStatusVsOpposition("southafricaT20.csv",teamName="South Africa",opposition=c("England","India","Sri Lanka"),homeOrAway=c("home"),matchType="T20",plot=FALSE)

#Plot the performance of South Africa T20 against England, India and Sri Lanka at all venues
teamWinLossStatusVsOpposition("southafricaT20.csv",teamName="South Africa",opposition=c("England","India","Sri Lanka"),homeOrAway=c("all"),matchType="T20",plot=TRUE)

#Plot the performance of Afghanistan T20 teams against all oppositions
teamWinLossStatusVsOpposition("afghanistanT20.csv",teamName="Afghanistan",opposition=c("all"),homeOrAway=c("all"),matchType="T20",plot=TRUE)

4b Wins vs losses of T20 teams against opposition at different venues

# Compute the performance of Canada against all opposition at all venues and show by grounds. Return as dataframe
df <-teamWinLossStatusAtGrounds("canadaT20.csv",teamName="Canada",opposition=c("all"),homeOrAway=c("all"),matchType="T20",plot=FALSE)
head(df)
## # A tibble: 6 x 4
## # Groups:   Ground, Result [6]
##   Ground        Result ha      count
##   <chr>         <chr>  <chr>   <int>
## 1 Abu Dhabi     lost   neutral     1
## 2 Belfast       lost   neutral     1
## 3 Belfast       won    neutral     2
## 4 Colombo (SSC) lost   neutral     1
## 5 Colombo (SSC) won    neutral     1
## 6 Dubai (DSC)   lost   neutral     5
# Plot the performance of Sri Lanka T20 team against India and Bangladesh in different venues at home/away and neutral
teamWinLossStatusAtGrounds("srilankaT20.csv",teamName="Sri Lanka",opposition=c("India", "Bangladesh"), homeOrAway=c("all"), matchType="T20", plot=TRUE)

4c. Plot the time line of wins vs losses of T20 teams against opposition at different venues during an interval

#Plot the time line of Sri Lanka T20 team agaibst all opposition
plotTimelineofWinsLosses("srilankaT20.csv",team="Sri Lanka",opposition=c("Australia", "Pakistan"), startDate="2013-01-01", endDate="2019-01-01",  matchType="T20")

# Plot the time line of South Africa T20 between 2010 and 2015 against West Indies and Pakistan
plotTimelineofWinsLosses("southafricaT20.csv",team="South Africa",opposition=c("West Indies", "Pakistan"), startDate="2010-01-01", endDate="2015-01-01",  matchType="T20")

Analyzing batsmen and bowlers with cricpy template

Introduction

This post shows how you can analyze batsmen and bowlers of Test, ODI and T20s using cricpy templates, using data from ESPN Cricinfo.

The cricpy package

The data for a particular player can be obtained with the getPlayerData() function. To do you will need to go to ESPN CricInfo Player and type in the name of the player for e.g Rahul Dravid, Virat Kohli  etc. This will bring up a page which have the profile number for the player e.g. for Rahul Dravid this would be http://www.espncricinfo.com/india/content/player/28114.html. Hence, Dravid’s profile is 28114. This can be used to get the data for Rahul Dravid as shown below

1. For Test players use batting and bowling.
2. For ODI use batting and bowling
3. For T20 use T20 Batting T20 Bowling

Please mindful of the  ESPN Cricinfo Terms of Use

My posts on Cripy were
a. Introducing cricpy:A python package to analyze performances of cricketers
b. Cricpy takes a swing at the ODIs
c. Cricpy takes guard for the Twenty20s

You can clone/download this cricpy template for your own analysis of players. This can be done using RStudio or IPython notebooks from Github at cricpy-template. You can uncomment the functions and use them.

Cricpy can now analyze performances of teams in Test, ODI and T20 cricket see Cricpy adds team analytics to its arsenal!!

This post is also hosted on Rpubs at Int

The cricpy package is now available with pip install cricpy!!!

If you are passionate about cricket, and love analyzing cricket performances, then check out my racy book on cricket ‘Cricket analytics with cricketr and cricpy – Analytics harmony with R & Python’! This book discusses and shows how to use my R package ‘cricketr’ and my Python package ‘cricpy’ to analyze batsmen and bowlers in all formats of the game (Test, ODI and T20). The paperback is available on Amazon at $21.99 and  the kindle version at $9.99/Rs 449/-. A must read for any cricket lover! Check it out!!

You can download the latest PDF version of the book  at  ‘Cricket analytics with cricketr and cricpy: Analytics harmony with R and Python-6th edition

Untitled

1 Importing cricpy – Python

# Install the package
# Do a pip install cricpy
# Import cricpy
import cricpy.analytics as ca 
## C:\Users\Ganesh\ANACON~1\lib\site-packages\statsmodels\compat\pandas.py:56: FutureWarning: The pandas.core.datetools module is deprecated and will be removed in a future version. Please use the pandas.tseries module instead.
##   from pandas.core import datetools

2. Invoking functions with Python package cricpy

import cricpy.analytics as ca 
#ca.batsman4s("aplayer.csv","A Player")

3. Getting help from cricpy – Python

import cricpy.analytics as ca
#help(ca.getPlayerData)

The details below will introduce the different functions that are available in cricpy.

4. Get the player data for a player using the function getPlayerData()

Important Note This needs to be done only once for a player. This function stores the player’s data in the specified CSV file (for e.g. dravid.csv as above) which can then be reused for all other functions). Once we have the data for the players many analyses can be done. This post will use the stored CSV file obtained with a prior getPlayerData for all subsequent analyses

4a. For Test players

import cricpy.analytics as ca
#player1 =ca.getPlayerData(profileNo1,dir="..",file="player1.csv",type="batting",homeOrAway=[1,2], result=[1,2,4])
#player1 =ca.getPlayerData(profileNo2,dir="..",file="player2.csv",type="batting",homeOrAway=[1,2], result=[1,2,4])

4b. For ODI players

import cricpy.analytics as ca
#player1 =ca.getPlayerDataOD(profileNo1,dir="..",file="player1.csv",type="batting")
#player1 =ca.getPlayerDataOD(profileNo2,dir="..",file="player2.csv",type="batting"")

4c For T20 players

import cricpy.analytics as ca
#player1 =ca.getPlayerDataTT(profileNo1,dir="..",file="player1.csv",type="batting")
#player1 =ca.getPlayerDataTT(profileNo2,dir="..",file="player2.csv",type="batting"")

5 A Player’s performance – Basic Analyses

The 3 plots below provide the following for Rahul Dravid

  1. Frequency percentage of runs in each run range over the whole career
  2. Mean Strike Rate for runs scored in the given range
  3. A histogram of runs frequency percentages in runs ranges
import cricpy.analytics as ca
import matplotlib.pyplot as plt
#ca.batsmanRunsFreqPerf("aplayer.csv","A Player")
#ca.batsmanMeanStrikeRate("aplayer.csv","A Player")
#ca.batsmanRunsRanges("aplayer.csv","A Player") 

6. More analyses

This gives details on the batsmen’s 4s, 6s and dismissals

import cricpy.analytics as ca
#ca.batsman4s("aplayer.csv","A Player")
#ca.batsman6s("aplayer.csv","A Player") 
#ca.batsmanDismissals("aplayer.csv","A Player")
# The below function is for ODI and T20 only
#ca.batsmanScoringRateODTT("./kohli.csv","Virat Kohli")  

7. 3D scatter plot and prediction plane

The plots below show the 3D scatter plot of Runs versus Balls Faced and Minutes at crease. A linear regression plane is then fitted between Runs and Balls Faced + Minutes at crease

import cricpy.analytics as ca
#ca.battingPerf3d("aplayer.csv","A Player")

8. Average runs at different venues

The plot below gives the average runs scored at different grounds. The plot also the number of innings at each ground as a label at x-axis.

import cricpy.analytics as ca
#ca.batsmanAvgRunsGround("aplayer.csv","A Player")

9. Average runs against different opposing teams

This plot computes the average runs scored against different countries.

import cricpy.analytics as ca
#ca.batsmanAvgRunsOpposition("aplayer.csv","A Player")

10. Highest Runs Likelihood

The plot below shows the Runs Likelihood for a batsman.

import cricpy.analytics as ca
#ca.batsmanRunsLikelihood("aplayer.csv","A Player")

11. A look at the Top 4 batsman

Choose any number of players

1.Player1 2.Player2 3.Player3 …

The following plots take a closer at their performances. The box plots show the median the 1st and 3rd quartile of the runs

12. Box Histogram Plot

This plot shows a combined boxplot of the Runs ranges and a histogram of the Runs Frequency

import cricpy.analytics as ca
#ca.batsmanPerfBoxHist("aplayer001.csv","A Player001")
#ca.batsmanPerfBoxHist("aplayer002.csv","A Player002")
#ca.batsmanPerfBoxHist("aplayer003.csv","A Player003")
#ca.batsmanPerfBoxHist("aplayer004.csv","A Player004")

13. Get Player Data special

import cricpy.analytics as ca
#player1sp = ca.getPlayerDataSp(profile1,tdir=".",tfile="player1sp.csv",ttype="batting")
#player2sp = ca.getPlayerDataSp(profile2,tdir=".",tfile="player2sp.csv",ttype="batting")
#player3sp = ca.getPlayerDataSp(profile3,tdir=".",tfile="player3sp.csv",ttype="batting")
#player4sp = ca.getPlayerDataSp(profile4,tdir=".",tfile="player4sp.csv",ttype="batting")

14. Contribution to won and lost matches

Note:This can only be used for Test matches

import cricpy.analytics as ca
#ca.batsmanContributionWonLost("player1sp.csv","A Player001")
#ca.batsmanContributionWonLost("player2sp.csv","A Player002")
#ca.batsmanContributionWonLost("player3sp.csv","A Player003")
#ca.batsmanContributionWonLost("player4sp.csv","A Player004")

15. Performance at home and overseas

Note:This can only be used for Test matches This function also requires the use of getPlayerDataSp() as shown above

import cricpy.analytics as ca
#ca.batsmanPerfHomeAway("player1sp.csv","A Player001")
#ca.batsmanPerfHomeAway("player2sp.csv","A Player002")
#ca.batsmanPerfHomeAway("player3sp.csv","A Player003")
#ca.batsmanPerfHomeAway("player4sp.csv","A Player004")

16 Moving Average of runs in career

import cricpy.analytics as ca
#ca.batsmanMovingAverage("aplayer001.csv","A Player001")
#ca.batsmanMovingAverage("aplayer002.csv","A Player002")
#ca.batsmanMovingAverage("aplayer003.csv","A Player003")
#ca.batsmanMovingAverage("aplayer004.csv","A Player004")

17 Cumulative Average runs of batsman in career

This function provides the cumulative average runs of the batsman over the career.

import cricpy.analytics as ca
#ca.batsmanCumulativeAverageRuns("aplayer001.csv","A Player001")
#ca.batsmanCumulativeAverageRuns("aplayer002.csv","A Player002")
#ca.batsmanCumulativeAverageRuns("aplayer003.csv","A Player003")
#ca.batsmanCumulativeAverageRuns("aplayer004.csv","A Player004")

18 Cumulative Average strike rate of batsman in career

.

import cricpy.analytics as ca
#ca.batsmanCumulativeStrikeRate("aplayer001.csv","A Player001")
#ca.batsmanCumulativeStrikeRate("aplayer002.csv","A Player002")
#ca.batsmanCumulativeStrikeRate("aplayer003.csv","A Player003")
#ca.batsmanCumulativeStrikeRate("aplayer004.csv","A Player004")

19 Future Runs forecast

import cricpy.analytics as ca
#ca.batsmanPerfForecast("aplayer001.csv","A Player001")

20 Relative Batsman Cumulative Average Runs

The plot below compares the Relative cumulative average runs of the batsman for each of the runs ranges of 10 and plots them.

import cricpy.analytics as ca
frames = ["aplayer1.csv","aplayer2.csv","aplayer3.csv","aplayer4.csv"]
names = ["A Player1","A Player2","A Player3","A Player4"]
#ca.relativeBatsmanCumulativeAvgRuns(frames,names)

21 Plot of 4s and 6s

import cricpy.analytics as ca
frames = ["aplayer1.csv","aplayer2.csv","aplayer3.csv","aplayer4.csv"]
names = ["A Player1","A Player2","A Player3","A Player4"]
#ca.batsman4s6s(frames,names)

22. Relative Batsman Strike Rate

The plot below gives the relative Runs Frequency Percetages for each 10 run bucket. The plot below show

import cricpy.analytics as ca
frames = ["aplayer1.csv","aplayer2.csv","aplayer3.csv","aplayer4.csv"]
names = ["A Player1","A Player2","A Player3","A Player4"]
#ca.relativeBatsmanCumulativeStrikeRate(frames,names)

23. 3D plot of Runs vs Balls Faced and Minutes at Crease

The plot is a scatter plot of Runs vs Balls faced and Minutes at Crease. A prediction plane is fitted

import cricpy.analytics as ca
#ca.battingPerf3d("aplayer001.csv","A Player001")
#ca.battingPerf3d("aplayer002.csv","A Player002")
#ca.battingPerf3d("aplayer003.csv","A Player003")
#ca.battingPerf3d("aplayer004.csv","A Player004")

24. Predicting Runs given Balls Faced and Minutes at Crease

A multi-variate regression plane is fitted between Runs and Balls faced +Minutes at crease.

import cricpy.analytics as ca
import numpy as np
import pandas as pd
BF = np.linspace( 10, 400,15)
Mins = np.linspace( 30,600,15)
newDF= pd.DataFrame({'BF':BF,'Mins':Mins})
#aplayer = ca.batsmanRunsPredict("aplayer.csv",newDF,"A Player")
#print(aplayer)

The fitted model is then used to predict the runs that the batsmen will score for a given Balls faced and Minutes at crease.

25 Analysis of Top 3 wicket takers

Take any number of bowlers from either Test, ODI or T20

  1. Bowler1
  2. Bowler2
  3. Bowler3 …

26. Get the bowler’s data (Test)

This plot below computes the percentage frequency of number of wickets taken for e.g 1 wicket x%, 2 wickets y% etc and plots them as a continuous line

import cricpy.analytics as ca
#abowler1 =ca.getPlayerData(profileNo1,dir=".",file="abowler1.csv",type="bowling",homeOrAway=[1,2], result=[1,2,4])
#abowler2 =ca.getPlayerData(profileNo2,dir=".",file="abowler2.csv",type="bowling",homeOrAway=[1,2], result=[1,2,4])
#abowler3 =ca.getPlayerData(profile3,dir=".",file="abowler3.csv",type="bowling",homeOrAway=[1,2], result=[1,2,4])

26b For ODI bowlers

import cricpy.analytics as ca
#abowler1 =ca.getPlayerDataOD(profileNo1,dir=".",file="abowler1.csv",type="bowling")
#abowler2 =ca.getPlayerDataOD(profileNo2,dir=".",file="abowler2.csv",type="bowling")
#abowler3 =ca.getPlayerDataOD(profile3,dir=".",file="abowler3.csv",type="bowling")

26c For T20 bowlers

import cricpy.analytics as ca
#abowler1 =ca.getPlayerDataTT(profileNo1,dir=".",file="abowler1.csv",type="bowling")
#abowler2 =ca.getPlayerDataTT(profileNo2,dir=".",file="abowler2.csv",type="bowling")
#abowler3 =ca.getPlayerDataTT(profile3,dir=".",file="abowler3.csv",type="bowling")

27. Wicket Frequency Plot

This plot below plots the frequency of wickets taken for each of the bowlers

import cricpy.analytics as ca
#ca.bowlerWktsFreqPercent("abowler1.csv","A Bowler1")
#ca.bowlerWktsFreqPercent("abowler2.csv","A Bowler2")
#ca.bowlerWktsFreqPercent("abowler3.csv","A Bowler3")

28. Wickets Runs plot

The plot below create a box plot showing the 1st and 3rd quartile of runs conceded versus the number of wickets taken

import cricpy.analytics as ca
#ca.bowlerWktsRunsPlot("abowler1.csv","A Bowler1")
#ca.bowlerWktsRunsPlot("abowler2.csv","A Bowler2")
#ca.bowlerWktsRunsPlot("abowler3.csv","A Bowler3")

29 Average wickets at different venues

The plot gives the average wickets taken bat different venues.

import cricpy.analytics as ca
#ca.bowlerAvgWktsGround("abowler1.csv","A Bowler1")
#ca.bowlerAvgWktsGround("abowler2.csv","A Bowler2")
#ca.bowlerAvgWktsGround("abowler3.csv","A Bowler3")

30 Average wickets against different opposition

The plot gives the average wickets taken against different countries.

import cricpy.analytics as ca
#ca.bowlerAvgWktsOpposition("abowler1.csv","A Bowler1")
#ca.bowlerAvgWktsOpposition("abowler2.csv","A Bowler2")
#ca.bowlerAvgWktsOpposition("abowler3.csv","A Bowler3")

31 Wickets taken moving average

import cricpy.analytics as ca
#ca.bowlerMovingAverage("abowler1.csv","A Bowler1")
#ca.bowlerMovingAverage("abowler2.csv","A Bowler2")
#ca.bowlerMovingAverage("abowler3.csv","A Bowler3")

32 Cumulative average wickets taken

The plots below give the cumulative average wickets taken by the bowlers.

import cricpy.analytics as ca
#ca.bowlerCumulativeAvgWickets("abowler1.csv","A Bowler1")
#ca.bowlerCumulativeAvgWickets("abowler2.csv","A Bowler2")
#ca.bowlerCumulativeAvgWickets("abowler3.csv","A Bowler3")

33 Cumulative average economy rate

The plots below give the cumulative average economy rate of the bowlers.

import cricpy.analytics as ca
#ca.bowlerCumulativeAvgEconRate("abowler1.csv","A Bowler1")
#ca.bowlerCumulativeAvgEconRate("abowler2.csv","A Bowler2")
#ca.bowlerCumulativeAvgEconRate("abowler3.csv","A Bowler3")

34 Future Wickets forecast

import cricpy.analytics as ca
#ca.bowlerPerfForecast("abowler1.csv","A bowler1")

35 Get player data special

import cricpy.analytics as ca
#abowler1sp =ca.getPlayerDataSp(profile1,tdir=".",tfile="abowler1sp.csv",ttype="bowling")
#abowler2sp =ca.getPlayerDataSp(profile2,tdir=".",tfile="abowler2sp.csv",ttype="bowling")
#abowler3sp =ca.getPlayerDataSp(profile3,tdir=".",tfile="abowler3sp.csv",ttype="bowling")

36 Contribution to matches won and lost

Note:This can be done only for Test cricketers

import cricpy.analytics as ca
#ca.bowlerContributionWonLost("abowler1sp.csv","A Bowler1")
#ca.bowlerContributionWonLost("abowler2sp.csv","A Bowler2")
#ca.bowlerContributionWonLost("abowler3sp.csv","A Bowler3")

37 Performance home and overseas

Note:This can be done only for Test cricketers

import cricpy.analytics as ca
#ca.bowlerPerfHomeAway("abowler1sp.csv","A Bowler1")
#ca.bowlerPerfHomeAway("abowler2sp.csv","A Bowler2")
#ca.bowlerPerfHomeAway("abowler3sp.csv","A Bowler3")

38 Relative cumulative average economy rate of bowlers

import cricpy.analytics as ca
frames = ["abowler1.csv","abowler2.csv","abowler3.csv"]
names = ["A Bowler1","A Bowler2","A Bowler3"]
#ca.relativeBowlerCumulativeAvgEconRate(frames,names)

39 Relative Economy Rate against wickets taken

import cricpy.analytics as ca
frames = ["abowler1.csv","abowler2.csv","abowler3.csv"]
names = ["A Bowler1","A Bowler2","A Bowler3"]
#ca.relativeBowlingER(frames,names)

40 Relative cumulative average wickets of bowlers in career

import cricpy.analytics as ca
frames = ["abowler1.csv","abowler2.csv","abowler3.csv"]
names = ["A Bowler1","A Bowler2","A Bowler3"]
#ca.relativeBowlerCumulativeAvgWickets(frames,names)

Clone/download this cricpy template for your own analysis of players. This can be done using RStudio or IPython notebooks from Github at cricpy-template

Important note: Do check out my other posts using cricpy at cricpy-posts

Key Findings

Analysis of Top 4 batsman

Analysis of Top 3 bowlers

You may also like
1. My book ‘Deep Learning from first principles:Second Edition’ now on Amazon
2. Presentation on ‘Evolution to LTE’
3. Stacks of protocol stacks – A primer
4. Taking baby steps in Lisp
5. Introducing cricket package yorkr: Part 1- Beaten by sheer pace!

To see all posts click Index of posts