A peek into literacy in India: Statistical Learning with R

In this post I take a peek into the literacy landscape across India as a whole using R language.  The dataset from Open Government Data (OGD) platform India was used for this purpose. This data is based on the 2011 census. The XL sheets for the states were downloaded for data for each state. The Union Territories were not included in the analysis.

A thin slice of the data from each data set was taken from the data for each individual state (Note: This could also have been done from the consolidated india.xls XL sheet which I came to know of, much later).

I calculate the following for age group

Males (%) attending education institutions = (Males attending educational institutions * 100)/ Total males
Females (%) attending education institutions = (Females attending educational institutions * 100)/ Total Females

This is then plotted as a bar chart with the age distribution. I then overlay the national average for each state over the barchart to check whether the literacy in the state is above or below the national average. The implementation in R is included below

The code and data can be forked/cloned from GitHub at india-literacy

The results based on the analysis is given below.

  1. Kerala is clearly the top ranker with the literacy rates for both males and females well above the average
  2. The states with above average literacy are – Kerala, Himachal Pradesh, Uttarakhand, Tamil Nadu, Haryana, Himachal Pradesh, Karnataka, Maharashtra, Punjab, Uttarakhand
  3. The states with just about average literacy – Karnataka, Andhra Pradesh, Chattisgarh, Gujarat, Madhya Pradesh, Odisha, West Bengal
  4. The states with below average literacy – Uttar Pradesh, Bihar, Jharkhand, Arunachal Pradesh, Assam, Jammu and Kashmir, Jharkhand, Rajasthan


A brief implementation of the basic code in R is shown bwelow

# Read the Arunachal Pradhesh literacy related data
arunachal = read.csv("arunachal.csv")
# Create as a matrix
arunachalmat = as.matrix(arunachal)
arunachalTotal = arunachalmat[2:19,7:28]
# Take transpose as this is necessary for plotting bar charts
arunachalmat = t(arunachalTotal)
# Set the scipen option to format the y axis (otherwise prints as e^05 etc.)
getOption("scipen")
opt <- options("scipen" = 20)
getOption("scipen")
#Create a vector of total Males & Females
arunachalTotalM = arunachalmat[3,]
arunachalTotalF = arunachalmat[4,]
#Create a vector of males & females attending education institution
arunachalM = arunachalmat[6,]
arunachalF = arunachalmat[7,]
#Calculate percent of males attending education of total
arunachalpercentM = round(as.numeric(arunachalM) *100/as.numeric(arunachalTotalM),1)
barplot(arunachalpercentM,names.arg=arunachalmat[1,],main ="Percentage males attending educational institutions in Arunachal Pradesh",
xlab = "Age", ylab= "Percentage",ylim = c(0,100), col ="lightblue", legend= c("Males"))
points(age,indiapercentM,pch=15)
lines(age,indiapercentM,col="red",pch=20,lty=2,lwd=3)
legend( x="bottomright",
legend=c("National average"),
col=c("red"), bty="n" , lwd=1, lty=c(2),
pch=c(15) )
#Calculate percent of females attending education of total
arunachalpercentF = round(as.numeric(arunachalF) *100/as.numeric(arunachalTotalF),1)
barplot(arunachalpercentF,names.arg=arunachalmat[1,],main ="Percentage females attending educational institutions in Arunachal Pradesh ",
xlab = "Age", ylab= "Percentage", ylim = c(0,100), col ="lightblue", legend= c("Females"))
points(age,indiapercentF,pch=15)
lines(age,indiapercentF,col="red",pch=20,lty=2,lwd=3)
legend( x="bottomright",
legend=c("National average"),
col=c("red"), bty="n" , lwd=1, lty=c(2),
pch=c(15) )

A) Overall plot for India

a) India – Males

india-males

b) India – females

india-females

The plots for each individual state is given below

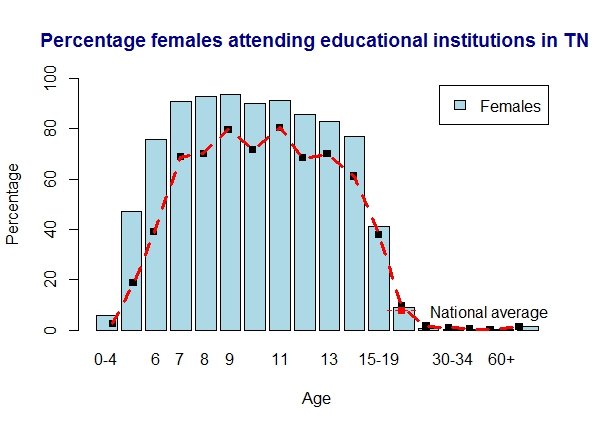
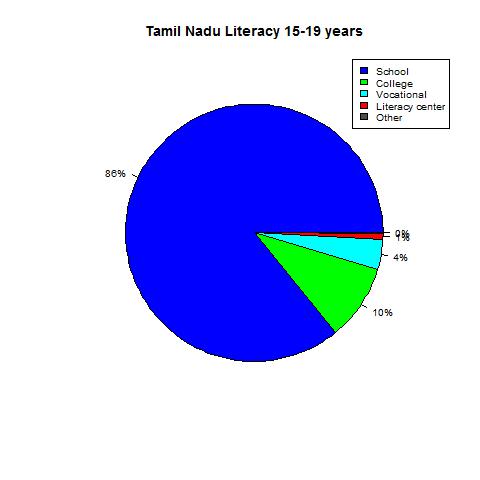
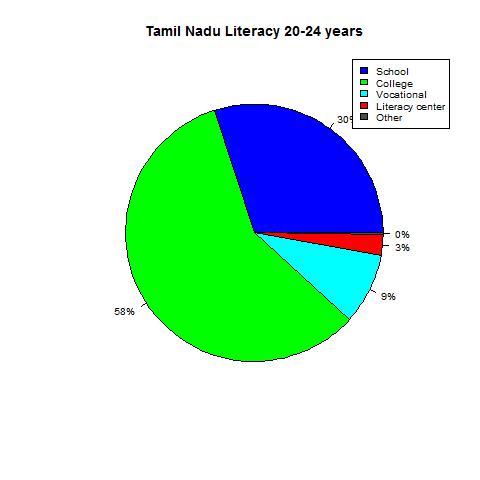
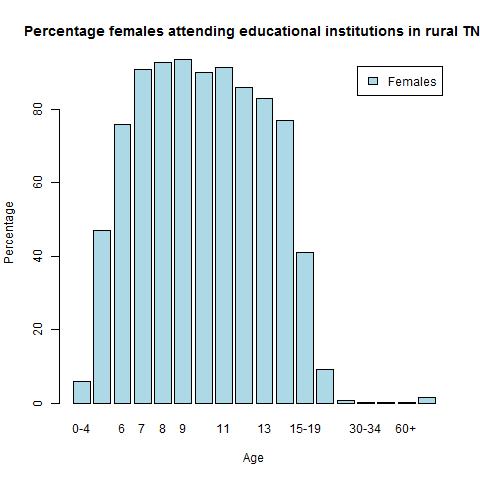
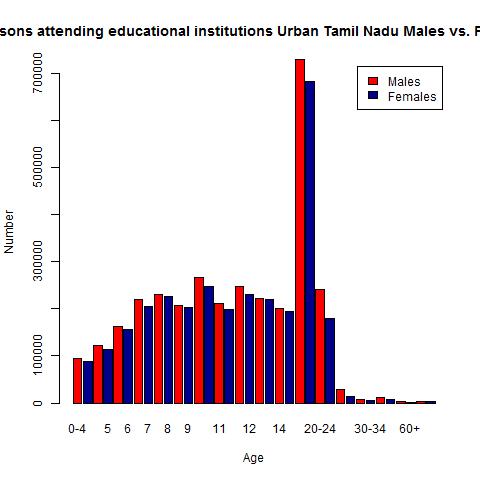
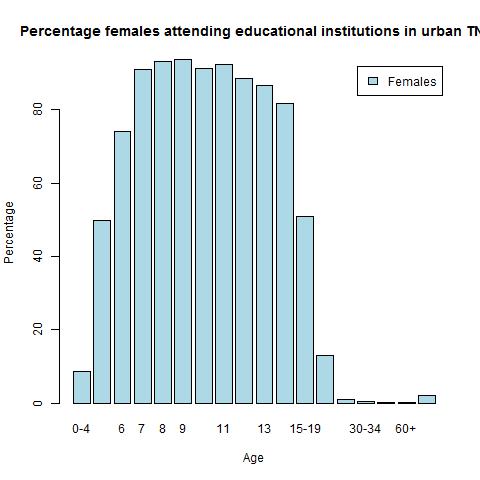
1) Literacy in Tamil Nadu

Tamil Nadu is slightly over the national average. The women seem to do marginally better than the males

a) Tamil Nadu – males

tn-males

b) Tamil Nadu – females

tn-females

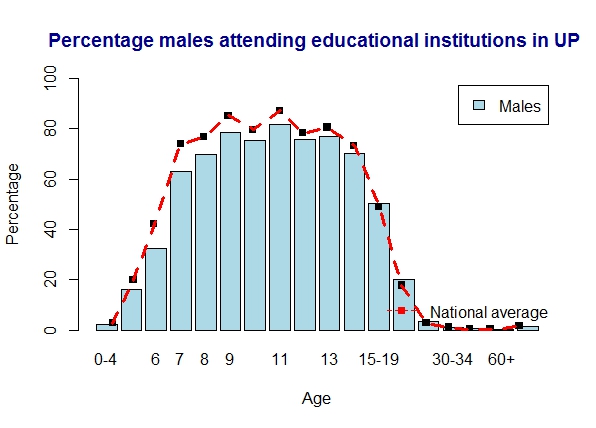
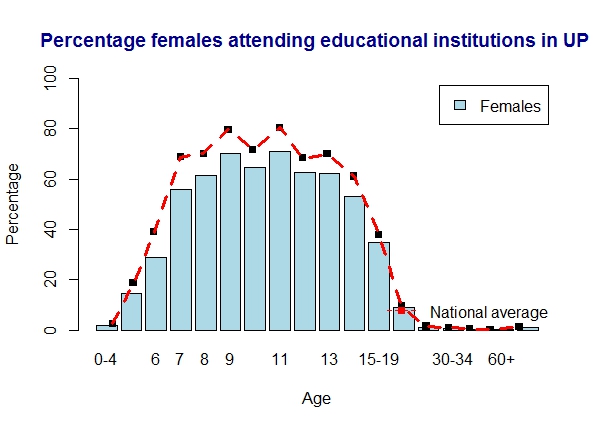
2) Literacy in Uttar Pradesh

UP is slightly below the national average. Women are comparatively below men here

a) Uttar Pradesh – males

UP-males

b) Uttar Pradesh – females

UP-females

3) Literacy in Bihar

Bihar is well below the national average for both men and women

a) Bihar – males

bihar-males

b) Bihar – females

bihar-females

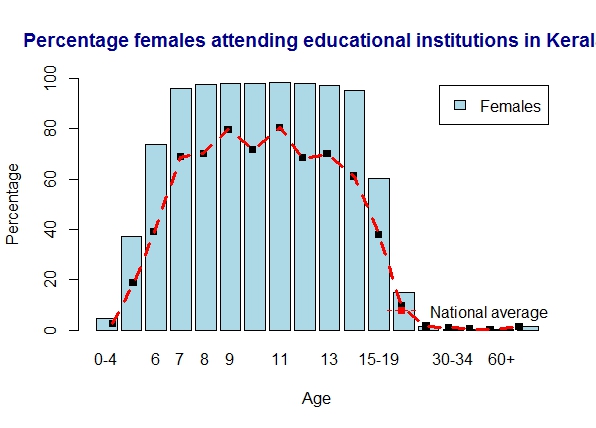
4. Literacy in Kerala

Kerala is the winner all the way in literacy with almost 100% literacy across all age groups

a) Kerala – males


kerala-females

b) Kerala -females

kerala-females


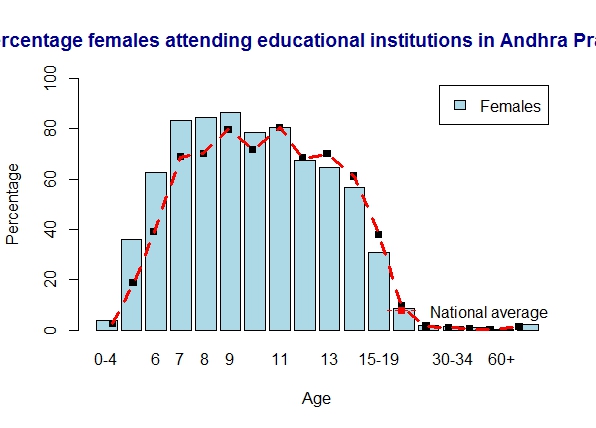
5. Literacy in Andhra Pradesh

AP just meets the national average for literacy.

a) Andhra Pradesh – males

andhra-males

b) Andhra Pradesh – females

andhra-females

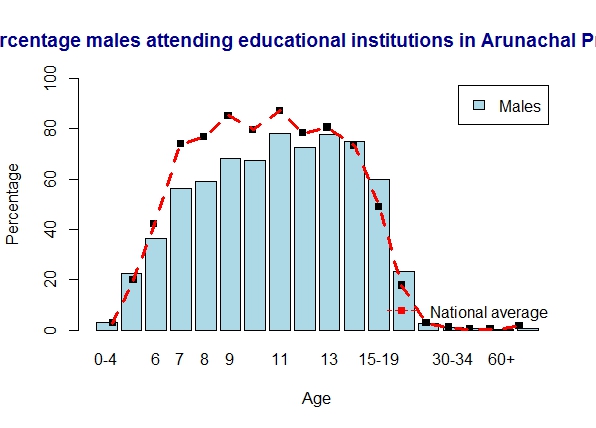
6. Literacy in Arunachal Pradesh

Arunachal Pradesh is below average for most of the age groups

a) Arunachal Pradesh – males

arunachal-males

b) Arunachal Pradesh – females

arunachal-females

7. Literacy in  Assam

Assam is below national average

a) Assam – males

assam-males

b) Assam – females

assam-females


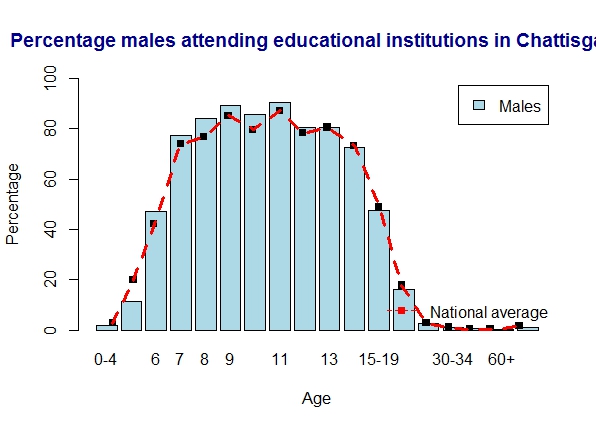
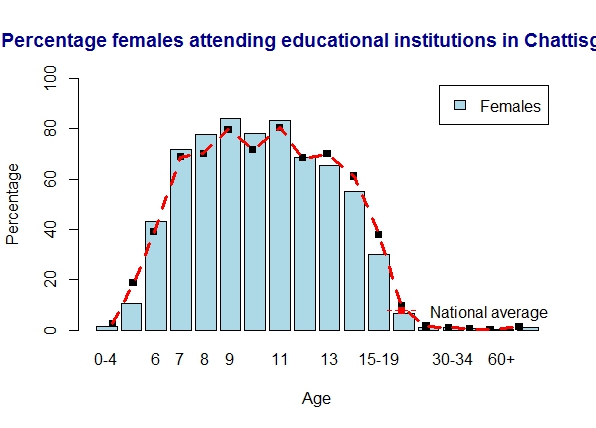
8. Literacy in Chattisgarh

Chattisgarh is on par with the national average for both men and women

a) Chattisgarh – males

chattisgarh-males

b) Chattisgarh – females

chattisgarh-females


9. Literacy in Gujarat

Gujarat is just about average

a) Gujarat – males

gujarat-males

b) Gujarat – females

gujarat-females

10. Literacy in Haryana

Haryana is slightly above average

a) Haryana – males

haryana-males

b) Haryana – females

haryana-females11.  Literacy in Himachal Pradesh

Himachal Pradesh is cool and above average.

a) Himachal Pradesh – males

himachal-males


b) Himachal Pradesh – females

himachal-females

12. Literacy in Jammu and Kashmir

J & K is marginally below average

a) Jammu and Kashmir – males

jk-males

b) Jammu and Kashmir – females

jk-females


13. Literacy in Jharkhand

Jharkhand is some ways below average

a) Jharkhand – males

jharkand-males

b) Jharkhand – females

jharkand-feamles

14. Literacy in Karnataka

Karnataka is on average for men. Womem seem to do better than men here

a) Karnataka – males

karnataka-males

b) Karnataka – females

karnataka-females

15. Literacy in Madhya Pradesh

Madhya Pradesh meets the national average

a) Madhya Pradesh – males

mp-males

b) Madhya Pradesh – females

mp-females

16. Literacy in Maharashtra

Maharashtra is front-runner in literacy

a) Maharashtra – females

maharashtra

b) Maharastra – females

maharashtra-feamles


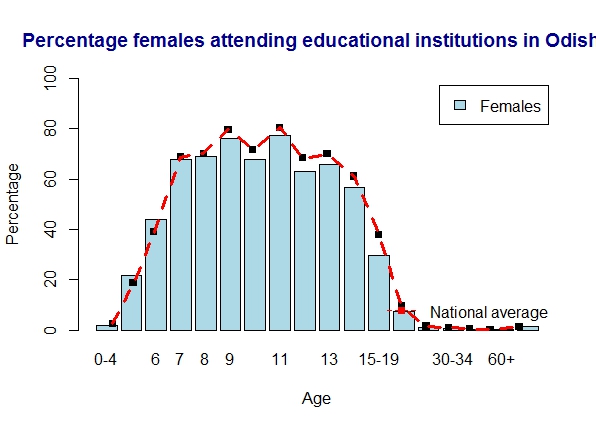
17. Literacy in Odisha

Odisha meets national average

a) Odisha – males

odisha-males

b) Odisha – females

odisha-females


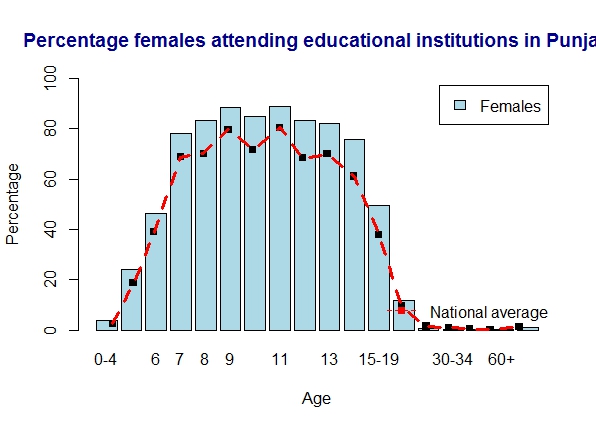
18. Literacy in  Punjab

Punjab is marginally above average with women doing even better

a) Punjab – males

punjab-males

b) Punjab – females

punjab-females19. Literacy in Rajasthan

Rajasthan is average for males and below average for females

a) Rajasthan – males

rajashthan-males

b) Rajasthan – females

rajasthan-females
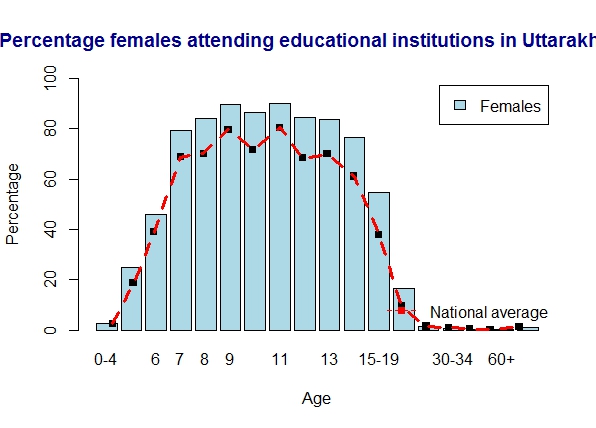
20. Literacy in Uttarakhand

Uttarakhand rocks and is above average

a) Uttarakhand – males

uttarkhan-males

b) Uttarakhand – females

uttarkhand-females

21. Literacy in West Bengal

West Bengal just about meets the national average.

a) West Bengal – males

wb-males


b) West Bengal – females

wb-females

The code can be cloned/forked from GitHub  india-literacy. I have done my analysis on the overall data. The data is further sub-divided across districts in each state and further into urban and rural. Many different ways of analysing are possible. One method is shown here

Conclusion

  1. Kerala is clearly head and shoulders above all states when it comes to literacy
  2. Many states are above average. They are Kerala, Himachal Pradesh, Uttarakhand, Tamil Nadu, Haryana, Himachal Pradesh, Karnataka, Maharashtra, Punjab, Uttarakhand
  3. States with average literacy are – Karnataka, Andhra Pradesh, Chattisgarh, Gujarat, Madhya Pradesh, Odisha, West Bengal
  4. States which fall below the national average are – Uttar Pradesh, Bihar, Jharkhand, Arunachal Pradesh, Assam, Jammu and Kashmir, Jharkhand, Rajasthan

See also
– A crime map of India in R: Crimes against women
– What’s up Watson? Using IBM Watson’s QAAPI with Bluemix, NodeExpress – Part 1
– Bend it like Bluemix, MongoDB with autoscaling – Part 1

Statistical learning with R: A look at literacy in Tamil Nadu

In this post I make my first foray into data mining using the R language. As a start, I picked up the data from the Open Government Data (OGD Platform of India from the Ministry of Human Resources. There are many data sets under Education. To get started I picked the data set on Tamil Nadu which deals with the population attending educational institutions by age, sex and institution type. Similar data is available for all states.

I wanted to start off on a small scale, primarily to checkout some of the features of the R language. R is clearly the language of choice for processing large amounts of data. R has close to 4000+ packages that can do various things like statistical, regression analysis etc. However I found this is no easy task. There are a zillion ways in which you can take cross-sections of a large dataset. Some of them will provide useful insights while others will lead you nowhere.

Also see my post Literacy in India – A deepR dive!

Data science, which is predicted to be the technology of the future based on with the mountains of data being generated daily, will in my opinion, will be more of an art and less of a science. There will be wizards who will be able to spot remarkable truths in the mundane data while others will not be that successful.

Anyway back to my attempt to divine intelligence in the Tamil Nadu(TN)  literacy data. The data downloaded was an Excel sheet with 1767 rows and 28 columns. The first 60 rows deal with the overall statistics of literacy in Tamil Nadu state as a whole. Further below are the statistics on the individual districts of Tamil nadu.
Each of this is further divided into urban and rural parts. The data covers persons from the age of 4 upto the age of 60 and whether they attended school, college, vocational institute etc. To make my initial attempt manageable I have just focused on the data for Tamil Nadu state as a whole including the breakup of the urban and rural data.

My analysis is included below. The code and the dataset for this implementation is in R language and can be cloned from GitHub at tamilnadu-literacy-analysis

Analysis of Tamil Nadu (total)
The total population of Tamil Nadu based on an age breakup is shown below

1) Total population Tamil Nadu 
tntotal

2) Males  & Females attending education institutions in TN

tneduThere are marginally more males attending educational institutions. Also the number of persons attending educational institutions seems to drop from 11 years of age. There is a spike around 20-24 years and people go to school and college at this age. See pie chart 8) below

3) Percentage of males attending educational institution of the total males

percenteduM

4) Percentage females attending educational institutions in TN 

percenteduF

There is a very similar trend between males and females. The attendance peaks between 9 – 11 years of age and then falls to roughly 50% around 15-19 years and rapidly falls off

5) Boys and girls attending school in TN

tnschool

For some reason there is a marked increase for boys and girls around 20-24. Possibly people repeat classes around this age

6) Persons attending college in TN

tncollege

7) Educational institutions attended by persons between 15- 19 years

tnschool-1

8) Educational institutions attended by persons between 20-24 tnschool-2

As can be seen there is a large percentage (30%)  of people in the 20-24 age group who are in school. This is probably the reason for the spike in “Boys and girls attending school in TN” see 2) for the 20-24 years of age

Education in rural Tamil Nadu

1) Total rural population Tamil Nadu 

ruraltotal

2) Males  & Females attending education institutions in  rural TNruraledu3) Percentage of rural males attending educational institution

percentruralM

4) Percentage females attending educational institutions in rural TN of total females

percentruralF

The persons attending education drops rapidly to 40% between 15-19 years of age for both males and females

5) Boys and girls attending school in rural TN

ruralschool

6) Persons attending college in rural TN

ruralcollege

7) Educational institutions attended by persons between 15- 19 years in rural TN

rural-1

8) Educational institutions attended by persons between 20-24 in rural TN

rural-2

As can be seen there is a large percentage (39%)  of rural people in the 20-24 age group who are in school

Education in urban Tamil Nadu

1) Total population in urban Tamil Nadu 

urbantotal

2) Males  & Females attending education institutions in urban TNurbanedu3) Percentage of males attending educational institution of the total males in urban TNpercentruralM4) Percentage females attending educational institutions in urban TN

percenturbanF

5) Boys and girls attending school in urban TN

urbanschool

6) Persons attending college in urban TN

urbancollege

7) Educational institutions attended by persons between 15- 19 years in urban TN

urban-1

8) Educational institutions attended by persons between 20-24 in urban TN

urban-2

As can be seen there is a large percentage (25%) of rural people in the 20-24 age group who are in school

The R implementation and the Tamil Nadu dataset can be cloned from my repository in GitHub at tamilnadu-literacy-analysis 

The above analysis is just one of a million possible ways the data can be analyzed and visually represented. I hope to hone my skill as progress along in similar analysis.

Hasta la vista! I’ll be back.

Watch this space!

To R is human …

“To R is human, to dabble in it fun” one could say. In this post I try to be a little of Nate Silver looking at Twiiterverse. Since the Indian general election 2014 is around the corner for constituting the 16th Lok Sabha in India I wanted to play around a little bit. Anyway here goes.

To get started on Twitter, with R we first need to establish a handshake between Twitter and R. We need to authenticate our R application with Twitter to enable us to mine the tweets in Twitterverse.. The steps are fairly straightforward. The R app you create has to authenticated and authorized with Twitter.

The first step is to create an app at Twitter at http://dev.twitter.com.. Login to your twitter account. Click the drop down at your photo and choose “My applications”. Then click “Create new application”. Now do the following
– Enter a unique name for your application
– Enter a description
– For the ‘Website’ enter any valid URL
– Leave the Callback URL blank
– Accept the conditions

bb
Leave this in your browser. The handshake between your R application and Twitter needs to be established as follows

#install the necessary packages
install.packages("ROAuth")
install.packages("twitteR")
install.packages("wordcloud")
install.packages("tm")

library("ROAuth")
library("twitteR")
library("wordcloud")
library("tm")
library(RCurl)

# Set SSL certs globally
options(RCurlOptions = list(cainfo = system.file("CurlSSL", "cacert.pem", package = "RCurl")))

require(twitteR)
reqURL <- "https://api.twitter.com/oauth/request_token"
accessURL <- "https://api.twitter.com/oauth/access_token"
authURL <- "https://api.twitter.com/oauth/authorize"

Now go to your browser. In the created Twitter application, choose the API Keys tab. Copy and paste the API key and API secret in the next 2 lines

apiKey <- "Your API key here"
apiSecret <- "Your API secret here"
twitCred twitCred$handshake(cainfo = system.file("CurlSSL", "cacert.pem", package = "RCurl"))

When you enter this you should see the following
To enable the connection, please direct your web browser to:
https://api.twitter.com/oauth/authorize?oauth_token=WnTGL4eHsiNJRFRiW1UU3GoYSvVZiYDBbO3WAsZO

Copy and paste the link given in a new tab in your browser. Copy the 7 digit PIN and paste it in the space below
When complete, record the PIN given to you and provide it here: 7377963

registerTwitterOAuth(twitCred)

This should complete the authorization. Now you are good to go.

Here is a short example of performing Text Mining with the help of package “tm”.

I wanted to create a word cloud around the hashtag #NaMo

So here is the code. We need to create a Corpus

#Search Twitter for the hashtag #NaMo

#Search Twitter for the hashtag #NaMo
r_stats<- searchTwitter("#NaMo",n=500, cainfo="cacert.pem")


# Save text
r_stats_text <- sapply(r_stats, function(x) x$getText())
# Create a corpus
r_stats_text_corpus <- Corpus(VectorSource(r_stats_text))
# Clean up the text
r_stats_text_corpus <- tm_map(r_stats_text_corpus, tolower)
r_stats_text_corpus <- tm_map(r_stats_text_corpus, removePunctuation)
r_stats_text_corpus <- tm_map(r_stats_text_corpus, function(x)removeWords(x,stopwords()))

# Now create a word cloud
wordcloud(r_stats_text_corpus)

modi

This will create a Wordcloud of the words most used with the hashtag, in this case #NaMo

You can clone the code at Rwordcloud

Watch this space. Hasta la vista. I’ll be back!

Find me on Google+