Analyzing batsmen and bowlers with cricpy template

Introduction

This post shows how you can analyze batsmen and bowlers of Test, ODI and T20s using cricpy templates, using data from ESPN Cricinfo.

The cricpy package

The data for a particular player can be obtained with the getPlayerData() function. To do you will need to go to ESPN CricInfo Player and type in the name of the player for e.g Rahul Dravid, Virat Kohli  etc. This will bring up a page which have the profile number for the player e.g. for Rahul Dravid this would be http://www.espncricinfo.com/india/content/player/28114.html. Hence, Dravid’s profile is 28114. This can be used to get the data for Rahul Dravid as shown below

1. For Test players use batting and bowling.
2. For ODI use batting and bowling
3. For T20 use T20 Batting T20 Bowling

Please mindful of the  ESPN Cricinfo Terms of Use

My posts on Cripy were
a. Introducing cricpy:A python package to analyze performances of cricketers
b. Cricpy takes a swing at the ODIs
c. Cricpy takes guard for the Twenty20s

You can clone/download this cricpy template for your own analysis of players. This can be done using RStudio or IPython notebooks from Github at cricpy-template. You can uncomment the functions and use them.

Cricpy can now analyze performances of teams in Test, ODI and T20 cricket see Cricpy adds team analytics to its arsenal!!

This post is also hosted on Rpubs at Int

The cricpy package is now available with pip install cricpy!!!

If you are passionate about cricket, and love analyzing cricket performances, then check out my racy book on cricket ‘Cricket analytics with cricketr and cricpy – Analytics harmony with R & Python’! This book discusses and shows how to use my R package ‘cricketr’ and my Python package ‘cricpy’ to analyze batsmen and bowlers in all formats of the game (Test, ODI and T20). The paperback is available on Amazon at $21.99 and  the kindle version at $9.99/Rs 449/-. A must read for any cricket lover! Check it out!!

You can download the latest PDF version of the book  at  ‘Cricket analytics with cricketr and cricpy: Analytics harmony with R and Python-6th edition

Untitled

1 Importing cricpy – Python

# Install the package
# Do a pip install cricpy
# Import cricpy
import cricpy.analytics as ca 
## C:\Users\Ganesh\ANACON~1\lib\site-packages\statsmodels\compat\pandas.py:56: FutureWarning: The pandas.core.datetools module is deprecated and will be removed in a future version. Please use the pandas.tseries module instead.
##   from pandas.core import datetools

2. Invoking functions with Python package cricpy

import cricpy.analytics as ca 
#ca.batsman4s("aplayer.csv","A Player")

3. Getting help from cricpy – Python

import cricpy.analytics as ca
#help(ca.getPlayerData)

The details below will introduce the different functions that are available in cricpy.

4. Get the player data for a player using the function getPlayerData()

Important Note This needs to be done only once for a player. This function stores the player’s data in the specified CSV file (for e.g. dravid.csv as above) which can then be reused for all other functions). Once we have the data for the players many analyses can be done. This post will use the stored CSV file obtained with a prior getPlayerData for all subsequent analyses

4a. For Test players

import cricpy.analytics as ca
#player1 =ca.getPlayerData(profileNo1,dir="..",file="player1.csv",type="batting",homeOrAway=[1,2], result=[1,2,4])
#player1 =ca.getPlayerData(profileNo2,dir="..",file="player2.csv",type="batting",homeOrAway=[1,2], result=[1,2,4])

4b. For ODI players

import cricpy.analytics as ca
#player1 =ca.getPlayerDataOD(profileNo1,dir="..",file="player1.csv",type="batting")
#player1 =ca.getPlayerDataOD(profileNo2,dir="..",file="player2.csv",type="batting"")

4c For T20 players

import cricpy.analytics as ca
#player1 =ca.getPlayerDataTT(profileNo1,dir="..",file="player1.csv",type="batting")
#player1 =ca.getPlayerDataTT(profileNo2,dir="..",file="player2.csv",type="batting"")

5 A Player’s performance – Basic Analyses

The 3 plots below provide the following for Rahul Dravid

  1. Frequency percentage of runs in each run range over the whole career
  2. Mean Strike Rate for runs scored in the given range
  3. A histogram of runs frequency percentages in runs ranges
import cricpy.analytics as ca
import matplotlib.pyplot as plt
#ca.batsmanRunsFreqPerf("aplayer.csv","A Player")
#ca.batsmanMeanStrikeRate("aplayer.csv","A Player")
#ca.batsmanRunsRanges("aplayer.csv","A Player") 

6. More analyses

This gives details on the batsmen’s 4s, 6s and dismissals

import cricpy.analytics as ca
#ca.batsman4s("aplayer.csv","A Player")
#ca.batsman6s("aplayer.csv","A Player") 
#ca.batsmanDismissals("aplayer.csv","A Player")
# The below function is for ODI and T20 only
#ca.batsmanScoringRateODTT("./kohli.csv","Virat Kohli")  

7. 3D scatter plot and prediction plane

The plots below show the 3D scatter plot of Runs versus Balls Faced and Minutes at crease. A linear regression plane is then fitted between Runs and Balls Faced + Minutes at crease

import cricpy.analytics as ca
#ca.battingPerf3d("aplayer.csv","A Player")

8. Average runs at different venues

The plot below gives the average runs scored at different grounds. The plot also the number of innings at each ground as a label at x-axis.

import cricpy.analytics as ca
#ca.batsmanAvgRunsGround("aplayer.csv","A Player")

9. Average runs against different opposing teams

This plot computes the average runs scored against different countries.

import cricpy.analytics as ca
#ca.batsmanAvgRunsOpposition("aplayer.csv","A Player")

10. Highest Runs Likelihood

The plot below shows the Runs Likelihood for a batsman.

import cricpy.analytics as ca
#ca.batsmanRunsLikelihood("aplayer.csv","A Player")

11. A look at the Top 4 batsman

Choose any number of players

1.Player1 2.Player2 3.Player3 …

The following plots take a closer at their performances. The box plots show the median the 1st and 3rd quartile of the runs

12. Box Histogram Plot

This plot shows a combined boxplot of the Runs ranges and a histogram of the Runs Frequency

import cricpy.analytics as ca
#ca.batsmanPerfBoxHist("aplayer001.csv","A Player001")
#ca.batsmanPerfBoxHist("aplayer002.csv","A Player002")
#ca.batsmanPerfBoxHist("aplayer003.csv","A Player003")
#ca.batsmanPerfBoxHist("aplayer004.csv","A Player004")

13. Get Player Data special

import cricpy.analytics as ca
#player1sp = ca.getPlayerDataSp(profile1,tdir=".",tfile="player1sp.csv",ttype="batting")
#player2sp = ca.getPlayerDataSp(profile2,tdir=".",tfile="player2sp.csv",ttype="batting")
#player3sp = ca.getPlayerDataSp(profile3,tdir=".",tfile="player3sp.csv",ttype="batting")
#player4sp = ca.getPlayerDataSp(profile4,tdir=".",tfile="player4sp.csv",ttype="batting")

14. Contribution to won and lost matches

Note:This can only be used for Test matches

import cricpy.analytics as ca
#ca.batsmanContributionWonLost("player1sp.csv","A Player001")
#ca.batsmanContributionWonLost("player2sp.csv","A Player002")
#ca.batsmanContributionWonLost("player3sp.csv","A Player003")
#ca.batsmanContributionWonLost("player4sp.csv","A Player004")

15. Performance at home and overseas

Note:This can only be used for Test matches This function also requires the use of getPlayerDataSp() as shown above

import cricpy.analytics as ca
#ca.batsmanPerfHomeAway("player1sp.csv","A Player001")
#ca.batsmanPerfHomeAway("player2sp.csv","A Player002")
#ca.batsmanPerfHomeAway("player3sp.csv","A Player003")
#ca.batsmanPerfHomeAway("player4sp.csv","A Player004")

16 Moving Average of runs in career

import cricpy.analytics as ca
#ca.batsmanMovingAverage("aplayer001.csv","A Player001")
#ca.batsmanMovingAverage("aplayer002.csv","A Player002")
#ca.batsmanMovingAverage("aplayer003.csv","A Player003")
#ca.batsmanMovingAverage("aplayer004.csv","A Player004")

17 Cumulative Average runs of batsman in career

This function provides the cumulative average runs of the batsman over the career.

import cricpy.analytics as ca
#ca.batsmanCumulativeAverageRuns("aplayer001.csv","A Player001")
#ca.batsmanCumulativeAverageRuns("aplayer002.csv","A Player002")
#ca.batsmanCumulativeAverageRuns("aplayer003.csv","A Player003")
#ca.batsmanCumulativeAverageRuns("aplayer004.csv","A Player004")

18 Cumulative Average strike rate of batsman in career

.

import cricpy.analytics as ca
#ca.batsmanCumulativeStrikeRate("aplayer001.csv","A Player001")
#ca.batsmanCumulativeStrikeRate("aplayer002.csv","A Player002")
#ca.batsmanCumulativeStrikeRate("aplayer003.csv","A Player003")
#ca.batsmanCumulativeStrikeRate("aplayer004.csv","A Player004")

19 Future Runs forecast

import cricpy.analytics as ca
#ca.batsmanPerfForecast("aplayer001.csv","A Player001")

20 Relative Batsman Cumulative Average Runs

The plot below compares the Relative cumulative average runs of the batsman for each of the runs ranges of 10 and plots them.

import cricpy.analytics as ca
frames = ["aplayer1.csv","aplayer2.csv","aplayer3.csv","aplayer4.csv"]
names = ["A Player1","A Player2","A Player3","A Player4"]
#ca.relativeBatsmanCumulativeAvgRuns(frames,names)

21 Plot of 4s and 6s

import cricpy.analytics as ca
frames = ["aplayer1.csv","aplayer2.csv","aplayer3.csv","aplayer4.csv"]
names = ["A Player1","A Player2","A Player3","A Player4"]
#ca.batsman4s6s(frames,names)

22. Relative Batsman Strike Rate

The plot below gives the relative Runs Frequency Percetages for each 10 run bucket. The plot below show

import cricpy.analytics as ca
frames = ["aplayer1.csv","aplayer2.csv","aplayer3.csv","aplayer4.csv"]
names = ["A Player1","A Player2","A Player3","A Player4"]
#ca.relativeBatsmanCumulativeStrikeRate(frames,names)

23. 3D plot of Runs vs Balls Faced and Minutes at Crease

The plot is a scatter plot of Runs vs Balls faced and Minutes at Crease. A prediction plane is fitted

import cricpy.analytics as ca
#ca.battingPerf3d("aplayer001.csv","A Player001")
#ca.battingPerf3d("aplayer002.csv","A Player002")
#ca.battingPerf3d("aplayer003.csv","A Player003")
#ca.battingPerf3d("aplayer004.csv","A Player004")

24. Predicting Runs given Balls Faced and Minutes at Crease

A multi-variate regression plane is fitted between Runs and Balls faced +Minutes at crease.

import cricpy.analytics as ca
import numpy as np
import pandas as pd
BF = np.linspace( 10, 400,15)
Mins = np.linspace( 30,600,15)
newDF= pd.DataFrame({'BF':BF,'Mins':Mins})
#aplayer = ca.batsmanRunsPredict("aplayer.csv",newDF,"A Player")
#print(aplayer)

The fitted model is then used to predict the runs that the batsmen will score for a given Balls faced and Minutes at crease.

25 Analysis of Top 3 wicket takers

Take any number of bowlers from either Test, ODI or T20

  1. Bowler1
  2. Bowler2
  3. Bowler3 …

26. Get the bowler’s data (Test)

This plot below computes the percentage frequency of number of wickets taken for e.g 1 wicket x%, 2 wickets y% etc and plots them as a continuous line

import cricpy.analytics as ca
#abowler1 =ca.getPlayerData(profileNo1,dir=".",file="abowler1.csv",type="bowling",homeOrAway=[1,2], result=[1,2,4])
#abowler2 =ca.getPlayerData(profileNo2,dir=".",file="abowler2.csv",type="bowling",homeOrAway=[1,2], result=[1,2,4])
#abowler3 =ca.getPlayerData(profile3,dir=".",file="abowler3.csv",type="bowling",homeOrAway=[1,2], result=[1,2,4])

26b For ODI bowlers

import cricpy.analytics as ca
#abowler1 =ca.getPlayerDataOD(profileNo1,dir=".",file="abowler1.csv",type="bowling")
#abowler2 =ca.getPlayerDataOD(profileNo2,dir=".",file="abowler2.csv",type="bowling")
#abowler3 =ca.getPlayerDataOD(profile3,dir=".",file="abowler3.csv",type="bowling")

26c For T20 bowlers

import cricpy.analytics as ca
#abowler1 =ca.getPlayerDataTT(profileNo1,dir=".",file="abowler1.csv",type="bowling")
#abowler2 =ca.getPlayerDataTT(profileNo2,dir=".",file="abowler2.csv",type="bowling")
#abowler3 =ca.getPlayerDataTT(profile3,dir=".",file="abowler3.csv",type="bowling")

27. Wicket Frequency Plot

This plot below plots the frequency of wickets taken for each of the bowlers

import cricpy.analytics as ca
#ca.bowlerWktsFreqPercent("abowler1.csv","A Bowler1")
#ca.bowlerWktsFreqPercent("abowler2.csv","A Bowler2")
#ca.bowlerWktsFreqPercent("abowler3.csv","A Bowler3")

28. Wickets Runs plot

The plot below create a box plot showing the 1st and 3rd quartile of runs conceded versus the number of wickets taken

import cricpy.analytics as ca
#ca.bowlerWktsRunsPlot("abowler1.csv","A Bowler1")
#ca.bowlerWktsRunsPlot("abowler2.csv","A Bowler2")
#ca.bowlerWktsRunsPlot("abowler3.csv","A Bowler3")

29 Average wickets at different venues

The plot gives the average wickets taken bat different venues.

import cricpy.analytics as ca
#ca.bowlerAvgWktsGround("abowler1.csv","A Bowler1")
#ca.bowlerAvgWktsGround("abowler2.csv","A Bowler2")
#ca.bowlerAvgWktsGround("abowler3.csv","A Bowler3")

30 Average wickets against different opposition

The plot gives the average wickets taken against different countries.

import cricpy.analytics as ca
#ca.bowlerAvgWktsOpposition("abowler1.csv","A Bowler1")
#ca.bowlerAvgWktsOpposition("abowler2.csv","A Bowler2")
#ca.bowlerAvgWktsOpposition("abowler3.csv","A Bowler3")

31 Wickets taken moving average

import cricpy.analytics as ca
#ca.bowlerMovingAverage("abowler1.csv","A Bowler1")
#ca.bowlerMovingAverage("abowler2.csv","A Bowler2")
#ca.bowlerMovingAverage("abowler3.csv","A Bowler3")

32 Cumulative average wickets taken

The plots below give the cumulative average wickets taken by the bowlers.

import cricpy.analytics as ca
#ca.bowlerCumulativeAvgWickets("abowler1.csv","A Bowler1")
#ca.bowlerCumulativeAvgWickets("abowler2.csv","A Bowler2")
#ca.bowlerCumulativeAvgWickets("abowler3.csv","A Bowler3")

33 Cumulative average economy rate

The plots below give the cumulative average economy rate of the bowlers.

import cricpy.analytics as ca
#ca.bowlerCumulativeAvgEconRate("abowler1.csv","A Bowler1")
#ca.bowlerCumulativeAvgEconRate("abowler2.csv","A Bowler2")
#ca.bowlerCumulativeAvgEconRate("abowler3.csv","A Bowler3")

34 Future Wickets forecast

import cricpy.analytics as ca
#ca.bowlerPerfForecast("abowler1.csv","A bowler1")

35 Get player data special

import cricpy.analytics as ca
#abowler1sp =ca.getPlayerDataSp(profile1,tdir=".",tfile="abowler1sp.csv",ttype="bowling")
#abowler2sp =ca.getPlayerDataSp(profile2,tdir=".",tfile="abowler2sp.csv",ttype="bowling")
#abowler3sp =ca.getPlayerDataSp(profile3,tdir=".",tfile="abowler3sp.csv",ttype="bowling")

36 Contribution to matches won and lost

Note:This can be done only for Test cricketers

import cricpy.analytics as ca
#ca.bowlerContributionWonLost("abowler1sp.csv","A Bowler1")
#ca.bowlerContributionWonLost("abowler2sp.csv","A Bowler2")
#ca.bowlerContributionWonLost("abowler3sp.csv","A Bowler3")

37 Performance home and overseas

Note:This can be done only for Test cricketers

import cricpy.analytics as ca
#ca.bowlerPerfHomeAway("abowler1sp.csv","A Bowler1")
#ca.bowlerPerfHomeAway("abowler2sp.csv","A Bowler2")
#ca.bowlerPerfHomeAway("abowler3sp.csv","A Bowler3")

38 Relative cumulative average economy rate of bowlers

import cricpy.analytics as ca
frames = ["abowler1.csv","abowler2.csv","abowler3.csv"]
names = ["A Bowler1","A Bowler2","A Bowler3"]
#ca.relativeBowlerCumulativeAvgEconRate(frames,names)

39 Relative Economy Rate against wickets taken

import cricpy.analytics as ca
frames = ["abowler1.csv","abowler2.csv","abowler3.csv"]
names = ["A Bowler1","A Bowler2","A Bowler3"]
#ca.relativeBowlingER(frames,names)

40 Relative cumulative average wickets of bowlers in career

import cricpy.analytics as ca
frames = ["abowler1.csv","abowler2.csv","abowler3.csv"]
names = ["A Bowler1","A Bowler2","A Bowler3"]
#ca.relativeBowlerCumulativeAvgWickets(frames,names)

Clone/download this cricpy template for your own analysis of players. This can be done using RStudio or IPython notebooks from Github at cricpy-template

Important note: Do check out my other posts using cricpy at cricpy-posts

Key Findings

Analysis of Top 4 batsman

Analysis of Top 3 bowlers

You may also like
1. My book ‘Deep Learning from first principles:Second Edition’ now on Amazon
2. Presentation on ‘Evolution to LTE’
3. Stacks of protocol stacks – A primer
4. Taking baby steps in Lisp
5. Introducing cricket package yorkr: Part 1- Beaten by sheer pace!

To see all posts click Index of posts

yorkr pads up for Twenty20s:Part 4- Individual batting and bowling performances!

Introduction

In theory, theory and practice are the same. In practice, they’re not.

                      Yogi Berra

There are two ways to write error-free programs; only the third one works.

                      Alan Perlis

Simplicity does not precede complexity, but follows it.

                      Alan Perlis

Talk is cheap. Show me the code.

                      Linus Torvalds

This post is the 4th and the last part of yorkr padding for the Twenty20s. In this post I look at the top individual batting and bowling performances in the Twenty20s. Also please take a look at my 3 earlier post on yorkr’s handling of Twenty20 matches

  1. yorkr pads up for the Twenty20s: Part 1- Analyzing team“s match performance.
  2. yorkr pads up for the Twenty20s: Part 2-Head to head confrontation between teams
  3. yorkr pads up for the Twenty20s:Part 3:Overall team performance against all oppositions!

The 1st part included functions dealing with a specific T20 match, the 2nd part dealt with functions between 2 opposing teams in T20 confrontations. The 3rd part dealt with functions between a team and all T20 matches with all oppositions. This 4th part includes individual batting and bowling performances in T20 matches and deals with Class 4 functions.

If you are passionate about cricket, and love analyzing cricket performances, then check out my 2 racy books on cricket! In my books, I perform detailed yet compact analysis of performances of both batsmen, bowlers besides evaluating team & match performances in Tests , ODIs, T20s & IPL. You can buy my books on cricket from Amazon at $12.99 for the paperback and $4.99/$6.99 respectively for the kindle versions. The books can be accessed at Cricket analytics with cricketr  and Beaten by sheer pace-Cricket analytics with yorkr  A must read for any cricket lover! Check it out!!

1


This post has also been published at RPubs yorkrT20-Part4 and can also be downloaded as a PDF document from yorkrT20-Part4.pdf.

You can clone/fork the code for the package yorkr from Github at yorkr-package

The list of Class 4 functions are shown below.The Twenty20 features will be available from yorkr_0.0.4

Checkout my interactive Shiny apps GooglyPlus (plots & tables) and Googly (only plots) which can be used to analyze IPL players, teams and matches.

Note: To do similar analysis you can use my yorkrT20templates. See my post Analysis of International T20 matches with yorkr templates

Important note 1: Do check out all the posts on the python avatar of yorkr, namely ‘yorkpy’ in my post ‘Pitching yorkpy … short of good length to IPL – Part 1

Batsman functions

  1. batsmanRunsVsDeliveries
  2. batsmanFoursSixes
  3. batsmanDismissals
  4. batsmanRunsVsStrikeRate
  5. batsmanMovingAverage
  6. batsmanCumulativeAverageRuns
  7. batsmanCumulativeStrikeRate
  8. batsmanRunsAgainstOpposition
  9. batsmanRunsVenue
  10. batsmanRunsPredict

Bowler functions

  1. bowlerMeanEconomyRate
  2. bowlerMeanRunsConceded
  3. bowlerMovingAverage
  4. bowlerCumulativeAvgWickets
  5. bowlerCumulativeAvgEconRate
  6. bowlerWicketPlot
  7. bowlerWicketsAgainstOpposition
  8. bowlerWicketsVenue
  9. bowlerWktsPredict

Note: The yorkr package in its current avatar only supports ODI & Twenty20 matches. I will be upgrading the package to handle IPL in the months to come.

library(yorkr)
library(gridExtra)
library(rpart.plot)
library(dplyr)
library(ggplot2)
rm(list=ls())

A. Batsman functions

1. Get Team Batting details

The function below gets the overall team batting details based on the RData file available in T20 matches. This is currently also available in Github at [yorkrData] (https://github.com/tvganesh/yorkrData/tree/master/Twenty20/T20-matches). The batting details of the team in each match is created and a huge data frame is created by rbinding the individual dataframes. This can be saved as a RData file

setwd("C:/software/cricket-package/york-test/yorkrData/Twenty20/T20-matches")
india_details <- getTeamBattingDetails("India",dir=".", save=TRUE)
sa_details <- getTeamBattingDetails("South Africa",dir=".",save=TRUE)
nz_details <- getTeamBattingDetails("New Zealand",dir=".",save=TRUE)
eng_details <- getTeamBattingDetails("England",dir=".",save=TRUE)
pak_details <- getTeamBattingDetails("Pakistan",dir=".",save=TRUE)
aus_details <- getTeamBattingDetails("Australia",dir=".",save=TRUE)
wi_details <- getTeamBattingDetails("West Indies",dir=".",save=TRUE)

2. Get batsman details

This function is used to get the individual T20 batting record for a the specified batsman of the country as in the functions below. For analyzing the batting performances the top T20 batsmen from different countries have been chosen. The batting scorecard functions from yorkr pads up for the Twenty20s:Part 3:Overall team performance against all oppositions! was used for selecting these batsmen

  1. Virat Kohli (Ind)
  2. DA Warner (Aus)
  3. Umar Akmal (Pak)
  4. BB McCullum (NZ)
  5. EJG Morgan (Eng)
  6. CH Gayle (WI)
setwd("C:/software/cricket-package/cricsheet/cleanup/T20/rmd/part4")
kohli <- getBatsmanDetails(team="India",name="Kohli",dir=".")
## [1] "./India-BattingDetails.RData"
warner <- getBatsmanDetails(team="Australia",name="DA Warner")
## [1] "./Australia-BattingDetails.RData"
akmal <-  getBatsmanDetails(team="Pakistan",name="Umar Akmal",dir=".")
## [1] "./Pakistan-BattingDetails.RData"
mccullum <-  getBatsmanDetails(team="New Zealand",name="BB McCullum",dir=".")
## [1] "./New Zealand-BattingDetails.RData"
emorgan <-  getBatsmanDetails(team="England",name="EJG Morgan",dir=".")
## [1] "./England-BattingDetails.RData"
gayle <-  getBatsmanDetails(team="West Indies",name="CH Gayle",dir=".")
## [1] "./West Indies-BattingDetails.RData"

3. Runs versus deliveries

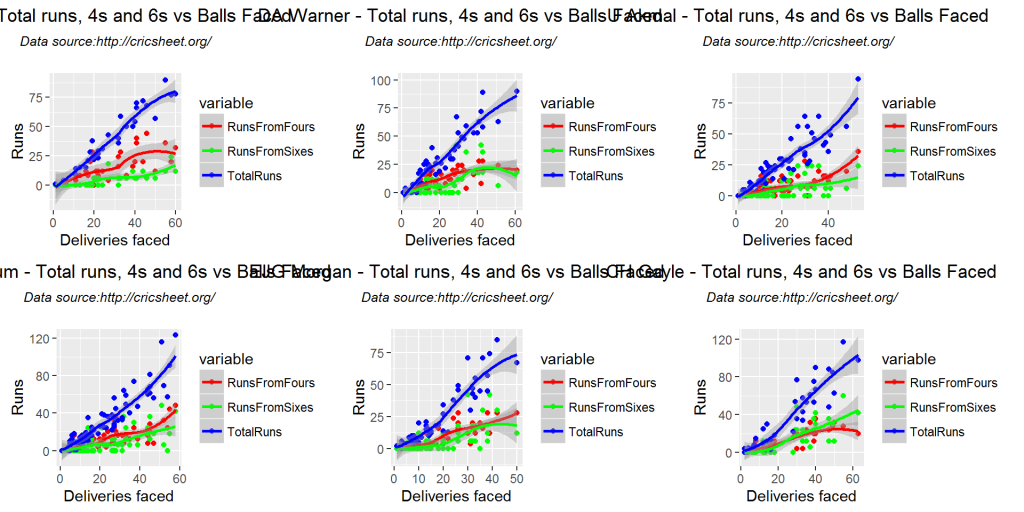
Chris Gayle and B McCullum have an astounding strike rate and touch close to 120 runs in 60 balls. David Warner also has a great strike rate

p1 <-batsmanRunsVsDeliveries(kohli,"Kohli")
p2 <-batsmanRunsVsDeliveries(warner, "DA Warner")
p3 <-batsmanRunsVsDeliveries(akmal,"U Akmal")
p4 <-batsmanRunsVsDeliveries(mccullum,"BB McCullum")
p5 <-batsmanRunsVsDeliveries(emorgan,"EJG Morgan")
p6 <-batsmanRunsVsDeliveries(gayle,"CH Gayle")
grid.arrange(p1,p2,p3,p4,p5,p6, ncol=3)

runsVsDeliveries-1

4. Batsman Total runs, Fours and Sixes

The plots below show the total runs, fours and sixes by the batsmen. Gayle tops in the runs from sixes

kohli46 <- select(kohli,batsman,ballsPlayed,fours,sixes,runs)
p1 <- batsmanFoursSixes(kohli46,"Kohli")
warner46 <- select(warner,batsman,ballsPlayed,fours,sixes,runs)
p2 <- batsmanFoursSixes(warner46,"DA Warner")
akmal46 <- select(akmal,batsman,ballsPlayed,fours,sixes,runs)
p3 <- batsmanFoursSixes(akmal46, "U Akmal")
mccullum46 <- select(mccullum,batsman,ballsPlayed,fours,sixes,runs)
p4 <- batsmanFoursSixes(mccullum46,"BB McCullum")
emorgan46 <- select(emorgan,batsman,ballsPlayed,fours,sixes,runs)
p5 <- batsmanFoursSixes(emorgan46,"EJG Morgan")
gayle46 <- select(gayle,batsman,ballsPlayed,fours,sixes,runs)
p6 <- batsmanFoursSixes(gayle46,"CH Gayle")
grid.arrange(p1,p2,p3,p4,p5,p6, ncol=3)

foursSixes-1

5. Batsman dismissals

The type of dismissal for each batsman is shown below

p1 <-batsmanDismissals(kohli,"Kohli")
p2 <-batsmanDismissals(warner, "DA Warner")
p3 <-batsmanDismissals(akmal,"U Akmal")
p4 <-batsmanDismissals(mccullum,"BB McCullum")
p5 <-batsmanDismissals(emorgan,"EJG Morgan")
p6 <-batsmanDismissals(gayle,"CH Gayle")
grid.arrange(p1,p2,p3,p4,p5,p6, ncol=3)

dismissal-1

6. Runs versus Strike Rate

Gayle’s and McCullum’s strike rate touch 120% for runs in the range of 130-150

p1 <-batsmanRunsVsStrikeRate(kohli,"Kohli")
p2 <-batsmanRunsVsStrikeRate(warner, "DA Warner")
p3 <-batsmanRunsVsStrikeRate(akmal,"U Akmal")
p4 <-batsmanRunsVsStrikeRate(mccullum,"BB McCullum")
p5 <-batsmanRunsVsStrikeRate(emorgan,"EJG Morgan")
p6 <-batsmanRunsVsStrikeRate(gayle,"CH Gayle")
grid.arrange(p1,p2,p3,p4,p5,p6, ncol=3)

runsSR-1

7. Batsman moving average

Kohli and Gayle T20 average is on the increase touching 50. Eoin Morgan and BB McCullum average around 40.

p1 <-batsmanMovingAverage(kohli,"Kohli")
p2 <-batsmanMovingAverage(warner, "DA Warner")
p3 <-batsmanMovingAverage(akmal,"U Akmal")
p4 <-batsmanMovingAverage(mccullum,"BB McCullum")
p5 <-batsmanMovingAverage(emorgan,"EJG Morgan")
p6 <-batsmanMovingAverage(gayle,"CH Gayle")
grid.arrange(p1,p2,p3,p4,p5,p6, ncol=3)

ma-1

8. Batsman cumulative average

Kohli’s cumulative average steadies around 40, McCullum shows a gentle decline from 40+ to 35+. Gayle oscillates between 30+ to 40-.

p1 <-batsmanCumulativeAverageRuns(kohli,"Kohli")
p2 <-batsmanCumulativeAverageRuns(warner, "DA Warner")
p3 <-batsmanCumulativeAverageRuns(akmal,"U Akmal")
p4 <-batsmanCumulativeAverageRuns(mccullum,"BB McCullum")
p5 <-batsmanCumulativeAverageRuns(emorgan,"EJG Morgan")
p6 <-batsmanCumulativeAverageRuns(gayle,"CH Gayle")
grid.arrange(p1,p2,p3,p4,p5,p6, ncol=3)

cAvg-1

9. Cumulative Average Strike Rate

BB McCullum has the best overall cumulative strike rate which hovered around the 150 and steadies around 130. Gayle has a rocky cumulative strike between 150 -130s. Warner is steady around 120.

p1 <-batsmanCumulativeStrikeRate(kohli,"Kohli")
p2 <-batsmanCumulativeStrikeRate(warner, "DA Warner")
p3 <-batsmanCumulativeStrikeRate(akmal,"U Akmal")
p4 <-batsmanCumulativeStrikeRate(mccullum,"BB McCullum")
p5 <-batsmanCumulativeStrikeRate(emorgan,"EJG Morgan")
p6 <-batsmanCumulativeStrikeRate(gayle,"CH Gayle")
grid.arrange(p1,p2,p3,p4,p5,p6, ncol=3)

cSR-1

10. Batsman runs against opposition

#Kohli's best performances are against New Zealand and Sri Lanka
batsmanRunsAgainstOpposition(kohli,"Kohli")

runsOppn1-1

batsmanRunsAgainstOpposition(warner, "DA Warner")

runsOppn2-1

batsmanRunsAgainstOpposition(akmal,"U Akmal")

runsOppn3-1

batsmanRunsAgainstOpposition(mccullum,"BB McCullum")

runsOppn4-1

batsmanRunsAgainstOpposition(emorgan,"EJG Morgan")

runsOppn5-1

# Gayle's best performance is against India and South Africa
batsmanRunsAgainstOpposition(gayle,"CH Gayle")

runsOppn6-1

11. Runs at different venues

The plots below give the performances of the batsmen at different grounds.

batsmanRunsVenue(kohli,"Kohli")

runsVenue1-1

batsmanRunsVenue(warner, "DA Warner")

runsVenue2-1

batsmanRunsVenue(akmal,"U Akmal")

runsVenue3-1

batsmanRunsVenue(mccullum,"BB McCullum")

runsVenue4-1

batsmanRunsVenue(emorgan,"EJG Morgan")

runsVenue5-1

batsmanRunsVenue(gayle,"CH Gayle")

runsVenue6-1

12. Predict number of runs to deliveries

The plots below use rpart classification tree to predict the number of deliveries required to score the runs in the leaf node. For e.g. Kohli takes

par(mfrow=c(1,3))
par(mar=c(4,4,2,2))
batsmanRunsPredict(kohli,"Kohli")
batsmanRunsPredict(warner, "DA Warner")
batsmanRunsPredict(akmal,"U Akmal")

runsPredict1,runsVenue1-1

# BB McCullum needs >32 deliveries to score 69+ runs while Gayle needs >28 deliveries to score 67 runs
par(mfrow=c(1,3))
par(mar=c(4,4,2,2))
batsmanRunsPredict(mccullum,"BB McCullum")
batsmanRunsPredict(emorgan,"EJG Morgan")
batsmanRunsPredict(gayle,"CH Gayle")

runsPredict2,runsVenue1-1

B. Bowler functions

13. Get bowling details

The function below gets the overall team T20 bowling details based on the RData file available in T20 matches. This is currently also available in Github at [yorkrData] (https://github.com/tvganesh/yorkrData/tree/master/Twenty20/T20-matches). The T20 bowling details of the team in each match is created and a huge data frame is created by rbinding the individual dataframes. This can be saved as a RData file

setwd("C:/software/cricket-package/york-test/yorkrData/Twenty20/T20-matches")
ind_bowling <- getTeamBowlingDetails("India",dir=".",save=TRUE)
dim(ind_bowling)
## [1] 872  12
aus_bowling <- getTeamBowlingDetails("Australia",dir=".",save=TRUE)
dim(aus_bowling)
## [1] 1364   12
eng_bowling <- getTeamBowlingDetails("England",dir=".",save=TRUE)
dim(eng_bowling)
## [1] 1183   12
sa_bowling <- getTeamBowlingDetails("South Africa",dir=".",save=TRUE)
dim(sa_bowling)
## [1] 995  12
pak_bowling <- getTeamBowlingDetails("Pakistan",dir=".",save=TRUE)
dim(pak_bowling)
## [1] 1186   12
nz_bowling <- getTeamBowlingDetails("New Zealand",dir=".",save=TRUE)
dim(nz_bowling)
## [1] 1295   12

14. Get bowling details of the individual bowlers

This function is used to get the individual bowling record for a specified bowler of the country as in the functions below. For analyzing the bowling performances the following cricketers have been chosen

  1. Ravichander Ashwin (Ind)
  2. SR Watson (Aus)
  3. SCJ Broad (Eng)
  4. Saeed Ajmal (Pak)
  5. Dale Steyn (SA)
  6. NL McCullum (NZ)
ashwin <- getBowlerWicketDetails(team="India",name="Ashwin",dir=".")
watson <-  getBowlerWicketDetails(team="Australia",name="SR Watson",dir=".")
broad <-  getBowlerWicketDetails(team="England",name="SCJ Broad",dir=".")
ajmal <-  getBowlerWicketDetails(team="Pakistan",name="Saeed Ajmal",dir=".")
steyn <-  getBowlerWicketDetails(team="South Africa",name="Steyn",dir=".")
nmccullum <-  getBowlerWicketDetails(team="New Zealand",name="NL McCullum",dir=".")

15. Bowler Mean Economy Rate

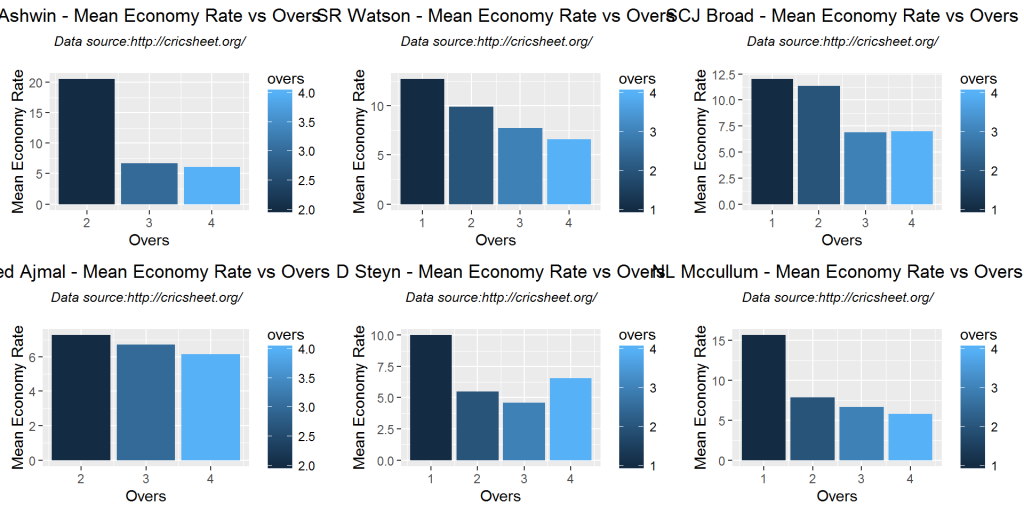
Ashwin has a mean economy rate of 5.0 for 3 & 4 overs. Saeed Ajmal is more expensive

p1<-bowlerMeanEconomyRate(ashwin,"R Ashwin")
p2<-bowlerMeanEconomyRate(watson, "SR Watson")
p3<-bowlerMeanEconomyRate(broad, "SCJ Broad")
p4<-bowlerMeanEconomyRate(ajmal, "Saeed Ajmal")
p5<-bowlerMeanEconomyRate(steyn, "D Steyn")
p6<-bowlerMeanEconomyRate(nmccullum, "NL Mccullum")
grid.arrange(p1,p2,p3,p4,p5,p6, ncol=3)

meanER-1

16. Bowler Mean Runs conceded

p1<-bowlerMeanRunsConceded(ashwin,"R Ashwin")
p2<-bowlerMeanRunsConceded(watson, "SR Watson")
p3<-bowlerMeanRunsConceded(broad, "SCJ Broad")
p4<-bowlerMeanRunsConceded(ajmal, "Saeed Ajmal")
p5<-bowlerMeanRunsConceded(steyn, "D Steyn")
p6<-bowlerMeanRunsConceded(nmccullum, "NL Mccullum")
grid.arrange(p1,p2,p3,p4,p5,p6, ncol=3)

meanRunsConceded-1

17. Bowler Moving average

Aswin, SCJ Broad and Steyn have an improving performance in T20s. NL McCullum has a drop and Ajmal’s performance is on the decline

p1<-bowlerMovingAverage(ashwin,"R Ashwin")
p2<-bowlerMovingAverage(watson, "SR Watson")
p3<-bowlerMovingAverage(broad, "SCJ Broad")
p4<-bowlerMovingAverage(ajmal, "Saeed Ajmal")
p5<-bowlerMovingAverage(steyn, "D Steyn")
p6<-bowlerMovingAverage(nmccullum, "NL Mccullum")
grid.arrange(p1,p2,p3,p4,p5,p6, ncol=3)

bowlerMA-1

17. Bowler cumulative average wickets

Interestingly Ajmal and NL McCullum have a cumulative average wickets of around 2.0. Steyn also has a cumulative average of 2.0+

p1<-bowlerCumulativeAvgWickets(ashwin,"R Ashwin")
p2<-bowlerCumulativeAvgWickets(watson, "SR Watson")
p3<-bowlerCumulativeAvgWickets(broad, "SCJ Broad")
p4<-bowlerCumulativeAvgWickets(ajmal, "Saeed Ajmal")
p5<-bowlerCumulativeAvgWickets(steyn, "D Steyn")
p6<-bowlerCumulativeAvgWickets(nmccullum, "NL Mccullum")
grid.arrange(p1,p2,p3,p4,p5,p6, ncol=3)

cumWkts-1

18. Bowler cumulative Economy Rate (ER)

Ajmal’s economy rate deteriorates from a excellent rate of 5.5, while Ashwin’s economy rate improves from a terrible rate of 9.0+.

p1<-bowlerCumulativeAvgEconRate(ashwin,"R Ashwin")
p2<-bowlerCumulativeAvgEconRate(watson, "SR Watson")
p3<-bowlerCumulativeAvgEconRate(broad, "SCJ Broad")
p4<-bowlerCumulativeAvgEconRate(ajmal, "Saeed Ajmal")
p5<-bowlerCumulativeAvgEconRate(steyn, "D Steyn")
p6<-bowlerCumulativeAvgEconRate(nmccullum, "NL Mccullum")
grid.arrange(p1,p2,p3,p4,p5,p6, ncol=3)

cumER-1

19. Bowler wicket plot

The plot below gives the average wickets versus number of overs

p1<-bowlerWicketPlot(ashwin,"R Ashwin")
p2<-bowlerWicketPlot(watson, "SR Watson")
p3<-bowlerWicketPlot(broad, "SCJ Broad")
p4<-bowlerWicketPlot(ajmal, "Saeed Ajmal")
p5<-bowlerWicketPlot(steyn, "D Steyn")
p6<-bowlerWicketPlot(nmccullum, "NL Mccullum")
grid.arrange(p1,p2,p3,p4,p5,p6, ncol=3)

wktPlot-1

20. Bowler wicket against opposition

#Ashwin's best pertformance are against South Africa,Sri Lanka, Bangaldesh and Afghanistan
bowlerWicketsAgainstOpposition(ashwin,"R Ashwin")

wktsOppn1-1

#Watson's bets pertformance are against England, Ireland and New Zealand
bowlerWicketsAgainstOpposition(watson, "SR Watson")

wktsOppn2-1

bowlerWicketsAgainstOpposition(broad, "SCJ Broad")

wktsOppn3-1

#Ajmal's best performances are against Sri Lanka, New Zealand and South Africa
bowlerWicketsAgainstOpposition(ajmal, "Saeed Ajmal")

wktsOppn4-1

#Steyn has good performances against New Zealand, Sri Lanka, Pakistan, West Indies
bowlerWicketsAgainstOpposition(steyn, "D Steyn")

wktsOppn5-1

bowlerWicketsAgainstOpposition(nmccullum, "NL Mccullum")

wktsOppn6-1

21. Bowler wicket at cricket grounds

bowlerWicketsVenue(ashwin,"R Ashwin")

wktsAve1-1

bowlerWicketsVenue(watson, "SR Watson")

wktsAve2-1

bowlerWicketsVenue(broad, "SCJ Broad")

wktsAve3-1

bowlerWicketsVenue(ajmal, "Saeed Ajmal")

wktsAve4-1

bowlerWicketsVenue(steyn, "D Steyn")

wktsAve5-1

bowlerWicketsVenue(nmccullum, "NL Mccullum")

wktsAve6-1

22. Get Delivery wickets for bowlers

This function creates a dataframe of deliveries and the wickets taken

setwd("C:/software/cricket-package/york-test/yorkrData/Twenty20/T20-matches")
ashwin1 <- getDeliveryWickets(team="India",dir=".",name="Ashwin",save=FALSE)
watson1 <- getDeliveryWickets(team="Australia",dir=".",name="SR Watson",save=FALSE)
broad1 <- getDeliveryWickets(team="England",dir=".",name="SCJ Broad",save=FALSE)
ajmal1 <- getDeliveryWickets(team="Pakistan",dir=".",name="Saeed Ajmal",save=FALSE)
steyn1 <- getDeliveryWickets(team="South Africa",dir=".",name="Steyn",save=FALSE)
nmccullum1 <- getDeliveryWickets(team="New Zealand",dir=".",name="NL McCullum",save=FALSE)

23. Predict number of deliveries to wickets

#Ashwin takes 
par(mfrow=c(1,2))
par(mar=c(4,4,2,2))
bowlerWktsPredict(ashwin1,"R Ashwin")
bowlerWktsPredict(watson1,"SR Watson")

wktsPred1-1

#Broad and Ajmal need around 8 deliveries for a wicket
par(mfrow=c(1,2))
par(mar=c(4,4,2,2))
bowlerWktsPredict(broad1,"SCJ Broad")
bowlerWktsPredict(ajmal1,"Saeed Ajmal")

wktsPred2-1

par(mfrow=c(1,2))
par(mar=c(4,4,2,2))
bowlerWktsPredict(steyn1,"D Steyn")
bowlerWktsPredict(nmccullum1,"NL Mccullum")

wktsPred3-1

Conclusion

This concludes the 4 part writeup of yorkr’s handling of Twenty20’s. I will be addding functionsto the ckage to handle IPL matches soon. You can fork/clone the code from Github at yorkr.

Hope you have a great time with my yorkr package!

Important note: Do check out my other posts using yorkr at yorkr-posts

Also see

  1. Introducing cricket package yorkr: Part 2-Trapped leg before wicket!
  2. Introducing cricket package yorkr: Part 3-Foxed by flight!
  3. Introducing cricketr! : An R package to analyze performances of cricketers
  4. Cricket analytics with cricketr in paperback and Kindle versions
  5. Bend it like Bluemix, MongoDB with auto-scaling – Part 3
  6. The dark side of the Internet
  7. Modeling a Car in Android
  8. Hand detection through haar-training: A hands-on approach
  9. Cricket analytics with cricketr

yorkr pads up for the Twenty20s: Part 2-Head to head confrontation between teams

Alice:“How long is forever”? White Rabbit:“Sometimes, just one second.”

Alice :“Where should I go?” The Cheshire Cat: “That depends on where you want to end up.”

“I’m not strange, weird, off, nor crazy, my reality is just different from yours.”

        Alice through the looking glass - Lewis Caroll

Introduction

In this post, my R package ‘yorkr’, continues to bat in the Twenty20s. This post is a continuation of my earlier post – yorkr pads up for the Twenty20s: Part 1- Analyzing team“s match performance. This post deals with Class 2 functions namely the performances of a team in all T20 matches against a single opposition for e.g all T20 matches of India-Australia, Pakistan-West Indies etc. You can clone/fork the code for my package yorkr from Github at yorkr

If you are passionate about cricket, and love analyzing cricket performances, then check out my 2 racy books on cricket! In my books, I perform detailed yet compact analysis of performances of both batsmen, bowlers besides evaluating team & match performances in Tests , ODIs, T20s & IPL. You can buy my books on cricket from Amazon at $12.99 for the paperback and $4.99/$6.99 respectively for the kindle versions. The books can be accessed at Cricket analytics with cricketr  and Beaten by sheer pace-Cricket analytics with yorkr  A must read for any cricket lover! Check it out!!

1

s), and $4.99/Rs 320 and $6.99/Rs448 respectively

This post has also been published at RPubs yorkrT20-Part2 and can also be downloaded as a PDF document from yorkrT20-Part2.pdf

Checkout my interactive Shiny apps GooglyPlus (plots & tables) and Googly (only plots) which can be used to analyze IPL players, teams and matches.

Note: To do similar analysis you can use my yorkrT20templates. See my post Analysis of International T20 matches with yorkr templates

Important note 1: Do check out all the posts on the python avatar of yorkr, namely ‘yorkpy’ in my post ‘Pitching yorkpy … short of good length to IPL – Part 1

The list of function in Class 2 are

  1. teamBatsmenPartnershiOppnAllMatches()
  2. teamBatsmenPartnershipOppnAllMatchesChart()
  3. teamBatsmenVsBowlersOppnAllMatches()
  4. teamBattingScorecardOppnAllMatches()
  5. teamBowlingPerfOppnAllMatches()
  6. teamBowlersWicketsOppnAllMatches()
  7. teamBowlersVsBatsmenOppnAllMatches()
  8. teamBowlersWicketKindOppnAllMatches()
  9. teamBowlersWicketRunsOppnAllMatches()
  10. plotWinLossBetweenTeams()

1. Install the package from CRAN

library(yorkr)
rm(list=ls())

2. Get data for all T20 matches between 2 teams

We can get all T20 matches between any 2 teams using the function below. The dir parameter should point to the folder which has the T20 RData files of the individual matches. This function creates a data frame of all the T20 matches and also saves the dataframe as RData. The function below gets all matches between India and Australia

setwd("C:/software/cricket-package/york-test/yorkrData/Twenty20/T20-matches")
matches <- getAllMatchesBetweenTeams("Australia","India",dir=".")
dim(matches)
## [1] 2829   25

I have however already saved the Twenty20 matches for all possible combination of opposing countries. The data for these matches for the individual teams/countries can be obtained from Github at in the folder T20-allmatches-between-two-teams

3. Save data for all matches between all combination of 2 teams

This can be done locally using the function below. You could use this function to combine all Twenty20 matches between any 2 teams into a single dataframe and save it in the current folder. The current implementation expectes that the the RData files of individual matches are in ../data folder. Since I already have converted this I will not be running this again

#saveAllMatchesBetweenTeams(dir=".",odir=".")

4. Load data directly for all matches between 2 teams

As in my earlier post I pick all Twenty20 matches between 2 random teams. I load the data directly from the stored RData files. When we load the Rdata file a “matches” object will be created. This object can be stored for the apporpriate teams as below

# Load T20 matches between teams
setwd("C:/software/cricket-package/york-test/yorkrData/Twenty20/T20-allmatches-between-two-teams")
load("India-Australia-allMatches.RData")
aus_ind_matches <- matches
dim(aus_ind_matches)
## [1] 2829   25
load("England-New Zealand-allMatches.RData")
eng_nz_matches <- matches
dim(eng_nz_matches)
## [1] 2760   25
load("Pakistan-South Africa-allMatches.RData")
pak_sa_matches <- matches
dim(pak_sa_matches)
## [1] 2308   25
load("Sri Lanka-West Indies-allMatches.RData")
sl_wi_matches <- matches
dim(sl_wi_matches)
## [1] 1909   25
load("Bangladesh-Ireland-allMatches.RData")
ban_ire_matches <-matches
dim(ban_ire_matches)
## [1] 479  25
load("Scotland-Canada-allMatches.RData")
sco_can_matches <-matches
dim(sco_can_matches)
## [1] 250  25
load("Netherlands-Afghanistan-allMatches.RData")
nl_afg_matches <- matches
dim(nl_afg_matches)
## [1] 927  25

5. Team Batsmen partnership in Twenty20 (all matches with opposition)

This function will create a report of the batting partnerships in the teams. The report can be brief or detailed depending on the parameter ‘report’. The top batsmen in India-Australia clashes are Shane Watson & AJ Finch from Australia and Virat Kohli & Yuvraj Singh of India.

m<- teamBatsmenPartnershiOppnAllMatches(aus_ind_matches,'Australia',report="summary")
m
## Source: local data frame [40 x 2]
## 
##         batsman totalRuns
##          (fctr)     (dbl)
## 1     SR Watson       284
## 2      AJ Finch       249
## 3     DA Warner       204
## 4       MS Wade       125
## 5     DJ Hussey       101
## 6     ML Hayden        79
## 7    RT Ponting        76
## 8     MJ Clarke        65
## 9     A Symonds        63
## 10 AC Gilchrist        59
## ..          ...       ...
m <-teamBatsmenPartnershiOppnAllMatches(aus_ind_matches,'India',report="summary")
m
## Source: local data frame [23 x 2]
## 
##         batsman totalRuns
##          (fctr)     (dbl)
## 1       V Kohli       319
## 2  Yuvraj Singh       262
## 3     RG Sharma       252
## 4      MS Dhoni       213
## 5     G Gambhir       198
## 6      SK Raina       160
## 7      S Dhawan       105
## 8    RV Uthappa        70
## 9     IK Pathan        57
## 10     V Sehwag        41
## ..          ...       ...
m <-teamBatsmenPartnershiOppnAllMatches(aus_ind_matches,'Australia',report="detailed")
m[1:30,]
##      batsman   nonStriker partnershipRuns totalRuns
## 1  SR Watson     AJ Finch              21       284
## 2  SR Watson   GJ Maxwell               3       284
## 3  SR Watson    DA Warner             127       284
## 4  SR Watson     SE Marsh              41       284
## 5  SR Watson      TM Head              63       284
## 6  SR Watson      CA Lynn              23       284
## 7  SR Watson   UT Khawaja               2       284
## 8  SR Watson  CT Bancroft               4       284
## 9   AJ Finch    BJ Haddin              15       249
## 10  AJ Finch NJ Maddinson              21       249
## 11  AJ Finch    SR Watson              25       249
## 12  AJ Finch   GJ Maxwell              12       249
## 13  AJ Finch MC Henriques              21       249
## 14  AJ Finch    DA Warner              44       249
## 15  AJ Finch    DJ Hussey              25       249
## 16  AJ Finch      MS Wade               1       249
## 17  AJ Finch     SE Marsh              66       249
## 18  AJ Finch    SPD Smith              16       249
## 19  AJ Finch      TM Head               0       249
## 20  AJ Finch      CA Lynn               3       249
## 21 DA Warner     AJ Finch              30       204
## 22 DA Warner    SR Watson             110       204
## 23 DA Warner   GJ Maxwell              11       204
## 24 DA Warner    DJ Hussey              22       204
## 25 DA Warner     CL White               6       204
## 26 DA Warner      MS Wade              25       204
## 27   MS Wade     AJ Finch               2       125
## 28   MS Wade  JP Faulkner               6       125
## 29   MS Wade    DA Warner              12       125
## 30   MS Wade    DJ Hussey              54       125
m <-teamBatsmenPartnershiOppnAllMatches(pak_sa_matches,'Pakistan',report="summary")
m
## Source: local data frame [24 x 2]
## 
##            batsman totalRuns
##             (fctr)     (dbl)
## 1       Umar Akmal       255
## 2  Mohammad Hafeez       205
## 3    Shahid Afridi       165
## 4    Ahmed Shehzad        85
## 5     Shoaib Malik        80
## 6    Nasir Jamshed        69
## 7    Misbah-ul-Haq        63
## 8     Kamran Akmal        62
## 9     Abdul Razzaq        62
## 10  Sohaib Maqsood        41
## ..             ...       ...
m <-teamBatsmenPartnershiOppnAllMatches(eng_nz_matches,'England',report="summary")
m
## Source: local data frame [35 x 2]
## 
##           batsman totalRuns
##            (fctr)     (dbl)
## 1       LJ Wright       273
## 2        AD Hales       194
## 3         MJ Lumb       188
## 4      EJG Morgan       152
## 5      JC Buttler       140
## 6    KP Pietersen       112
## 7         OA Shah        91
## 8  PD Collingwood        86
## 9         IR Bell        73
## 10        JE Root        68
## ..            ...       ...
m <-teamBatsmenPartnershiOppnAllMatches(sl_wi_matches,'Sri Lanka',report="summary")
m[1:20,]
## Source: local data frame [20 x 2]
## 
##             batsman totalRuns
##              (fctr)     (dbl)
## 1        TM Dilshan       334
## 2  DPMD Jayawardene       202
## 3     KC Sangakkara       135
## 4     ST Jayasuriya       111
## 5        AD Mathews        98
## 6       MDKJ Perera        78
## 7  DSNFG Jayasuriya        66
## 8   HDRL Thirimanne        48
## 9      LD Chandimal        41
## 10  KMDN Kulasekara        30
## 11        LPC Silva        18
## 12        J Mubarak        15
## 13  TAM Siriwardana        15
## 14    CK Kapugedera         8
## 15       SL Malinga         7
## 16       S Prasanna         6
## 17      BMAJ Mendis         3
## 18      NLTC Perera         3
## 19  SMSM Senanayake         3
## 20     PVD Chameera         3
m <- teamBatsmenPartnershiOppnAllMatches(ban_ire_matches,"Ireland",report="summary")
m
## Source: local data frame [11 x 2]
## 
##            batsman totalRuns
##             (fctr)     (dbl)
## 1        GC Wilson        51
## 2  WTS Porterfield        49
## 3       NJ O'Brien        48
## 4       KJ O'Brien        39
## 5        JF Mooney        18
## 6      MC Sorensen        12
## 7         EC Joyce        11
## 8      DT Johnston         7
## 9      PR Stirling         4
## 10         JP Bray         2
## 11       AR Cusack         1

6. Team batsmen partnership in Twenty20 (all matches with opposition)

This is plotted graphically in the charts below. Kohli & Yuvraj top the list for India.

teamBatsmenPartnershipOppnAllMatchesChart(aus_ind_matches,"India","Australia")

teamBatsmenPartnership-1

teamBatsmenPartnershipOppnAllMatchesChart(pak_sa_matches,main="South Africa",opposition="Pakistan")

teamBatsmenPartnership-2

m<- teamBatsmenPartnershipOppnAllMatchesChart(eng_nz_matches,"New Zealand",opposition="England",plot=FALSE)
m[1:30,]
##          batsman    nonStriker runs
## 1  HD Rutherford    MJ Guptill   69
## 2  HD Rutherford   BB McCullum   61
## 3    BB McCullum    MJ Guptill   53
## 4     MJ Guptill HD Rutherford   52
## 5    BB McCullum KS Williamson   51
## 6    BB McCullum HD Rutherford   49
## 7    LRPL Taylor   BB McCullum   49
## 8    BB McCullum   LRPL Taylor   46
## 9     MJ Guptill   BB McCullum   41
## 10     SB Styris   CD McMillan   40
## 11   CD McMillan      JDP Oram   38
## 12  JEC Franklin   LRPL Taylor   33
## 13   LRPL Taylor KS Williamson   32
## 14 KS Williamson   LRPL Taylor   32
## 15     SB Styris   LRPL Taylor   31
## 16   LRPL Taylor     SB Styris   30
## 17   BB McCullum      JD Ryder   29
## 18      JDP Oram      JS Patel   28
## 19      JD Ryder   BB McCullum   27
## 20   BB McCullum  JEC Franklin   26
## 21      DR Flynn     SB Styris   22
## 22    TWM Latham   LRPL Taylor   22
## 23 KS Williamson    MJ Santner   21
## 24  JEC Franklin   NL McCullum   21
## 25       C Munro    MJ Guptill   21
## 26   LRPL Taylor        JM How   19
## 27   LRPL Taylor    MJ Guptill   19
## 28   CD McMillan     SB Styris   19
## 29    MJ Guptill  JEC Franklin   19
## 30   BB McCullum     SB Styris   18
teamBatsmenPartnershipOppnAllMatchesChart(sl_wi_matches,"Sri Lanka","West Indies")

teamBatsmenPartnership-3

teamBatsmenPartnershipOppnAllMatchesChart(ban_ire_matches,"Bangladesh","Ireland")

teamBatsmenPartnership-4

7. Team batsmen versus bowler in Twenty20 (all matches with opposition)

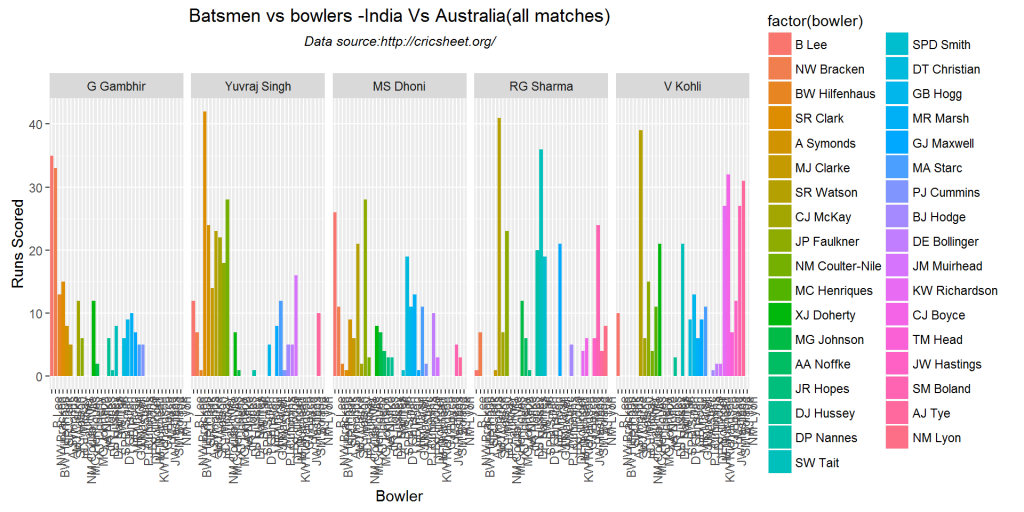
The plots below provide information on how each of the top batsmen fared against the opposition bowlers

teamBatsmenVsBowlersOppnAllMatches(aus_ind_matches,"India","Australia")

batsmenvsBowler-1

teamBatsmenVsBowlersOppnAllMatches(pak_sa_matches,"South Africa","Pakistan",top=3)

batsmenvsBowler-2

m <- teamBatsmenVsBowlersOppnAllMatches(eng_nz_matches,"England","New Zealnd",top=10,plot=FALSE)
m
## Source: local data frame [113 x 3]
## Groups: batsman [1]
## 
##      batsman       bowler  runs
##       (fctr)       (fctr) (dbl)
## 1  LJ Wright      SE Bond     1
## 2  LJ Wright MR Gillespie    17
## 3  LJ Wright     JDP Oram     4
## 4  LJ Wright    CS Martin    19
## 5  LJ Wright   DL Vettori    18
## 6  LJ Wright    SB Styris    14
## 7  LJ Wright     KD Mills    23
## 8  LJ Wright     MJ Mason     4
## 9  LJ Wright  NL McCullum    42
## 10 LJ Wright    IG Butler    15
## ..       ...          ...   ...
teamBatsmenVsBowlersOppnAllMatches(sl_wi_matches,"Sri Lanka","West Indies")

batsmenvsBowler-3

teamBatsmenVsBowlersOppnAllMatches(ban_ire_matches,"Bangladesh","Ireland")

batsmenvsBowler-4

8. Team batsmen versus bowler in Twenty20(all matches with opposition)

The following tables gives the overall performances of the country’s batsmen against the opposition. For India-Australia matches Virat Kohli, Yuvraj Singh and Rohit Sharma lead the way. For Australia it is Shane Watson, AJ Finch and DA Warner. In South Africa- Pakistan matches it is JP Duminy & De Kock respectively

a <-teamBattingScorecardOppnAllMatches(aus_ind_matches,main="India",opposition="Australia")
## Total= 1787
a
## Source: local data frame [23 x 5]
## 
##         batsman ballsPlayed fours sixes  runs
##          (fctr)       (int) (int) (int) (dbl)
## 1       V Kohli         225    27     7   319
## 2  Yuvraj Singh         151    21    18   262
## 3     RG Sharma         175    20    12   252
## 4      MS Dhoni         189    15     7   213
## 5     G Gambhir         174    25     1   198
## 6      SK Raina         117    17     3   160
## 7      S Dhawan          65    12     3   105
## 8    RV Uthappa          54     7     3    70
## 9     IK Pathan          58     2     1    57
## 10     V Sehwag          38     5     1    41
## ..          ...         ...   ...   ...   ...
teamBattingScorecardOppnAllMatches(aus_ind_matches,"Australia","India")
## Total= 1767
## Source: local data frame [40 x 5]
## 
##         batsman ballsPlayed fours sixes  runs
##          (fctr)       (int) (int) (int) (dbl)
## 1     SR Watson         173    16    20   284
## 2      AJ Finch         164    33     5   249
## 3     DA Warner         134    14    14   204
## 4       MS Wade          93     6     5   125
## 5     DJ Hussey          81     5     6   101
## 6     ML Hayden          63     5     6    79
## 7    RT Ponting          52    13    NA    76
## 8     MJ Clarke          54     3     1    65
## 9     A Symonds          43     4     2    63
## 10 AC Gilchrist          38     7     3    59
## ..          ...         ...   ...   ...   ...
teamBattingScorecardOppnAllMatches(pak_sa_matches,"South Africa","Pakistan")
## Total= 1265
## Source: local data frame [27 x 5]
## 
##           batsman ballsPlayed fours sixes  runs
##            (fctr)       (int) (int) (int) (dbl)
## 1       JP Duminy         178    14     7   214
## 2       Q de Kock         110    21     2   147
## 3         HM Amla         114    17     2   146
## 4  AB de Villiers         116    10     5   144
## 5    F du Plessis         121     6     4   129
## 6       JH Kallis          92     9     2    98
## 7       CA Ingram          55     8     3    77
## 8        GC Smith          78     9    NA    74
## 9       DA Miller          54     7     2    73
## 10  RK Kleinveldt           7     1     3    22
## ..            ...         ...   ...   ...   ...
teamBattingScorecardOppnAllMatches(sl_wi_matches,"West Indies","Sri Lanka")
## Total= 1017
## Source: local data frame [20 x 5]
## 
##          batsman ballsPlayed fours sixes  runs
##           (fctr)       (int) (int) (int) (dbl)
## 1       DJ Bravo         173    17     9   218
## 2     MN Samuels         132     9     8   157
## 3   ADS Fletcher          74    10     7   109
## 4       CH Gayle          91     9     2    76
## 5     KA Pollard          61     6     2    65
## 6      RR Sarwan          66     2    NA    61
## 7       D Ramdin          30     3     2    47
## 8      J Charles          51     3     3    46
## 9      DJG Sammy          34     4    NA    45
## 10    AD Russell          32    NA     4    44
## 11   LMP Simmons          29     5    NA    33
## 12     JE Taylor          23     2    NA    24
## 13     SP Narine          15     2     1    23
## 14 S Chanderpaul          28     1     1    19
## 15      DR Smith          14     1     1    17
## 16   XM Marshall          12     2    NA    14
## 17       SJ Benn           8     1    NA     6
## 18      D Bishoo           5     1    NA     6
## 19      WW Hinds           7     1    NA     5
## 20     JO Holder           4    NA    NA     2
teamBattingScorecardOppnAllMatches(eng_nz_matches,"England","New Zealand")
## Total= 1943
## Source: local data frame [35 x 5]
## 
##           batsman ballsPlayed fours sixes  runs
##            (fctr)       (int) (int) (int) (dbl)
## 1       LJ Wright         167    28    12   273
## 2        AD Hales         125    22     7   194
## 3         MJ Lumb         129    15    11   188
## 4      EJG Morgan         141    12     5   152
## 5      JC Buttler          83    16     5   140
## 6    KP Pietersen          83    13     2   112
## 7         OA Shah          68     6     4    91
## 8  PD Collingwood          61     6     4    86
## 9         IR Bell          60    11     1    73
## 10        JE Root          45     8     1    68
## ..            ...         ...   ...   ...   ...
teamBatsmenPartnershiOppnAllMatches(sco_can_matches,"Scotland","Canada")
## Source: local data frame [8 x 2]
## 
##         batsman totalRuns
##          (fctr)     (dbl)
## 1 RD Berrington        47
## 2    KJ Coetzer        22
## 3    JH Stander        21
## 4      DF Watts        18
## 5   R Flannigan        15
## 6    CS MacLeod         2
## 7        RM Haq         2
## 8    PL Mommsen         0

9. Team performances of bowlers (all matches with opposition)

Like the function above the following tables provide the top bowlers of the countries in the matches against the oppoition. In India-Australia matches RA Jadeja leads, in Pakistan-South Africa matches Saeed Ajmal tops and so on.

teamBowlingPerfOppnAllMatches(aus_ind_matches,"India","Australia")
## Source: local data frame [26 x 5]
## 
##             bowler overs maidens  runs wickets
##             (fctr) (int)   (int) (dbl)   (dbl)
## 1        RA Jadeja    13       0   219       8
## 2         R Ashwin    12       0   232       7
## 3        JJ Bumrah     5       0   103       6
## 4    R Vinay Kumar     6       0    79       6
## 5         R Sharma     5       0    56       5
## 6          A Nehra     9       0   127       4
## 7     Yuvraj Singh     5       0    72       4
## 8          B Kumar     5       0    42       4
## 9        IK Pathan     5       0   115       3
## 10 Harbhajan Singh     9       1    83       3
## ..             ...   ...     ...   ...     ...
teamBowlingPerfOppnAllMatches(pak_sa_matches,main="Pakistan",opposition="South Africa")
## Source: local data frame [17 x 5]
## 
##             bowler overs maidens  runs wickets
##             (fctr) (int)   (int) (dbl)   (dbl)
## 1      Saeed Ajmal     8       1   202      10
## 2  Mohammad Hafeez    10       0   178       9
## 3    Shahid Afridi    11       0   200       6
## 4         Umar Gul     3       0    93       6
## 5    Sohail Tanvir     6       0   103       3
## 6      Junaid Khan     4       0    75       3
## 7    Shoaib Akhtar     1       0    65       3
## 8    Mohammad Amir     1       0    63       2
## 9   Bilawal Bhatti     5       0    54       2
## 10    Abdur Rehman     1       0    53       2
## 11    Yasir Arafat     3       0    25       2
## 12    Abdul Razzaq     2       0    69       1
## 13  Mohammad Irfan     3       0    46       1
## 14       Anwar Ali     2       0    22       0
## 15    Shoaib Malik     3       0    17       0
## 16      Fawad Alam     1       0    15       0
## 17      Raza Hasan     3       1    12       0
teamBowlingPerfOppnAllMatches(eng_nz_matches,"New Zealand","England")
## Source: local data frame [26 x 5]
## 
##            bowler overs maidens  runs wickets
##            (fctr) (int)   (int) (dbl)   (dbl)
## 1        KD Mills     8       0   199       5
## 2  MJ McClenaghan    10       0   189       5
## 3      TG Southee    13       0   183       5
## 4      DL Vettori     1       0    91       5
## 5    JEC Franklin     2       0    53       5
## 6     NL McCullum     9       0   281       4
## 7       CS Martin     6       0   116       4
## 8         SE Bond     1       0    49       4
## 9       IG Butler     1       0    95       3
## 10      SB Styris     4       0    80       3
## ..            ...   ...     ...   ...     ...
teamBowlingPerfOppnAllMatches(sl_wi_matches,"Sri Lanka","West Indies")
## Source: local data frame [16 x 5]
## 
##              bowler overs maidens  runs wickets
##              (fctr) (int)   (int) (dbl)   (dbl)
## 1        BAW Mendis     8       1    82      10
## 2        SL Malinga     7       0   217       9
## 3        AD Mathews     7       0    87       6
## 4   TAM Siriwardana     4       0    58       5
## 5   SMSM Senanayake     4       0    90       4
## 6    M Muralitharan     1       0    76       4
## 7   KMDN Kulasekara     7       0   158       2
## 8      PVD Chameera     4       0    66       2
## 9           I Udana     1       0    56       1
## 10 DSNFG Jayasuriya     4       0    38       1
## 11      BMAJ Mendis     2       0    32       1
## 12      A Dananjaya     3       0    16       1
## 13       S Prasanna     1       0    15       1
## 14     HMRKB Herath     3       0    43       0
## 15    ST Jayasuriya     1       0    34       0
## 16      NLTC Perera     1       0    13       0

10. Team bowler’s wickets in Twenty20 (all matches with opposition)

This provided a graphical plot of the tables above

teamBowlersWicketsOppnAllMatches(aus_ind_matches,"India","Australia")

bowlerWicketsOppn-1

teamBowlersWicketsOppnAllMatches(aus_ind_matches,"Australia","India")

bowlerWicketsOppn-2

teamBowlersWicketsOppnAllMatches(pak_sa_matches,"South Africa","Pakistan",top=10)

bowlerWicketsOppn-3

m <-teamBowlersWicketsOppnAllMatches(eng_nz_matches,"England","Zealand",plot=FALSE)
m
## Source: local data frame [20 x 2]
## 
##            bowler wickets
##            (fctr)   (int)
## 1       SCJ Broad      12
## 2     JM Anderson       7
## 3     JW Dernbach       7
## 4        GP Swann       6
## 5       LJ Wright       5
## 6   RJ Sidebottom       4
## 7         ST Finn       4
## 8         MA Wood       4
## 9  AD Mascarenhas       3
## 10 PD Collingwood       3
## 11      DJ Willey       3
## 12       DL Maddy       2
## 13     TT Bresnan       2
## 14      BA Stokes       2
## 15    JC Tredwell       2
## 16     A Flintoff       1
## 17      DR Briggs       1
## 18      WB Rankin       1
## 19      AU Rashid       1
## 20        JE Root       1
teamBowlersWicketsOppnAllMatches(ban_ire_matches,"Bangladesh","Ireland",top=3)

bowlerWicketsOppn-4

11. Team bowler vs batsmen in Twenty20(all matches with opposition)

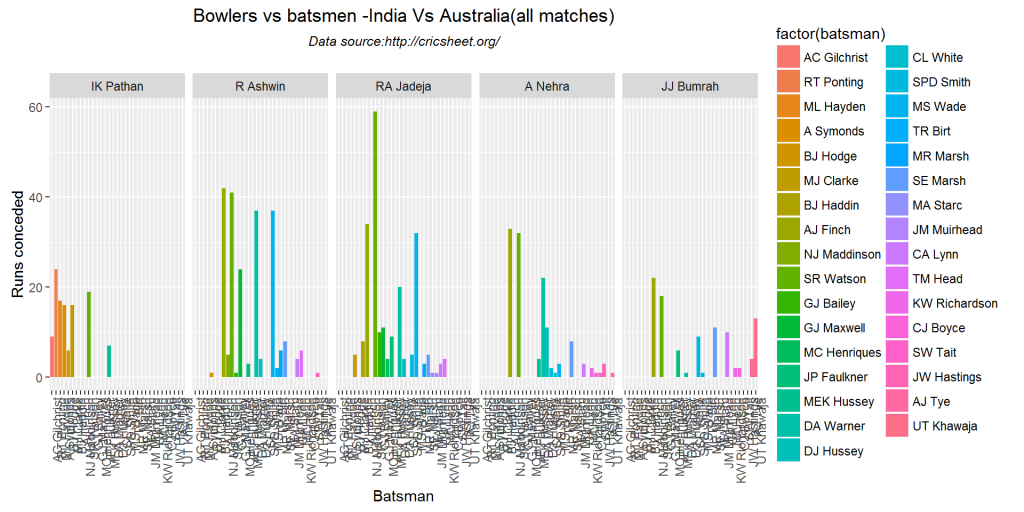
These plots show how the bowlers fared against the batsmen. It shows which of the opposing teams batsmen were able to score the most runs

teamBowlersVsBatsmenOppnAllMatches(aus_ind_matches,'India',"Australia",top=5)

bowlerVsBatsmen-1

teamBowlersVsBatsmenOppnAllMatches(pak_sa_matches,"Pakistan","South Africa",top=3)

bowlerVsBatsmen-2

teamBowlersVsBatsmenOppnAllMatches(eng_nz_matches,"England","New Zealand")

bowlerVsBatsmen-3

teamBowlersVsBatsmenOppnAllMatches(eng_nz_matches,"New Zealand","England")

bowlerVsBatsmen-4

12. Team bowler’s wicket kind in Twenty20(caught,bowled,etc) (all matches with opposition)

The charts below show the wicket kind taken by the bowler (caught, bowled, lbw etc)

teamBowlersWicketKindOppnAllMatches(aus_ind_matches,"India","Australia",plot=TRUE)

bowlerWickets-1

m <- teamBowlersWicketKindOppnAllMatches(aus_ind_matches,"Australia","India",plot=FALSE)
m[1:30,]
##             bowler wicketKind wicketPlayerOut runs
## 1            B Lee     caught        V Sehwag  133
## 2        MJ Clarke     caught      RV Uthappa   27
## 3    BW Hilfenhaus     caught       G Gambhir   28
## 4         CJ McKay     caught       RG Sharma   75
## 5  NM Coulter-Nile     caught        SK Raina   44
## 6       XJ Doherty    stumped        S Dhawan   76
## 7         CJ McKay     caught         V Kohli   75
## 8       MG Johnson     caught        V Sehwag   54
## 9       MG Johnson     caught       G Gambhir   54
## 10      MG Johnson    run out      RV Uthappa   54
## 11       MJ Clarke     caught    Yuvraj Singh   27
## 12      MG Johnson    run out        MS Dhoni   54
## 13           B Lee    run out        V Sehwag  133
## 14      NW Bracken     caught       G Gambhir   68
## 15           B Lee     bowled      KD Karthik  133
## 16      NW Bracken     caught      RV Uthappa   68
## 17        JR Hopes     bowled       RG Sharma   10
## 18       DJ Hussey     caught        MS Dhoni   24
## 19       AA Noffke     caught         P Kumar   23
## 20        AC Voges     caught Harbhajan Singh    5
## 21        AC Voges     caught     S Sreesanth    5
## 22      NW Bracken     caught       IK Pathan   68
## 23       DP Nannes     caught         M Vijay   25
## 24       DP Nannes     caught       G Gambhir   25
## 25         SW Tait     caught        SK Raina  112
## 26       DP Nannes     bowled    Yuvraj Singh   25
## 27       SPD Smith     caught        MS Dhoni   34
## 28      MG Johnson     caught       YK Pathan   54
## 29       SR Watson    run out       RA Jadeja  201
## 30       SR Watson     caught Harbhajan Singh  201
teamBowlersWicketKindOppnAllMatches(sl_wi_matches,"Sri Lanka",'West Indies',plot=TRUE)

bowlerWickets-2

13. Team bowler’s wicket taken and runs conceded in Twenty20(all matches with opposition)

teamBowlersWicketRunsOppnAllMatches(aus_ind_matches,"India","Australia")

wicketRuns-1

m <-teamBowlersWicketRunsOppnAllMatches(pak_sa_matches,"Pakistan","South Africa",plot=FALSE)
m[1:30,]
## Source: local data frame [30 x 5]
## 
##             bowler overs maidens  runs wickets
##             (fctr) (int)   (int) (dbl)   (dbl)
## 1     Abdul Razzaq     2       0    69       1
## 2    Mohammad Amir     1       0    63       2
## 3    Shahid Afridi    11       0   200       6
## 4      Saeed Ajmal     8       1   202      10
## 5     Shoaib Malik     3       0    17       0
## 6         Umar Gul     3       0    93       6
## 7       Fawad Alam     1       0    15       0
## 8     Abdur Rehman     1       0    53       2
## 9  Mohammad Hafeez    10       0   178       9
## 10   Shoaib Akhtar     1       0    65       3
## ..             ...   ...     ...   ...     ...

14. Plot of wins vs losses between teams in Twenty20.

setwd("C:/software/cricket-package/york-test/yorkrData/Twenty20/T20-matches")
plotWinLossBetweenTeams("India","Sri Lanka")

winsLosses-1

plotWinLossBetweenTeams('Pakistan',"South Africa",".")

winsLosses-2

plotWinLossBetweenTeams('England',"New Zealand",".")

winsLosses-3

plotWinLossBetweenTeams("Australia","West Indies",".")

winsLosses-4

plotWinLossBetweenTeams('Bangladesh',"Zimbabwe",".")

winsLosses-5

plotWinLossBetweenTeams('Scotland',"Ireland",".")

winsLosses-6

Conclusion

This post included all functions for all Twenty20 matches between any 2 opposing countries. As before the data frames are already available. You can load the data and begin to use them. If more insights from the dataframe are possible do go ahead. But please do attribute the source to Cricheet (http://cricsheet.org), my package yorkr and my blog. Do give the functions a spin for yourself!

Important note: Do check out my other posts using yorkr at yorkr-posts

You may also like

  1. Introducing cricket package yorkr-Part1:Beaten by sheer pace!
  2. Introducing cricket package yorkr: Part 2-Trapped leg before wicket!
  3. Introducing cricket package yorkr:Part 4-In the block hole!
  4. Introducing cricketr! : An R package to analyze performances of cricketers
  5. Cricket analytics with cricketr
  6. Experiments with deblurring using OpenCV
  7. Cloud Computing – Design Considerations
  8. A Cloud medley with IBM Bluemix, Cloudant DB and Node.js
  9. A short video tutorial on my R package cricketr