Published in R-bloggers: Sixer – R package cricketr’s new Shiny app
In this post I create a Shiny App, Sixer, based on my R package cricketr. I had developed the R package cricketr, a few months back for analyzing the performances of batsman and bowlers in all formats of the game (Test, ODI and Twenty 20). This package uses the statistics info available in ESPN Cricinfo Statsguru. I had written a series of posts using the cricketr package where I chose a few batsmen, bowlers and compared their performances of these players. Here I have created a complete Shiny app with a lot more players and with almost all the features of the cricketr package. The motivation for creating the Shiny app was to
- To show case the ‘cricketr’ package and to highlight its functionalities
- Perform analysis of more batsman and bowlers
- Allow users to interact with the package and to allow them to try out the different features and functions of the package and to also check performances of some of their favorite crickets
If you are passionate about cricket, and love analyzing cricket performances, then check out my racy book on cricket ‘Cricket analytics with cricketr and cricpy – Analytics harmony with R & Python’! This book discusses and shows how to use my R package ‘cricketr’ and my Python package ‘cricpy’ to analyze batsmen and bowlers in all formats of the game (Test, ODI and T20). The paperback is available on Amazon at $21.99 and the kindle version at $9.99/Rs 449/-. A must read for any cricket lover! Check it out!!

$4.99/Rs 320 and $6.99/Rs448 respectively
Important note 1: The latest release of ‘cricketr’ now includes the ability to analyze performances of teams now!! See Cricketr adds team analytics to its repertoire!!!
Important note 2 : Cricketr can now do a more fine-grained analysis of players, see Cricketr learns new tricks : Performs fine-grained analysis of players
Important note 3: Do check out the python avatar of cricketr, ‘cricpy’ in my post ‘Introducing cricpy:A python package to analyze performances of cricketers”
a) You can try out the interactive Shiny app Sixer at – Sixer
b) The code for this Shiny app project can be cloned/forked from GitHub – Sixer
Note: Please be mindful of ESPN Cricinfo Terms of Use.
(Take a look at my short video tutorial on my R package cricketr on Youtube – R package cricketr – A short tutorial)
Important note: Do check out my other posts using cricketr at cricketr-posts
In this Shiny app I have 5 tabs which perform the following function
1. Analyze Batsman
This tab analyzes batsmen based on different functions and plots the performances of the selected batsman. There are functions that compute and display batsman’s run-frequency ranges, Mean Strike rate, No of 4’s, dismissals, 3-D plot of Runs scored vs Balls Faced and Minutes at crease, Contribution to wins & losses, Home-Away record etc. The analyses can be done for Test cricketers, ODI and Twenty 20 batsman. I have included most of the Test batting giants including Tendulkar, Dravid, Sir Don Bradman, Viv Richards, Lara, Ponting etc. Similarly the ODI list includes Sehwag, Devilliers, Afridi, Maxwell etc. The Twenty20 list includes the Top 10 Twenty20 batsman based on their ICC rankings
2. Analyze bowler
This tab analyzes the bowling performances of bowlers, Wickets percentages, Mean Economy Rate, Wickets at different venues, Moving average of wickets etc. As earlier I have all the Top bowlers including Warne, Muralidharan, Kumble- the famed Indian spin quartet of Bedi, Chandrasekhar, Prasanna, Venkatraghavan, the deadly West Indies trio of Marshal, Roberts and Holding and the lethal combination of Imran Khan, Wasim Akram and Waqar Younis besides the dangerous Dennis Lillee and Jeff Thomson. Do give the functions a try and see for yourself the performances of these individual bowlers
3. Relative performances of batsman
This tab allows the selection of multiple batsmen (Test, ODI and Twenty 20) for comparisons. There are 2 main functions Relative Runs Frequency performance and Relative Mean Strike Rate
4. Relative performances of bowlers
Here we can compare bowling performances of multiple bowlers, which include functions Relative Bowling Performance and Relative Economy Rate. This can be done for Test, ODI and Twenty20 formats
5. Check for In-Form status of players
This tab checks the form status of batsman or bowler selected for all of the different formats of the game. The below computation uses Null Hypothesis testing and p-value to determine if the batsman is in-form or out-of-form. For this 90% of the career runs is chosen as the population and the mean computed. The last 10% is chosen to be the sample set and the sample Mean and the sample Standard Deviation are calculated. Note: The accuracy of the p-value test depends on the size of the population and the size of the sample set. It may not be very significant for players with a few innings played.
Some of my earlier posts based my R package cricketr are listed below
1. Introducing cricketr!: An R package for analyzing performances of cricketers
2. Taking cricketr for a spin – Part 1
3. cricketr plays the ODIs
4. cricketr adapts to the Twenty20 International
5. cricketr digs the Ashes
Do try out the interactive Sixer Shiny app – Sixer
You can clone the code from Github – Sixer
There is not much in way of explanation. The Shiny app’s use is self-explanatory. You can choose a match type ( Test,ODI or Twenty20), choose a batsman/bowler from the drop down list and select the plot you would like to seeHere a few sample plots
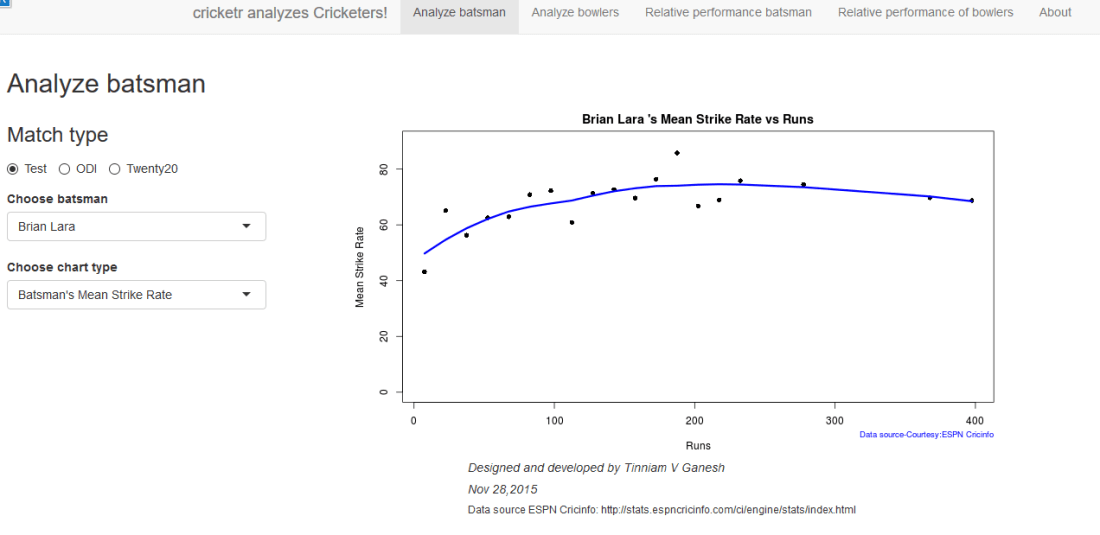
A. Analyze batsman tab
i) Batsman – Brian Lara , Match Type – Test, Function – Mean Strike Rate
 ii) Batsman – Shahid Afridi, Match Type – ODI, Function – Runs vs Balls faced
The plot below shows that if Afridi faces around 50 balls he is likely to score around 60 runs in ODIs.
 iii) Batsman – Chris Gayle, Match Type – Twenty20 Function – Moving Average
 B. Analyze bowler tab
i. Bowler – B S Chandrasekhar, Match Type – Test, Function – Wickets vs Runs
 ii) Bowler – Malcolm Marshall, Match Type – Test, Function – Mean Economy Rate
 iii) Bowler – Sunil Narine, Match Type – Twenty 20, Function – Bowler Wicket Rate

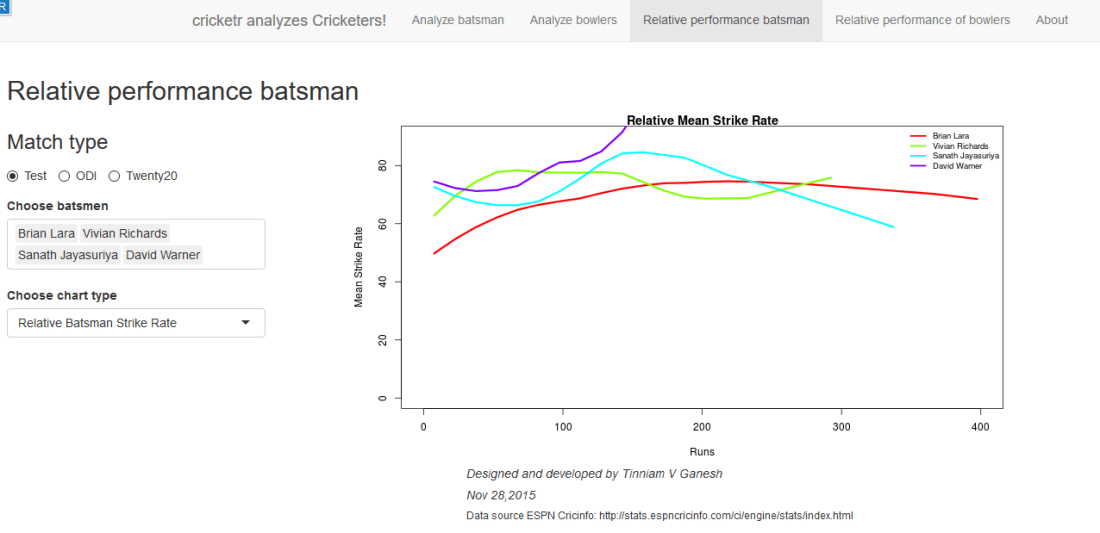
C. Relative performance of batsman (you can select more than 1)
The below plot gives the Mean Strike Rate of batsman. Viv Richards, Brian Lara, Sanath Jayasuriya and David Warner are best strikers of the ball.
Here are some of the great strikers of the ball in ODIs
 D. Relative performance of bowlers (you can select more than 1)
Finally a look at the famed Indian spin quartet. From the plot below it can be seen that B S Bedi & Venkatraghavan were more economical than Chandrasekhar and Prasanna.

But the latter have a better 4-5 wicket haul than the former two as seen in the plot below
 Finally a look at the average number of balls to take a wicket by the Top 4 Twenty 20 bowlers.

E. Check for In-form status of players
Note: The accuracy of the p-value depends on the size of the population and the size of the sample set. It may not be very significant for smaller data sizes
i. Match Type – Test, Player Type – Batsman Name – Wickets v
In this plot the in-form status of Viv Richards is checked. This shows that Viv Richards was out-of-form
 In the plot below the form status of S. Venkataraghavan is shown. According to this at the time of his retirement S Venkat was still in-form

Do give the Shiny app Sixer a try.
Also see
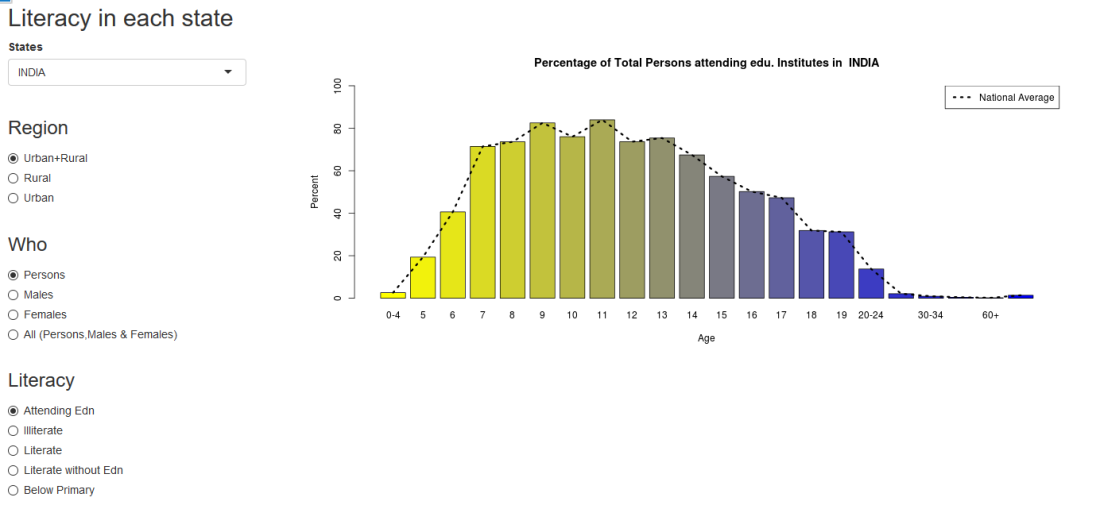
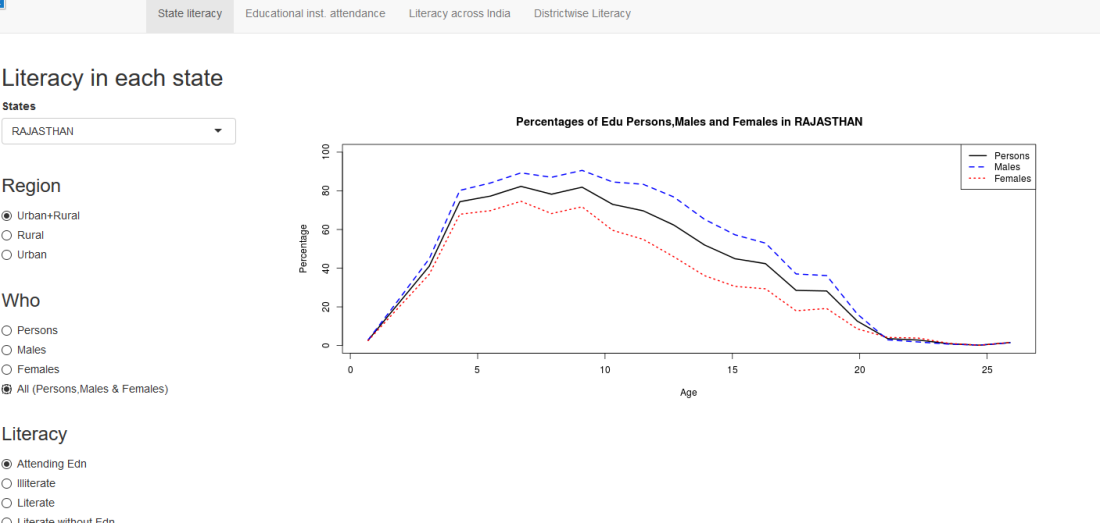
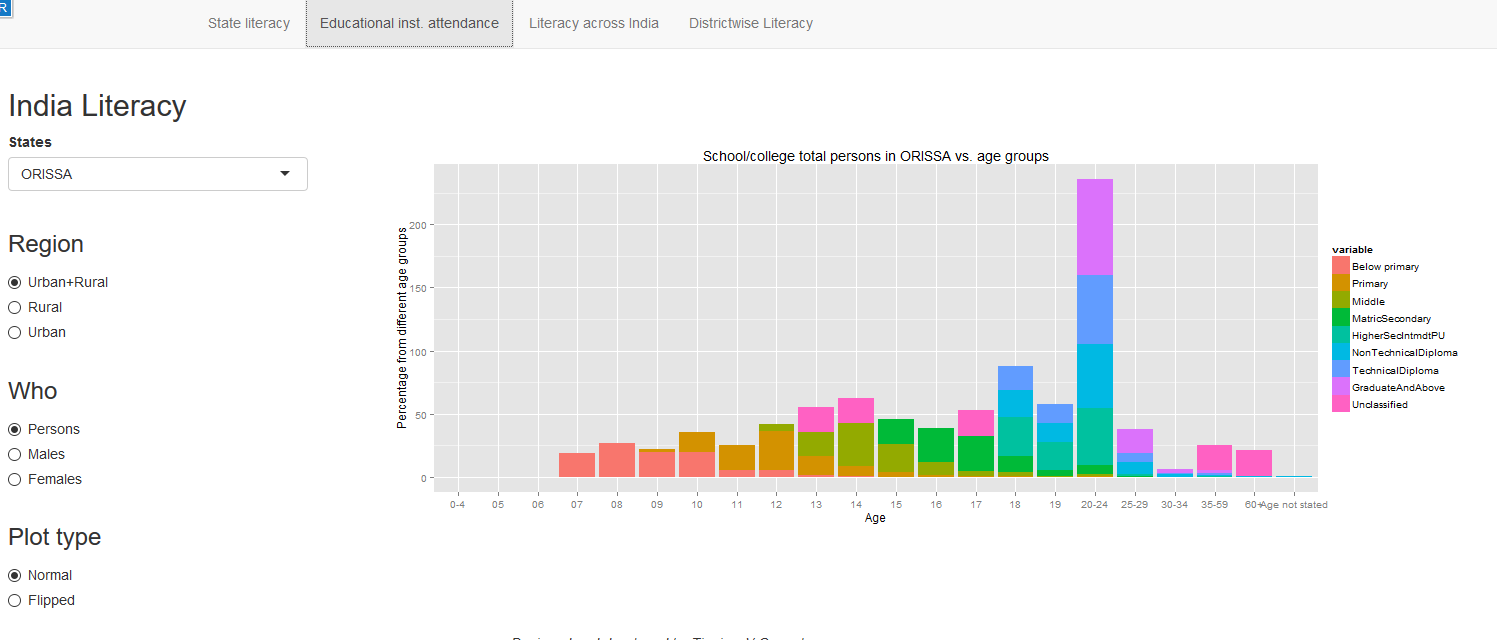
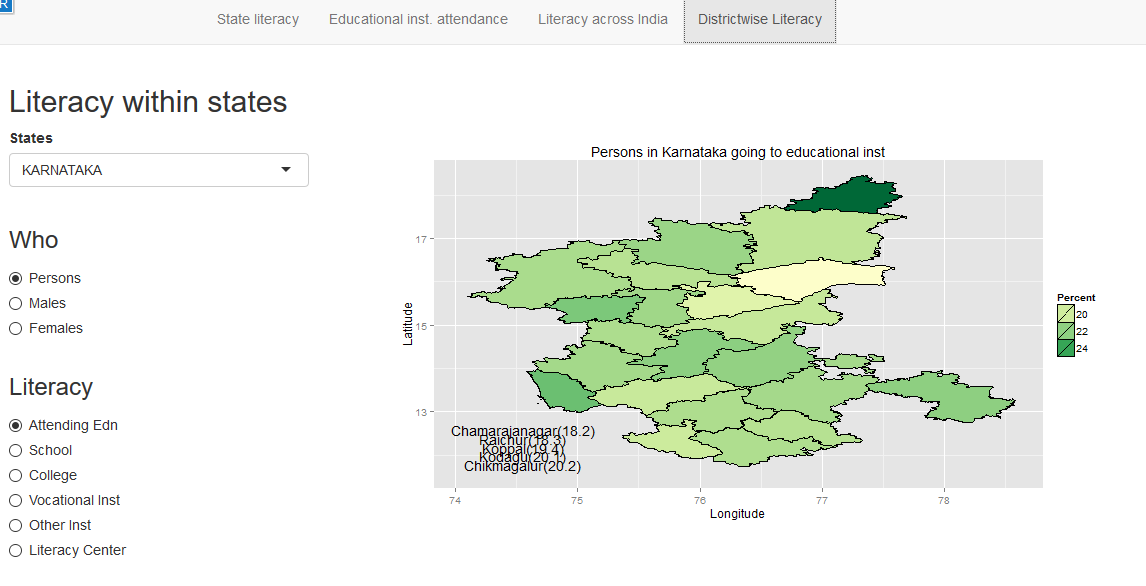
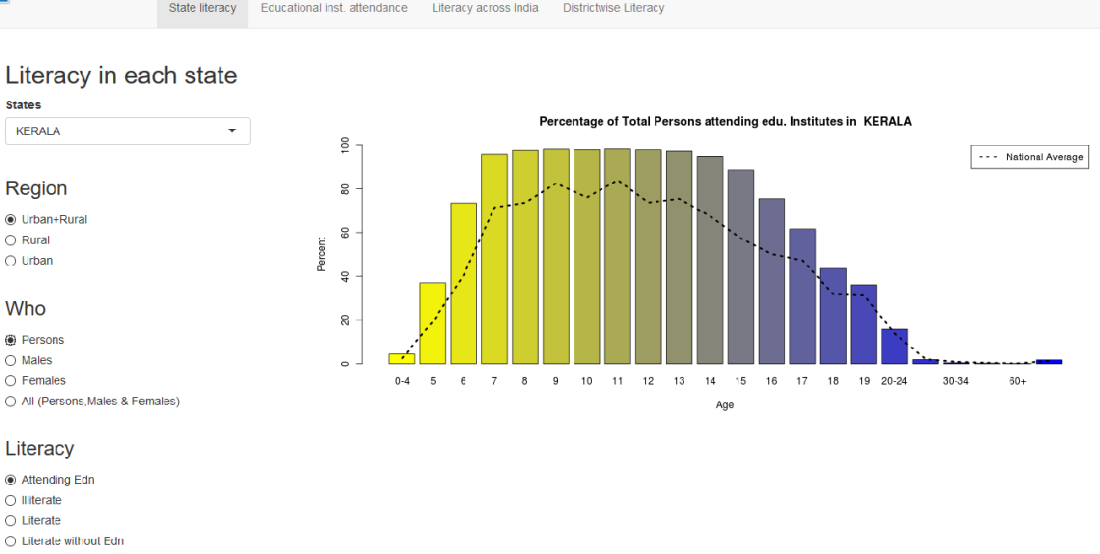
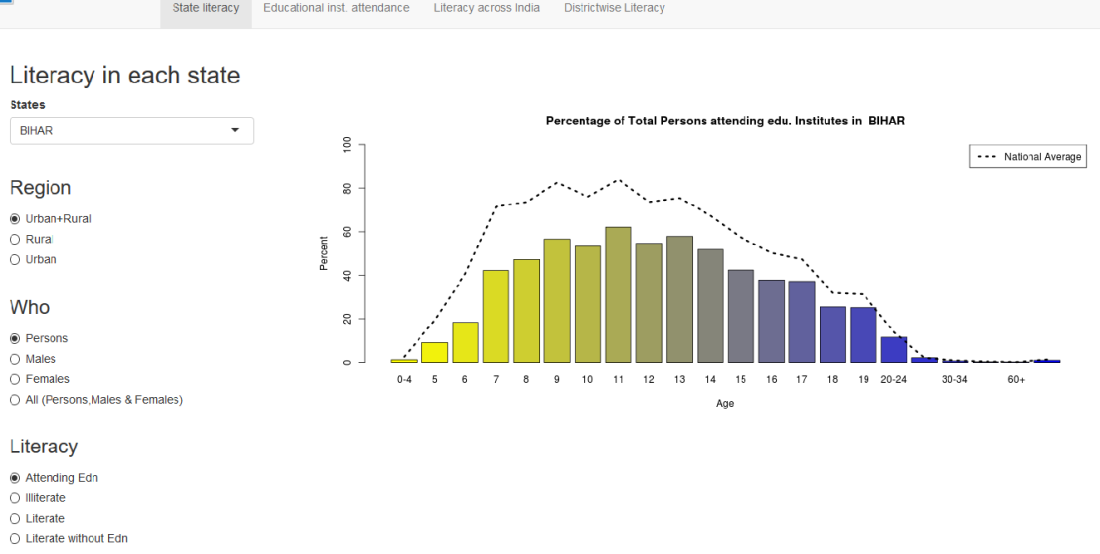
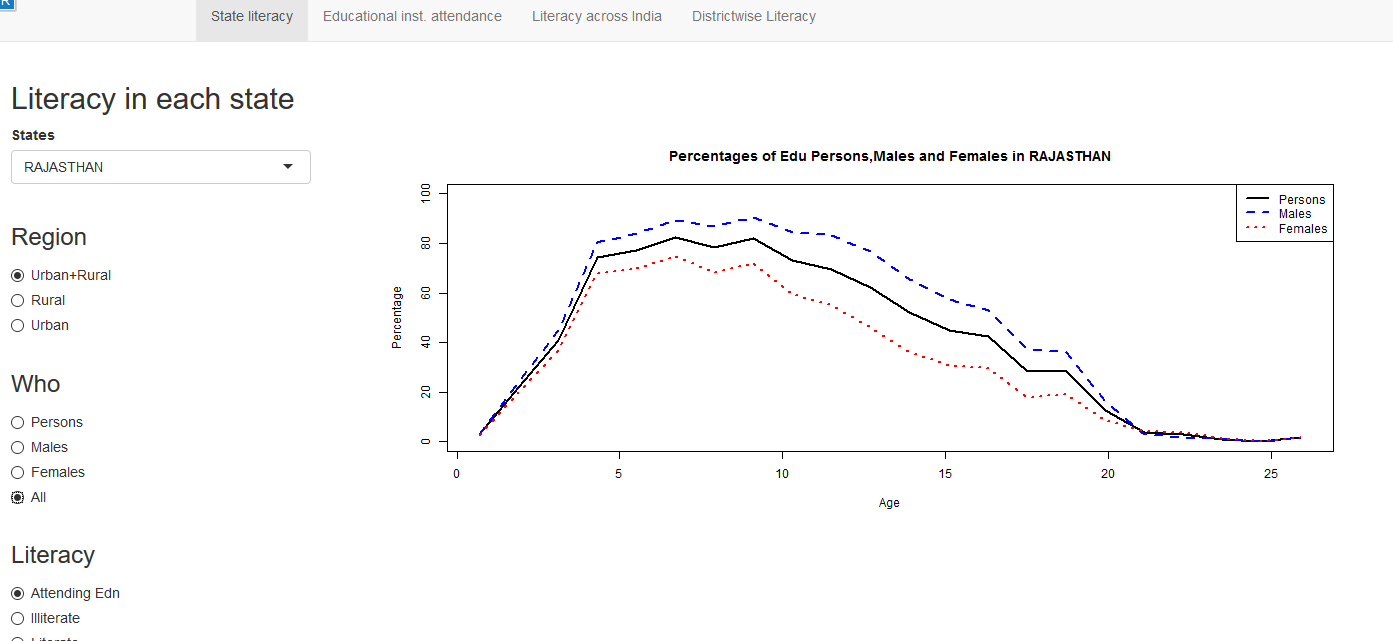
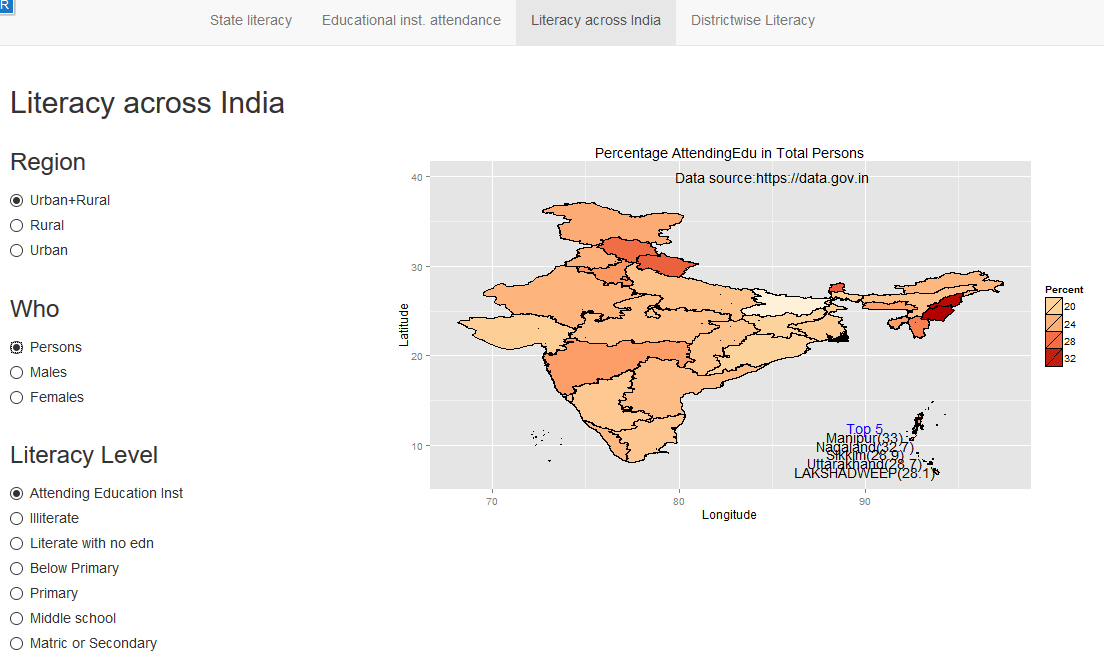
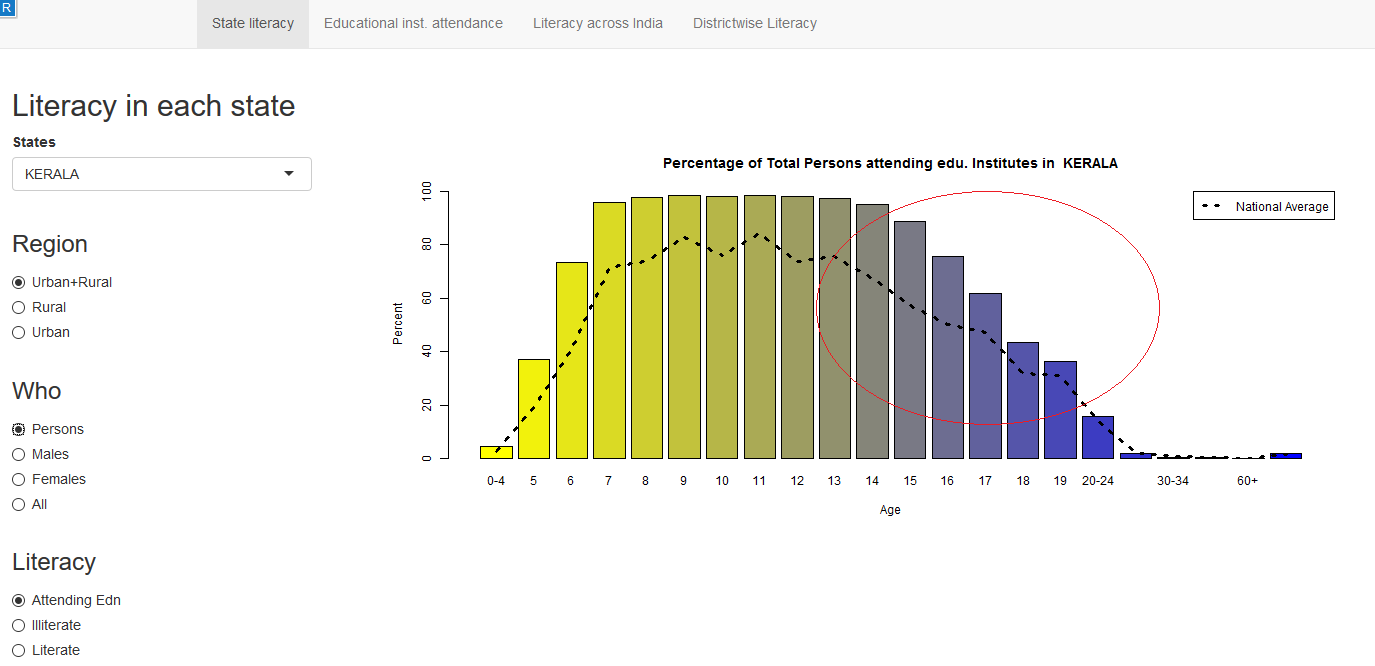
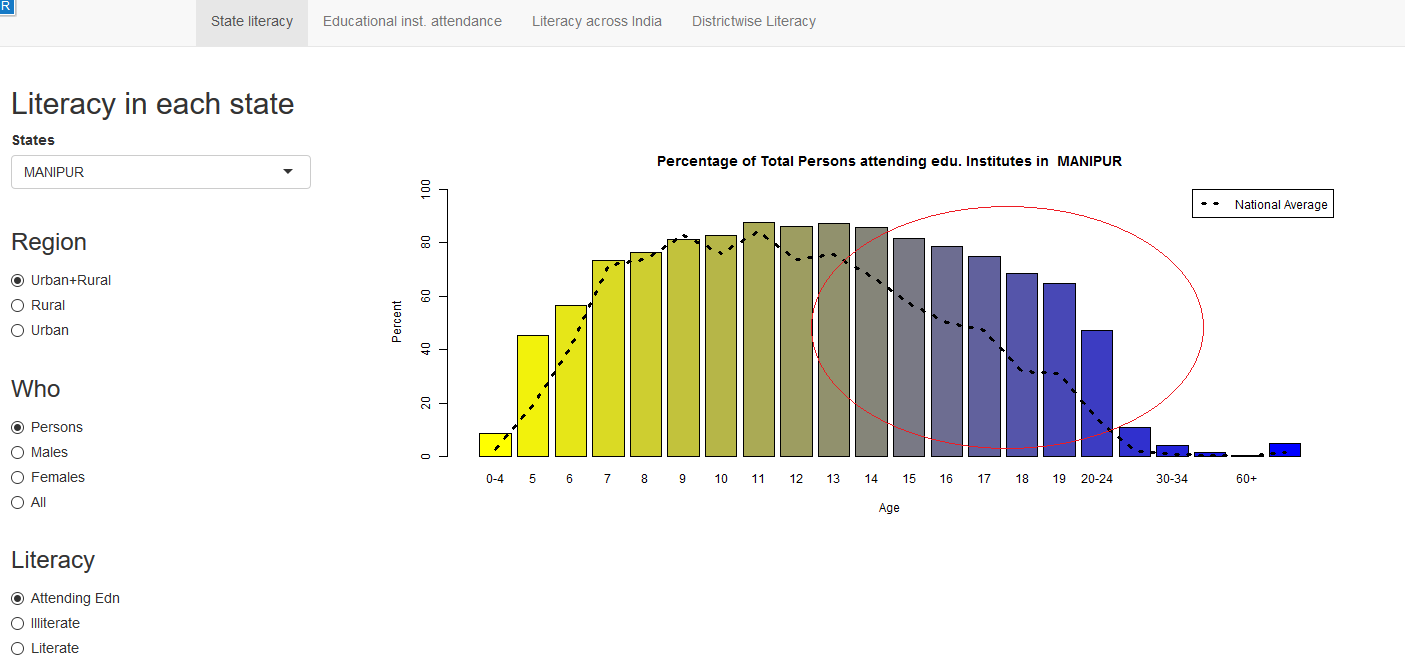
1. Literacy in India : A deepR dive.
2. Natural Language Processing: What would Shakespeare say?
3. Revisiting crimes against women in India
4. Informed choices through Machine Learning : Analyzing Kohli, Tendulkar and Dravid
5. Experiments with deblurring using OpenCV
6. What’s up Watson? Using IBM Watson’s QAAPI with Bluemix, NodeExpress – Part 1
7. Working with Node.js and PostgreSQL
8. A method for optimal bandwidth usage by auctioning available bandwidth using the OpenFlow Protocol
9. Latency, throughput implications for the cloud
10. A closer look at “Robot horse on a Trot! in Android”