I have been very fascinated by how Convolution Neural Networks have been able to, so efficiently, do image classification and image recognition CNN’s have been very successful in in both these tasks. A good paper that explores the workings of a CNN Visualizing and Understanding Convolutional Networks by Matthew D Zeiler and Rob Fergus. They show how through a reverse process of convolution using a deconvnet.
In their paper they show how by passing the feature map through a deconvnet ,which does the reverse process of the convnet, they can reconstruct what input pattern originally caused a given activation in the feature map
In the paper they say “A deconvnet can be thought of as a convnet model that uses the same components (filtering, pooling) but in reverse, so instead of mapping pixels to features, it does the opposite. An input image is presented to the CNN and features activation computed throughout the layers. To examine a given convnet activation, we set all other activations in the layer to zero and pass the feature maps as input to the attached deconvnet layer. Then we successively (i) unpool, (ii) rectify and (iii) filter to reconstruct the activity in the layer beneath that gave rise to the chosen activation. This is then repeated until input pixel space is reached.”
I started to scout the internet to see how I can implement this reverse process of Convolution to understand what really happens under the hood of a CNN. There are a lot of good articles and blogs, but I found this post Applied Deep Learning – Part 4: Convolutional Neural Networks take the visualization of the CNN one step further.
This post takes VGG16 as the pre-trained network and then uses this network to display the intermediate visualizations. While this post was very informative and also the visualizations of the various images were very clear, I wanted to simplify the problem for my own understanding.
Hence I decided to take the MNIST digit classification as my base problem. I created a simple 3 layer CNN which gives close to 99.1% accuracy and decided to see if I could do the visualization.
As mentioned in the above post, there are 3 major visualisations
- Feature activations at the layer
- Visualisation of the filters
- Visualisation of the class outputs
Feature Activation – This visualization the feature activation at the 3 different layers for a given input image. It can be seen that first layer activates based on the edge of the image. Deeper layers activate in a more abstract way.
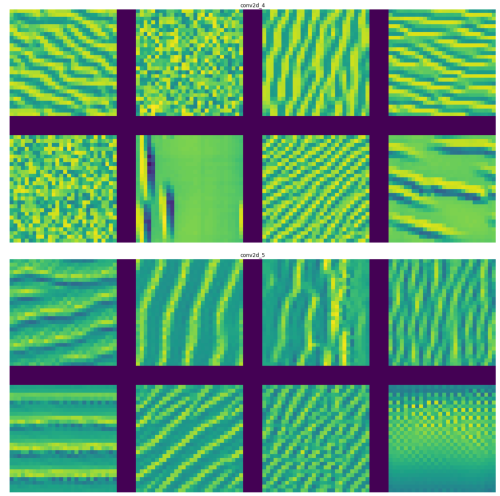
Visualization of the filters: This visualization shows what patterns the filters respond maximally to. This is implemented in Keras here
To do this the following is repeated in a loop
- Choose a loss function that maximizes the value of a convnet filter activation
- Do gradient ascent (maximization) in input space that increases the filter activation
Visualizing Class Outputs of the MNIST Convnet: This process is similar to determining the filter activation. Here the convnet is made to generate an image that represents the category maximally.
You can access the Google colab notebook here – Deconstructing Convolutional Neural Networks in Tensoflow and Keras
import numpy as np
import pandas as pd
import os
import tensorflow as tf
import matplotlib.pyplot as plt
from keras.layers import Dense, Dropout, Flatten
from keras.layers import Conv2D, MaxPooling2D, Input
from keras.models import Model
from sklearn.model_selection import train_test_split
from keras.utils import np_utils
mnist=tf.keras.datasets.mnist
# Set training and test data and labels
(training_images,training_labels),(test_images,test_labels)=mnist.load_data()
#Normalize training data
X =np.array(training_images).reshape(training_images.shape[0],28,28,1)
# Normalize the images by dividing by 255.0
X = X/255.0
X.shape
# Use one hot encoding for the labels
Y = np_utils.to_categorical(training_labels, 10)
Y.shape
# Split training data into training and validation data in the ratio of 80:20
X_train, X_validation, y_train, y_validation = train_test_split(X,Y,test_size=0.20, random_state=42)
# Normalize test data
X_test =np.array(test_images).reshape(test_images.shape[0],28,28,1)
X_test=X_test/255.0
#Use OHE for the test labels
Y_test = np_utils.to_categorical(test_labels, 10)
X_test.shape
Display data
Display the training data and the corresponding labels
print(training_labels[0:10])
f, axes = plt.subplots(1, 10, sharey=True,figsize=(10,10))
for i,ax in enumerate(axes.flat):
    ax.axis('off')
    ax.imshow(X[i,:,:,0],cmap="gray")

Create a Convolutional Neural Network
The CNN consists of 3 layers
- Conv2D of size 28 x 28 with 24 filters
- Perform Max pooling
- Conv2D of size 14 x 14 with 48 filters
- Perform max pooling
- Conv2d of size 7 x 7 with 64 filters
- Flatten
- Use Dense layer with 128 units
- Perform 25% dropout
- Perform categorical cross entropy with softmax activation function
num_classes=10
inputs = Input(shape=(28,28,1))
x = Conv2D(24,kernel_size=(3,3),padding='same',activation="relu")(inputs)
x = MaxPooling2D(pool_size=(2, 2))(x)
x = Conv2D(48, (3, 3), padding='same',activation='relu')(x)
x = MaxPooling2D(pool_size=(2, 2))(x)
x = Conv2D(64, (3, 3), padding='same',activation='relu')(x)
x = MaxPooling2D(pool_size=(2, 2))(x)
x = Flatten()(x)
x = Dense(128, activation='relu')(x)
x = Dropout(0.25)(x)
output = Dense(num_classes,activation="softmax")(x)

model = Model(inputs,output)

model.compile(loss='categorical_crossentropy',
          optimizer='adam',
          metrics=['accuracy'])
Summary of CNN
Display the summary of CNN
model.summary()
Perform Gradient descent and validate with the validation data
epochs = 20
batch_size=256
history = model.fit(X_train,y_train,
         epochs=epochs,
         batch_size=batch_size,
         validation_data=(X_validation,y_validation))

Test model on test data

l=[]
for i in range(10):
  x=X_test[i].reshape(1,28,28,1)
  y=model.predict(x)
  m = np.argmax(y, axis=1)
  print(m)
Generate the filter activations at the intermediate CNN layers
img = test_images[51].reshape(1,28,28,1)
fig = plt.figure(figsize=(5,5))
print(img.shape)
plt.imshow(img[0,:,:,0],cmap="gray")
plt.axis('off')

Display the activations at the intermediate layers
This displays the intermediate activations as the image passes through the filters and generates these feature maps
layer_names = ['conv2d_4', 'conv2d_5', 'conv2d_6']

layer_outputs = [layer.output for layer in model.layers if 'conv2d' in layer.name]
activation_model = Model(inputs=model.input,outputs=layer_outputs)
intermediate_activations = activation_model.predict(img)
images_per_row = 8
max_images = 8

for layer_name, layer_activation in zip(layer_names, intermediate_activations):
    print(layer_name,layer_activation.shape)
    n_features = layer_activation.shape[-1]
    print("features=",n_features)
    n_features = min(n_features, max_images)
    print(n_features)

    size = layer_activation.shape[1]
    print("size=",size)
    n_cols = n_features // images_per_row
    display_grid = np.zeros((size * n_cols, images_per_row * size))


    for col in range(n_cols):
      for row in range(images_per_row):
          channel_image = layer_activation[0,:, :, col * images_per_row + row]

          channel_image -= channel_image.mean()
          channel_image /= channel_image.std()
          channel_image *= 64
          channel_image += 128
          channel_image = np.clip(channel_image, 0, 255).astype('uint8')
          display_grid[col * size : (col + 1) * size,
                         row * size : (row + 1) * size] = channel_image
    scale = 2. / size
    plt.figure(figsize=(scale * display_grid.shape[1],
                        scale * display_grid.shape[0]))
    plt.axis('off')
    plt.title(layer_name)
    plt.grid(False)
    plt.imshow(display_grid, aspect='auto', cmap='viridis')

plt.show()

It can be seen that at the higher layers only abstract features of the input image are captured

# To fix the ImportError: cannot import name 'imresize' in the next cell. Run this cell. Then comment and restart and run all
#!pip install scipy==1.1.0
Visualize the pattern that the filters respond to maximally
- Choose a loss function that maximizes the value of the CNN filter in a given layer
- Start from a blank input image.
- Do gradient ascent in input space. Modify input values so that the filter activates more
- Repeat this in a loop.
from vis.visualization import visualize_activation, get_num_filters
from vis.utils import utils
from vis.input_modifiers import Jitter

max_filters = 24
selected_indices = []
vis_images = [[], [], [], [], []]
i = 0
selected_filters = [[0, 3, 11, 15, 16, 17, 18, 22],
    [8, 21, 23, 25, 31, 32, 35, 41],
    [2, 7, 11, 14, 19, 26, 35, 48]]

# Set the layers
layer_name = ['conv2d_4', 'conv2d_5', 'conv2d_6']
# Set the layer indices
layer_idx = [1,3,5]
for layer_name,layer_idx in zip(layer_name,layer_idx):


    # Visualize all filters in this layer.
    if selected_filters:
        filters = selected_filters[i]
    else:
        # Randomly select filters
        filters = sorted(np.random.permutation(get_num_filters(model.layers[layer_idx]))[:max_filters])
    selected_indices.append(filters)

    # Generate input image for each filter.
    # Loop through the selected filters in each layer and generate the activation of these filters
    for idx in filters:
        img = visualize_activation(model, layer_idx, filter_indices=idx, tv_weight=0.,
                                   input_modifiers=[Jitter(0.05)], max_iter=300)
        vis_images[i].append(img)

    # Generate stitched image palette with 4 cols so we get 2 rows.
    stitched = utils.stitch_images(vis_images[i], cols=4)
    plt.figure(figsize=(20, 30))
    plt.title(layer_name)
    plt.axis('off')
    stitched = stitched.reshape(1,61,127,1)
    plt.imshow(stitched[0,:,:,0])
    plt.show()
    i += 1


from vis.utils import utils
new_vis_images = [[], [], [], [], []]
i = 0
layer_name = ['conv2d_4', 'conv2d_5', 'conv2d_6']
layer_idx = [1,3,5]
for layer_name,layer_idx in zip(layer_name,layer_idx):

    # Generate input image for each filter.
    for j, idx in enumerate(selected_indices[i]):
        img = visualize_activation(model, layer_idx, filter_indices=idx,
                                   seed_input=vis_images[i][j], input_modifiers=[Jitter(0.05)], max_iter=300)
        #img = utils.draw_text(img, 'Filter {}'.format(idx))
        new_vis_images[i].append(img)

    stitched = utils.stitch_images(new_vis_images[i], cols=4)
    plt.figure(figsize=(20, 30))
    plt.title(layer_name)
    plt.axis('off')
    print(stitched.shape)
    stitched = stitched.reshape(1,61,127,1)
    plt.imshow(stitched[0,:,:,0])
    plt.show()
    i += 1


Visualizing Class Outputs
Here the CNN will generate the image that maximally represents the category. Each of the output represents one of the digits as can be seen below
from vis.utils import utils
from keras import activations
codes = '''
zero 0
one 1
two 2
three 3
four 4
five 5
six 6
seven 7
eight 8
nine 9
'''
layer_idx=10
initial = []
images = []
tuples = []
# Swap softmax with linear for better visualization
model.layers[layer_idx].activation = activations.linear
model = utils.apply_modifications(model)
for line in codes.split('\n'):
    if not line:
        continue
    name, idx = line.rsplit(' ', 1)
    idx = int(idx)
    img = visualize_activation(model, layer_idx, filter_indices=idx,
                               tv_weight=0., max_iter=300, input_modifiers=[Jitter(0.05)])

    initial.append(img)
    tuples.append((name, idx))

i = 0
for name, idx in tuples:
    img = visualize_activation(model, layer_idx, filter_indices=idx,
                               seed_input = initial[i], max_iter=300, input_modifiers=[Jitter(0.05)])
    #img = utils.draw_text(img, name) # Unable to display text on gray scale image
    i += 1
    images.append(img)

stitched = utils.stitch_images(images, cols=4)
plt.figure(figsize=(20, 20))
plt.axis('off')
stitched = stitched.reshape(1,94,127,1)
plt.imshow(stitched[0,:,:,0])

plt.show()
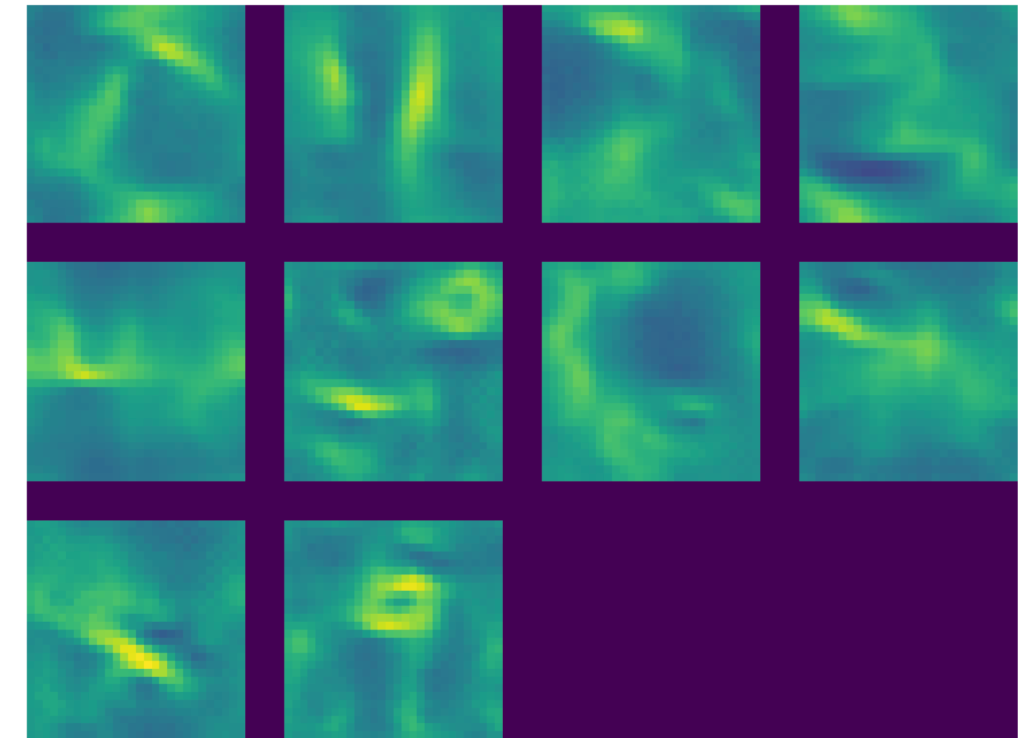
In the grid below the class outputs show the MNIST digits to which output responds to maximally. We can see the ghostly outline
of digits 0 – 9. We can clearly see the outline if 0,1, 2,3,4,5 (yes, it is there!),6,7, 8 and 9. If you look at this from a little distance the digits are clearly visible. Isn’t that really cool!!

Conclusion:
It is really interesting to see the class outputs which show the image to which the class output responds to maximally. In the
post Applied Deep Learning – Part 4: Convolutional Neural Networks the class output show much more complicated images and is worth a look. It is really interesting to note that the model has adjusted the filter values and the weights of the fully connected network to maximally respond to the MNIST digits
References
1. Visualizing and Understanding Convolutional Networks
2. Applied Deep Learning – Part 4: Convolutional Neural Networks
3. Visualizing Intermediate Activations of a CNN trained on the MNIST Dataset
4. How convolutional neural networks see the world
5. Keras – Activation_maximization
Also see
1. Using Reinforcement Learning to solve Gridworld
2. Deep Learning from first principles in Python, R and Octave – Part 8
3. Cricketr learns new tricks : Performs fine-grained analysis of players
4. Video presentation on Machine Learning, Data Science, NLP and Big Data – Part 1
5. Big Data-2: Move into the big league:Graduate from R to SparkR
6. OpenCV: Fun with filters and convolution
7. Powershell GUI – Adding bells and whistles
To see all posts click Index of posts


