Deconstructing Convolutional Neural Networks with Tensorflow and Keras

I have been very fascinated by how Convolution Neural  Networks have been able to, so efficiently,  do image classification and image recognition CNN’s have been very successful in in both these tasks. A good paper that explores the workings of a CNN Visualizing and Understanding Convolutional Networks  by Matthew D Zeiler and Rob Fergus. They show how through a reverse process of convolution using a deconvnet.

In their paper they show how by passing the feature map through a deconvnet ,which does the reverse process of the convnet, they can reconstruct what input pattern originally caused a given activation in the feature map

In the paper they say “A deconvnet can be thought of as a convnet model that uses the same components (filtering, pooling) but in reverse, so instead of mapping pixels to features, it does the opposite. An input image is presented to the CNN and features  activation computed throughout the layers. To examine a given convnet activation, we set all other activations in the layer to zero and pass the feature maps as input to the attached deconvnet layer. Then we successively (i) unpool, (ii) rectify and (iii) filter to reconstruct the activity in the layer beneath that gave rise to the chosen activation. This is then repeated until input pixel space is reached.”

I started to scout the internet to see how I can implement this reverse process of Convolution to understand what really happens under the hood of a CNN.  There are a lot of good articles and blogs, but I found this post Applied Deep Learning – Part 4: Convolutional Neural Networks take the visualization of the CNN one step further.

This post takes VGG16 as the pre-trained network and then uses this network to display the intermediate visualizations.  While this post was very informative and also the visualizations of the various images were very clear, I wanted to simplify the problem for my own understanding.

Hence I decided to take the MNIST digit classification as my base problem. I created a simple 3 layer CNN which gives close to 99.1% accuracy and decided to see if I could do the visualization.

As mentioned in the above post, there are 3 major visualisations

  1. Feature activations at the layer
  2. Visualisation of the filters
  3. Visualisation of the class outputs

Feature Activation – This visualization the feature activation at the 3 different layers for a given input image. It can be seen that first layer  activates based on the edge of the image. Deeper layers activate in a more abstract way.

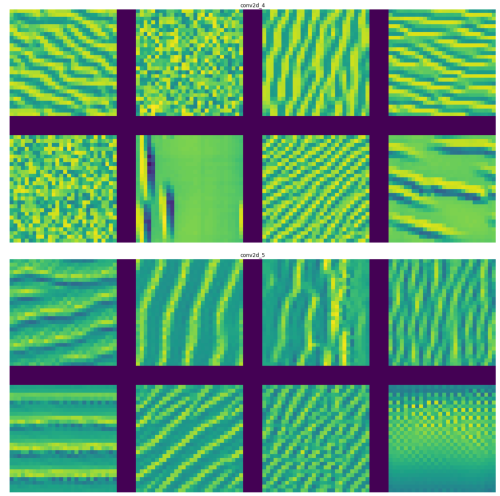
Visualization of the filters: This visualization shows what patterns the filters respond maximally to. This is implemented in Keras here

To do this the following is repeated in a loop

  • Choose a loss function that maximizes the value of a convnet filter activation
  • Do gradient ascent (maximization) in input space that increases the filter activation

Visualizing Class Outputs of the MNIST Convnet: This process is similar to determining the filter activation. Here the convnet is made to generate an image that represents the category maximally.

You can access the Google colab notebook here – Deconstructing Convolutional Neural Networks in Tensoflow and Keras

import numpy as np
import pandas as pd
import os
import tensorflow as tf
import matplotlib.pyplot as plt
from keras.layers import Dense, Dropout, Flatten
from keras.layers import Conv2D, MaxPooling2D, Input
from keras.models import Model
from sklearn.model_selection import train_test_split
from keras.utils import np_utils
Using TensorFlow backend.
In [0]:
mnist=tf.keras.datasets.mnist
# Set training and test data and labels
(training_images,training_labels),(test_images,test_labels)=mnist.load_data()
In [0]:
#Normalize training data
X =np.array(training_images).reshape(training_images.shape[0],28,28,1) 
# Normalize the images by dividing by 255.0
X = X/255.0
X.shape
# Use one hot encoding for the labels
Y = np_utils.to_categorical(training_labels, 10)
Y.shape
# Split training data into training and validation data in the ratio of 80:20
X_train, X_validation, y_train, y_validation = train_test_split(X,Y,test_size=0.20, random_state=42)
In [4]:
# Normalize test data
X_test =np.array(test_images).reshape(test_images.shape[0],28,28,1) 
X_test=X_test/255.0
#Use OHE for the test labels
Y_test = np_utils.to_categorical(test_labels, 10)
X_test.shape
Out[4]:
(10000, 28, 28, 1)

Display data

Display the training data and the corresponding labels

In [5]:
print(training_labels[0:10])
f, axes = plt.subplots(1, 10, sharey=True,figsize=(10,10))
for i,ax in enumerate(axes.flat):
    ax.axis('off')
    ax.imshow(X[i,:,:,0],cmap="gray")

Create a Convolutional Neural Network

The CNN consists of 3 layers

  • Conv2D of size 28 x 28 with 24 filters
  • Perform Max pooling
  • Conv2D of size 14 x 14 with 48 filters
  • Perform max pooling
  • Conv2d of size 7 x 7 with 64 filters
  • Flatten
  • Use Dense layer with 128 units
  • Perform 25% dropout
  • Perform categorical cross entropy with softmax activation function
In [0]:
num_classes=10
inputs = Input(shape=(28,28,1))
x = Conv2D(24,kernel_size=(3,3),padding='same',activation="relu")(inputs)
x = MaxPooling2D(pool_size=(2, 2))(x)
x = Conv2D(48, (3, 3), padding='same',activation='relu')(x)
x = MaxPooling2D(pool_size=(2, 2))(x)
x = Conv2D(64, (3, 3), padding='same',activation='relu')(x)
x = MaxPooling2D(pool_size=(2, 2))(x)
x = Flatten()(x)
x = Dense(128, activation='relu')(x)
x = Dropout(0.25)(x)
output = Dense(num_classes,activation="softmax")(x)

model = Model(inputs,output)

model.compile(loss='categorical_crossentropy', 
          optimizer='adam', 
          metrics=['accuracy'])

Summary of CNN

Display the summary of CNN

In [7]:
model.summary()
Model: "model_1"
_________________________________________________________________
Layer (type)                 Output Shape              Param #   
=================================================================
input_1 (InputLayer)         (None, 28, 28, 1)         0         
_________________________________________________________________
conv2d_1 (Conv2D)            (None, 28, 28, 24)        240       
_________________________________________________________________
max_pooling2d_1 (MaxPooling2 (None, 14, 14, 24)        0         
_________________________________________________________________
conv2d_2 (Conv2D)            (None, 14, 14, 48)        10416     
_________________________________________________________________
max_pooling2d_2 (MaxPooling2 (None, 7, 7, 48)          0         
_________________________________________________________________
conv2d_3 (Conv2D)            (None, 7, 7, 64)          27712     
_________________________________________________________________
max_pooling2d_3 (MaxPooling2 (None, 3, 3, 64)          0         
_________________________________________________________________
flatten_1 (Flatten)          (None, 576)               0         
_________________________________________________________________
dense_1 (Dense)              (None, 128)               73856     
_________________________________________________________________
dropout_1 (Dropout)          (None, 128)               0         
_________________________________________________________________
dense_2 (Dense)              (None, 10)                1290      
=================================================================
Total params: 113,514
Trainable params: 113,514
Non-trainable params: 0
_________________________________________________________________

Perform Gradient descent and validate with the validation data

In [8]:
epochs = 20
batch_size=256
history = model.fit(X_train,y_train,
         epochs=epochs,
         batch_size=batch_size,
         validation_data=(X_validation,y_validation))
————————————————
acc = history.history[ ‘accuracy’ ]
val_acc = history.history[ ‘val_accuracy’ ]
loss = history.history[ ‘loss’ ]
val_loss = history.history[‘val_loss’ ]
epochs = range(len(acc)) # Get number of epochs
#————————————————
# Plot training and validation accuracy per epoch
#————————————————
plt.plot ( epochs, acc,label=”training accuracy” )
plt.plot ( epochs, val_acc, label=’validation acuracy’ )
plt.title (‘Training and validation accuracy’)
plt.legend()
plt.figure()
#————————————————
# Plot training and validation loss per epoch
#————————————————
plt.plot ( epochs, loss , label=”training loss”)
plt.plot ( epochs, val_loss,label=”validation loss” )
plt.title (‘Training and validation loss’ )
plt.legend()
Test model on test data
f, axes = plt.subplots(1, 10, sharey=True,figsize=(10,10))
for i,ax in enumerate(axes.flat):
ax.axis(‘off’)
ax.imshow(X_test[i,:,:,0],cmap=”gray”)
l=[]
for i in range(10):
  x=X_test[i].reshape(1,28,28,1)
  y=model.predict(x)
  m = np.argmax(y, axis=1)
  print(m)
[7]
[2]
[1]
[0]
[4]
[1]
[4]
[9]
[5]
[9]

Generate the filter activations at the intermediate CNN layers

In [12]:
img = test_images[51].reshape(1,28,28,1)
fig = plt.figure(figsize=(5,5))
print(img.shape)
plt.imshow(img[0,:,:,0],cmap="gray")
plt.axis('off')

Display the activations at the intermediate layers

This displays the intermediate activations as the image passes through the filters and generates these feature maps

In [13]:
layer_names = ['conv2d_4', 'conv2d_5', 'conv2d_6']

layer_outputs = [layer.output for layer in model.layers if 'conv2d' in layer.name]
activation_model = Model(inputs=model.input,outputs=layer_outputs)
intermediate_activations = activation_model.predict(img)
images_per_row = 8
max_images = 8

for layer_name, layer_activation in zip(layer_names, intermediate_activations):
    print(layer_name,layer_activation.shape)
    n_features = layer_activation.shape[-1]
    print("features=",n_features)
    n_features = min(n_features, max_images)
    print(n_features)

    size = layer_activation.shape[1]
    print("size=",size)
    n_cols = n_features // images_per_row
    display_grid = np.zeros((size * n_cols, images_per_row * size))


    for col in range(n_cols):
      for row in range(images_per_row):
          channel_image = layer_activation[0,:, :, col * images_per_row + row]

          channel_image -= channel_image.mean()
          channel_image /= channel_image.std()
          channel_image *= 64
          channel_image += 128
          channel_image = np.clip(channel_image, 0, 255).astype('uint8')
          display_grid[col * size : (col + 1) * size,
                         row * size : (row + 1) * size] = channel_image
    scale = 2. / size
    plt.figure(figsize=(scale * display_grid.shape[1],
                        scale * display_grid.shape[0]))
    plt.axis('off')
    plt.title(layer_name)
    plt.grid(False)
    plt.imshow(display_grid, aspect='auto', cmap='viridis')
    
plt.show()

It can be seen that at the higher layers only abstract features of the input image are captured
# To fix the ImportError: cannot import name 'imresize' in the next cell. Run this cell. Then comment and restart and run all
#!pip install scipy==1.1.0

Visualize the pattern that the filters respond to maximally

  • Choose a loss function that maximizes the value of the CNN filter in a given layer
  • Start from a blank input image.
  • Do gradient ascent in input space. Modify input values so that the filter activates more
  • Repeat this in a loop.
In [14]:
from vis.visualization import visualize_activation, get_num_filters
from vis.utils import utils
from vis.input_modifiers import Jitter

max_filters = 24
selected_indices = []
vis_images = [[], [], [], [], []]
i = 0
selected_filters = [[0, 3, 11, 15, 16, 17, 18, 22], 
    [8, 21, 23, 25, 31, 32, 35, 41], 
    [2, 7, 11, 14, 19, 26, 35, 48]]

# Set the layers
layer_name = ['conv2d_4', 'conv2d_5', 'conv2d_6']
# Set the layer indices
layer_idx = [1,3,5]
for layer_name,layer_idx in zip(layer_name,layer_idx):


    # Visualize all filters in this layer.
    if selected_filters:
        filters = selected_filters[i]
    else:
        # Randomly select filters
        filters = sorted(np.random.permutation(get_num_filters(model.layers[layer_idx]))[:max_filters])
    selected_indices.append(filters)

    # Generate input image for each filter.
    # Loop through the selected filters in each layer and generate the activation of these filters
    for idx in filters:
        img = visualize_activation(model, layer_idx, filter_indices=idx, tv_weight=0., 
                                   input_modifiers=[Jitter(0.05)], max_iter=300) 
        vis_images[i].append(img)

    # Generate stitched image palette with 4 cols so we get 2 rows.
    stitched = utils.stitch_images(vis_images[i], cols=4)    
    plt.figure(figsize=(20, 30))
    plt.title(layer_name)
    plt.axis('off')
    stitched = stitched.reshape(1,61,127,1)
    plt.imshow(stitched[0,:,:,0])
    plt.show()
    i += 1
from vis.utils import utils
new_vis_images = [[], [], [], [], []]
i = 0
layer_name = ['conv2d_4', 'conv2d_5', 'conv2d_6']
layer_idx = [1,3,5]
for layer_name,layer_idx in zip(layer_name,layer_idx):
   
    # Generate input image for each filter.
    for j, idx in enumerate(selected_indices[i]):
        img = visualize_activation(model, layer_idx, filter_indices=idx, 
                                   seed_input=vis_images[i][j], input_modifiers=[Jitter(0.05)], max_iter=300) 
        #img = utils.draw_text(img, 'Filter {}'.format(idx))  
        new_vis_images[i].append(img)

    stitched = utils.stitch_images(new_vis_images[i], cols=4)   
    plt.figure(figsize=(20, 30))
    plt.title(layer_name)
    plt.axis('off')
    print(stitched.shape)
    stitched = stitched.reshape(1,61,127,1)
    plt.imshow(stitched[0,:,:,0])
    plt.show()
    i += 1

Visualizing Class Outputs

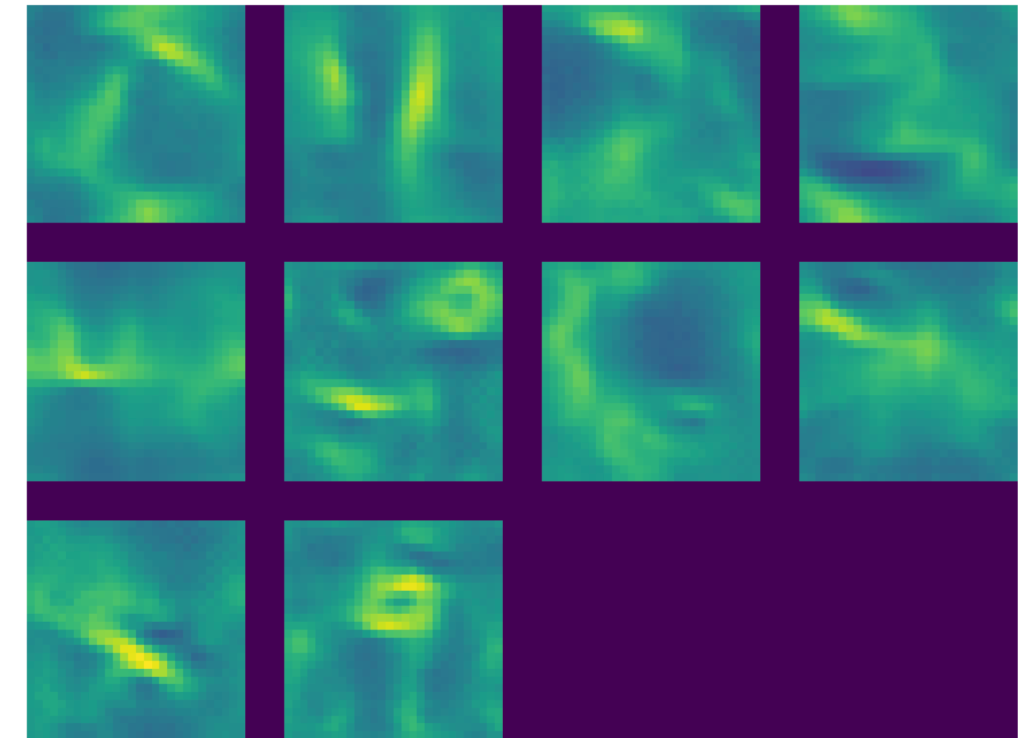
Here the CNN will generate the image that maximally represents the category. Each of the output represents one of the digits as can be seen below

In [16]:
from vis.utils import utils
from keras import activations
codes = '''
zero 0
one 1
two 2
three 3
four 4
five 5
six 6
seven 7
eight 8
nine 9
'''
layer_idx=10
initial = []
images = []
tuples = []
# Swap softmax with linear for better visualization
model.layers[layer_idx].activation = activations.linear
model = utils.apply_modifications(model)
for line in codes.split('\n'):
    if not line:
        continue
    name, idx = line.rsplit(' ', 1)
    idx = int(idx)
    img = visualize_activation(model, layer_idx, filter_indices=idx, 
                               tv_weight=0., max_iter=300, input_modifiers=[Jitter(0.05)])

    initial.append(img)
    tuples.append((name, idx))

i = 0
for name, idx in tuples:
    img = visualize_activation(model, layer_idx, filter_indices=idx,
                               seed_input = initial[i], max_iter=300, input_modifiers=[Jitter(0.05)])
    #img = utils.draw_text(img, name) # Unable to display text on gray scale image
    i += 1
    images.append(img)

stitched = utils.stitch_images(images, cols=4)
plt.figure(figsize=(20, 20))
plt.axis('off')
stitched = stitched.reshape(1,94,127,1)
plt.imshow(stitched[0,:,:,0])

plt.show()

In the grid below the class outputs show the MNIST digits to which output responds to maximally. We can see the ghostly outline
of digits 0 – 9. We can clearly see the outline if 0,1, 2,3,4,5 (yes, it is there!),6,7, 8 and 9. If you look at this from a little distance the digits are clearly visible. Isn’t that really cool!!


Conclusion:


It is really interesting to see the class outputs which show the image to which the class output responds to maximally. In the
post Applied Deep Learning – Part 4: Convolutional Neural Networks the class output show much more complicated images and is worth a look. It is really interesting to note that the model has adjusted the filter values and the weights of the fully connected network to maximally respond to the MNIST digits

References

1. Visualizing and Understanding Convolutional Networks
2. Applied Deep Learning – Part 4: Convolutional Neural Networks
3. Visualizing Intermediate Activations of a CNN trained on the MNIST Dataset
4. How convolutional neural networks see the world
5. Keras – Activation_maximization

Also see

1. Using Reinforcement Learning to solve Gridworld
2. Deep Learning from first principles in Python, R and Octave – Part 8
3. Cricketr learns new tricks : Performs fine-grained analysis of players
4. Video presentation on Machine Learning, Data Science, NLP and Big Data – Part 1
5. Big Data-2: Move into the big league:Graduate from R to SparkR
6. OpenCV: Fun with filters and convolution
7. Powershell GUI – Adding bells and whistles

To see all posts click Index of posts

Understanding Neural Style Transfer with Tensorflow and Keras

Neural Style Transfer (NST)  is a fascinating area of Deep Learning and Convolutional Neural Networks. NST is an interesting technique, in which the style from an image, known as the ‘style image’ is transferred to another image ‘content image’ and we get a third a image which is a generated image which has the content of the original image and the style of another image.

NST can be used to reimagine how famous painters like Van Gogh, Claude Monet or a Picasso would have visualised a scenery or architecture. NST uses Convolutional Neural Networks (CNNs) to achieve this artistic style transfer from one image to another. NST was originally implemented by Gati et al., in their paper Neural Algorithm of Artistic Style. Convolutional Neural Networks have been very successful in image classification image recognition et cetera. CNN networks have also been have also generated very interesting pictures using Neural Style Transfer which will be shown in this post. An interesting aspect of CNN’s is that the first couple of layers in the CNN capture basic features of the image like edges and  pixel values. But as we go deeper into the CNN, the network captures higher level features of the input image.

To get started with Neural Style transfer  we will be using the VGG19 pre-trained network. The VGG19 CNN is a compact pre-trained your network which can be used for performing the NST. However, we could have also used Resnet or InceptionV3 networks for this purpose but these are very large networks. The idea of using a network trained on a different task and applying it to a new task is called transfer learning.

What needs to be done to transfer the style from one of the image to another image. This brings us to the question – What is ‘style’? What is it that distinguishes Van Gogh’s painting or Picasso’s cubist art. Convolutional Neural Networks capture basic features in the lower layers and much more complex features in the deeper layers.  Style can be computed by taking the correlation of the feature maps in a layer L. This is my interpretation of how style is captured.  Since style  is intrinsic to  the image, it  implies that the style feature would exist across all the filters in a layer. Hence, to pick up this style we would need to get the correlation of the filters across channels of a lawyer. This is computed mathematically, using the Gram matrix which calculates the correlation of the activation of a the filter by the style image and generated image

To transfer the style from one image to the content image we need to do two parallel operations while doing forward propagation
– Compute the content loss between the source image and the generated image
– Compute the style loss between the style image and the generated image
– Finally we need to compute the total loss

In order to get transfer the style from the ‘style’ image to the ‘content ‘image resulting in a  ‘generated’  image  the total loss has to be minimised. Therefore backward propagation with gradient descent  is done to minimise the total loss comprising of the content and style loss.

Initially we make the Generated Image ‘G’ the same as the source image ‘S’

The content loss at layer ‘l’

L_{content} = 1/2 \sum_{i}^{j} ( F^{l}_{i,j} - P^{l}_{i,j})^{2}

where F^{l}_{i,j} and P^{l}_{i,j} represent the activations at layer ‘l’ in a filter i, at position ‘j’. The intuition is that the activations will be same for similar source and generated image. We need to minimise the content loss so that the generated stylized image is as close to the original image as possible. An intermediate layer of VGG19 block5_conv2 is used

The Style layers that are are used are

style_layers = [‘block1_conv1’,
‘block2_conv1’,
‘block3_conv1’,
‘block4_conv1’,
‘block5_conv1’]
To compute the Style Loss the Gram matrix needs to be computed. The Gram Matrix is computed by unrolling the filters as shown below (source: Convolutional Neural Networks by Prof Andrew Ng, Coursera). The result is a matrix of size n_{c} x n_{c} where n_{c} is the number of channels
The above diagram shows the filters of height n_{H} and width n_{W} with n_{C} channels
The contribution of layer ‘l’ to style loss is given by
L^{'}_{style} = \frac{\sum_{i}^{j} (G^{2}_{i,j} - A^l{i,j})^2}{4N^{2}_{l}M^{2}_{l}}
where G_{i,j}  and A_{i,j} are the Gram matrices of the style and generated images respectively. By minimising the distance in the gram matrices of the style and generated image we can ensure that generated image is a stylized version of the original image similar to the style image
The total loss is given by
L_{total} = \alpha L_{content} + \beta L_{style}
Back propagation with gradient descent works to minimise the content loss between the source and generated image, while the style loss tries to minimise the discrepancies in the style of the style image and generated image. Running through forward and backpropagation through several epochs successfully transfers the style from the style image to the source image.
You can check the Notebook at Neural Style Transfer

Note: The code in this notebook is largely based on the Neural Style Transfer tutorial from Tensorflow, though I may have taken some changes from other blogs. I also made a few changes to the code in this tutorial, like removing the scaling factor, or the class definition (Personally, I belong to the old school (C language) and am not much in love with the ‘self.”..All references are included below

Note: Here is a interesting thought. Could we do a Neural Style Transfer in music? Imagine Carlos Santana playing ‘Hotel California’ or Brian May style in ‘Another brick in the wall’. While our first reaction would be that it may not sound good as we are used to style of these songs, we may be surprised by a possible style transfer. This is definitely music to the ears!


Here are few runs from this

A) Run 1

1. Neural Style Transfer – a) Content Image – My portrait.  b) Style Image – Wassily Kadinsky Oil on canvas, 1913, Vassily Kadinsky’s composition


2. Result of Neural Style Transfer


2) Run 2

a) Content Image – Portrait of my parents b) Style Image –  Vincent Van Gogh’s ,Starry Night Oil on canvas 1889


2. Result of Neural Style Transfer


Run 3

1.  Content Image – Caesar 2 (Masai Mara- 20 Jun 2018).  Style Image – The Great Wave at Kanagawa – Katsushika Hokosai, 1826-1833


Screenshot 2020-04-12 at 12.40.44 PM

2. Result of Neural Style Transfer

lkg


Run 4

1.   Content Image – Junagarh Fort , Rajasthan   Sep 2016              b) Style Image – Le Pont Japonais by Claude Monet, Oil on canvas, 1920


2. Result of Neural Style Transfer


Neural Style Transfer is a very ingenious idea which shows that we can segregate the style of a painting and transfer to another image.

References

1. A Neural Algorithm of Artistic Style, Leon A. Gatys, Alexander S. Ecker, Matthias Bethge
2. Neural style transfer
3. Neural Style Transfer: Creating Art with Deep Learning using tf.keras and eager execution
4. Convolutional Neural Network, DeepLearning.AI Specialization, Prof Andrew Ng
5. Intuitive Guide to Neural Style Transfer

See also

1. Big Data-5: kNiFi-ing through cricket data with yorkpy
2. Cricketr adds team analytics to its repertoire
3. Cricpy performs granular analysis of players
4. My book ‘Deep Learning from first principles:Second Edition’ now on Amazon
5. Programming Zen and now – Some essential tips-2
6. The Anomaly
7. Practical Machine Learning with R and Python – Part 5
8. Literacy in India – A deepR dive
9. “Is it an animal? Is it an insect?” in Android

To see all posts click Index of posts

The mechanics of Convolutional Neural Networks in Tensorflow and Keras

Convolutional Neural Networks (CNNs), have been very popular in the last decade or so. CNNs have been used in multiple applications like image recognition, image classification, facial recognition, neural style transfer etc. CNN’s have been extremely successful in handling these kind of problems. How do they work? What makes them so successful? What is the principle behind CNN’s ?

Note: this post is based on two Coursera courses I did, namely namely Deep Learning specialisation by Prof Andrew Ng and Tensorflow Specialisation by  Laurence Moroney.

In this post I show you how CNN’s work. To understand how CNNs work, we need to understand the concept behind machine learning algorithms. If you take a simple machine learning algorithm in which you are trying to do multi-class classification using softmax or binary classification with the sigmoid function, for a set of for a set of input features against a target variable we need to create an objective function of the input features versus the target variable. Then we need to minimise this objective function, while performing gradient descent, such that the cost  is the lowest. This will give the set of weights for the different variables in the objective function.

The central problem in ML algorithms is to do feature selection, i.e.  we need to find the set of features that actually influence the target.  There are various methods for doing features selection – best fit, forward fit, backward fit, ridge and lasso regression. All these methods try to pick out the predictors that influence the output most, by making the weights of the other features close to zero. Please look at my post – Practical Machine Learning in R and Python – Part 3, where I show you the different methods for doing features selection.

In image classification or Image recognition we need to find the important features in the image. How do we do that? Many years back, have played around with OpenCV.  While working with OpenCV I came across are numerous filters like the Sobel ,the Laplacian, Canny, Gaussian filter et cetera which can be used to identify key features of the image. For example the Canny filter feature can be used for edge detection, Gaussian for smoothing, Sobel for determining the derivative and we have other filters for detecting vertical or horizontal edges. Take a look at my post Computer Vision: Ramblings on derivatives, histograms and contours So for handling images we need to apply these filters to pick  out the key features of the image namely the edges and other features. So rather than using the entire image’s pixels against the target class we can pick out the features from the image and use that as predictors of the target output.

Note: that in Convolutional Neural Network, fixed filter values like the those shown above  are not used directly. Rather the filter values are learned through back propagation and gradient descent as shown below.

In CNNs the filter values are considered to be weights which are then learned and updated in each forward/backward propagation cycle much like the way a fully connected Deep Learning Network learns the weights of the network.

Here is a short derivation of the most important parts of how a CNNs work

The convolution of a filter F with the input X can be represented as.


Convolving we get


This the forward propagation as it passes through a non-linear function like Relu


To go through back propagation we need to compute the \partial L  at every node of Convolutional Neural network


The loss with respect to the output is \partial L/\partial O. \partial O/\partial X & \partial O/\partial F are the local derivatives

We need these local derivatives because we can learn the filter values using gradient descent

where \alpha is the learning rate. Also \partial L/\partial X is the loss which is back propagated to the previous layers. You can see the detailed derivation of back propagation in my post Deep Learning from first principles in Python, R and Octave – Part 3 in a L-layer, multi-unit Deep Learning network.

In the fully connected layers the weights associated with each connection is computed in every cycle of forward and backward propagation using gradient descent. Similarly, the filter values are also computed and updated in each forward and backward propagation cycle. This is done so as to minimize the loss at the output layer.

By using the chain rule and simplifying the back propagation for the Convolutional layers we get these 2 equations. The first equation is used to learn the filter values and the second is used pass the loss to layers before

(for the detailed derivation see Convolutions and Backpropagations

An important aspect of performing convolutions is to reduce the size of  the flattened image that is passed into the fully connected DL network. Successively convolving with 2D filters and doing a max pooling helps to reduce the size of the features that we can use for learning the images. Convolutions also enable a sparsity of connections  as you can see in the diagram below. In the LeNet-5 Convolution Neural Network of Yann Le Cunn, successive convolutions reduce the image size from 28 x 28=784 to 120 flattened values.

Here is an interesting Deep Learning problem. Convolutions help in picking out important features of images and help in image classification/ detection. What would be its equivalent if we wanted to identify the Carnatic ragam of a song? A Carnatic ragam is roughly similar to Western scales (major, natural, melodic, blues) with all its modes Lydian, Aeolion, Phyrgian etc. Except in the case of the ragams, it is more nuanced, complex and involved. Personally, I can rarely identify a ragam on which a carnatic song is based (I am tone deaf when it comes to identifying ragams). I have come to understand that each Carnatic ragam has its own character, which is made up of several melodic phrases which are unique to that flavor of a ragam. What operation like convolution would be needed so that we can pick out these unique phrases in a Carnatic ragam? Of course, we would need to use it in Recurrent Neural Networks with LSTMs as a song is a time sequence of notes to identify sequences. Nevertheless, if there was some operation with which we can pick up the distinct, unique phrases from a song and then run it through a classifier, maybe we would be able to identify the ragam of the song.

Below I implement 3 simple CNN using the Dogs vs Cats Dataset from Kaggle. The first CNN uses regular Convolutions a Fully connected network to classify the images. The second approach uses Image Augmentation. For some reason, I did not get a better performance with Image Augumentation. Thirdly I use the pre-trained Inception v3 network.


1. Basic Convolutional Neural Network in Tensorflow & Keras

You can view the Colab notebook here – Cats_vs_dogs_1.ipynb

Here some important parts of the notebook

Create CNN Model

  • Use 3 Convolution + Max pooling layers with 32,64 and 128 filters respectively
  • Flatten the data
  • Have 2 Fully connected layers with 128, 512 neurons with relu activation
  • Use sigmoid for binary classification
In [0]:
model = tf.keras.models.Sequential([
    tf.keras.layers.Conv2D(32,(3,3),activation='relu',input_shape=(150,150,3)),
    tf.keras.layers.MaxPooling2D(2,2),
    tf.keras.layers.Conv2D(64,(3,3),activation='relu'),
    tf.keras.layers.MaxPooling2D(2,2),
    tf.keras.layers.Conv2D(128,(3,3),activation='relu'),
    tf.keras.layers.MaxPooling2D(2,2),
    tf.keras.layers.Flatten(),
    tf.keras.layers.Dense(128,activation='relu'),
    tf.keras.layers.Dense(512,activation='relu'),
    tf.keras.layers.Dense(1,activation='sigmoid')
])

Print model summary

In [13]:
model.summary()
Model: "sequential"
_________________________________________________________________
Layer (type)                 Output Shape              Param #   
=================================================================
conv2d (Conv2D)              (None, 148, 148, 32)      896       
_________________________________________________________________
max_pooling2d (MaxPooling2D) (None, 74, 74, 32)        0         
_________________________________________________________________
conv2d_1 (Conv2D)            (None, 72, 72, 64)        18496     
_________________________________________________________________
max_pooling2d_1 (MaxPooling2 (None, 36, 36, 64)        0         
_________________________________________________________________
conv2d_2 (Conv2D)            (None, 34, 34, 128)       73856     
_________________________________________________________________
max_pooling2d_2 (MaxPooling2 (None, 17, 17, 128)       0         
_________________________________________________________________
flatten (Flatten)            (None, 36992)             0         
_________________________________________________________________
dense (Dense)                (None, 128)               4735104   
_________________________________________________________________
dense_1 (Dense)              (None, 512)               66048     
_________________________________________________________________
dense_2 (Dense)              (None, 1)                 513       
=================================================================
Total params: 4,894,913
Trainable params: 4,894,913
Non-trainable params: 0
_________________________________________________________________

Use the Adam Optimizer with binary cross entropy

model.compile(optimizer='adam',
             loss='binary_crossentropy',
             metrics=['accuracy'])

Perform Gradient Descent

  • Do Gradient Descent for 15 epochs
history=model.fit(train_generator,
                 validation_data=validation_generator,
                 steps_per_epoch=100,
                 epochs=15,
                 validation_steps=50,
                 verbose=2)
Epoch 1/15
100/100 - 13s - loss: 0.6821 - accuracy: 0.5425 - val_loss: 0.6484 - val_accuracy: 0.6131
Epoch 2/15
100/100 - 13s - loss: 0.6227 - accuracy: 0.6456 - val_loss: 0.6161 - val_accuracy: 0.6394
Epoch 3/15
100/100 - 13s - loss: 0.5975 - accuracy: 0.6719 - val_loss: 0.5558 - val_accuracy: 0.7206
Epoch 4/15
100/100 - 13s - loss: 0.5480 - accuracy: 0.7241 - val_loss: 0.5431 - val_accuracy: 0.7138
Epoch 5/15
100/100 - 13s - loss: 0.5182 - accuracy: 0.7447 - val_loss: 0.4839 - val_accuracy: 0.7606
Epoch 6/15
100/100 - 13s - loss: 0.4773 - accuracy: 0.7781 - val_loss: 0.5029 - val_accuracy: 0.7506
Epoch 7/15
100/100 - 13s - loss: 0.4466 - accuracy: 0.7972 - val_loss: 0.4573 - val_accuracy: 0.7912
Epoch 8/15
100/100 - 13s - loss: 0.4395 - accuracy: 0.7997 - val_loss: 0.4252 - val_accuracy: 0.8119
Epoch 9/15
100/100 - 13s - loss: 0.4314 - accuracy: 0.8019 - val_loss: 0.4931 - val_accuracy: 0.7481
Epoch 10/15
100/100 - 13s - loss: 0.4309 - accuracy: 0.7969 - val_loss: 0.4203 - val_accuracy: 0.8109
Epoch 11/15
100/100 - 13s - loss: 0.4329 - accuracy: 0.7916 - val_loss: 0.4189 - val_accuracy: 0.8069
Epoch 12/15
100/100 - 13s - loss: 0.4248 - accuracy: 0.8050 - val_loss: 0.4476 - val_accuracy: 0.7925
Epoch 13/15
100/100 - 13s - loss: 0.3868 - accuracy: 0.8306 - val_loss: 0.3900 - val_accuracy: 0.8236
Epoch 14/15
100/100 - 13s - loss: 0.3710 - accuracy: 0.8328 - val_loss: 0.4520 - val_accuracy: 0.7900
Epoch 15/15
100/100 - 13s - loss: 0.3654 - accuracy: 0.8353 - val_loss: 0.3999 - val_accuracy: 0.8100


Plot results

    • Plot training and validation accuracy


  • Plot training and validation loss


#-----------------------------------------------------------
# Retrieve a list of list results on training and test data
# sets for each training epoch
#-----------------------------------------------------------
acc      = history.history[     'accuracy' ]
val_acc  = history.history[ 'val_accuracy' ]
loss     = history.history[    'loss' ]
val_loss = history.history['val_loss' ]

epochs   = range(len(acc)) # Get number of epochs

#------------------------------------------------
# Plot training and validation accuracy per epoch
#------------------------------------------------
plt.plot  ( epochs,     acc,label="training accuracy" )
plt.plot  ( epochs, val_acc, label='validation acuracy' )
plt.title ('Training and validation accuracy')
plt.legend()

plt.figure()

#------------------------------------------------
# Plot training and validation loss per epoch
#------------------------------------------------
plt.plot  ( epochs,     loss , label="training loss")
plt.plot  ( epochs, val_loss,label="validation loss" )
plt.title ('Training and validation loss'   )
plt.legend()


2. CNN with Image Augmentation

You can check the Cats_vs_Dogs_2.ipynb

Including the important parts of this implementation below

Use Image Augumentation

Use Image Augumentation to improve performance

  • Use the same model parameters as before
  • Perform the following image augmentation
    • width, height shift
    • shear and zoom

    Note: Adding rotation made the performance worse

import tensorflow as tf
from tensorflow import keras
from tensorflow.keras.optimizers import RMSprop
from tensorflow.keras.preprocessing.image import ImageDataGenerator
model = tf.keras.models.Sequential([
    tf.keras.layers.Conv2D(32,(3,3),activation='relu',input_shape=(150,150,3)),
    tf.keras.layers.MaxPooling2D(2,2),
    tf.keras.layers.Conv2D(64,(3,3),activation='relu'),
    tf.keras.layers.MaxPooling2D(2,2),
    tf.keras.layers.Conv2D(128,(3,3),activation='relu'),
    tf.keras.layers.MaxPooling2D(2,2),
    tf.keras.layers.Flatten(),
    tf.keras.layers.Dense(128,activation='relu'),
    tf.keras.layers.Dense(512,activation='relu'),
    tf.keras.layers.Dense(1,activation='sigmoid')
])


train_datagen = ImageDataGenerator(
      rescale=1./255,
      #rotation_range=90,
      width_shift_range=0.2,
      height_shift_range=0.2,
      shear_range=0.2,
      zoom_range=0.2)
      #horizontal_flip=True,
      #fill_mode='nearest')

validation_datagen = ImageDataGenerator(rescale=1./255)
#
train_generator = train_datagen.flow_from_directory(train_dir,
                                                    batch_size=32,
                                                    class_mode='binary',
                                                    target_size=(150, 150))     
# --------------------
# Flow validation images in batches of 20 using test_datagen generator
# --------------------
validation_generator =  validation_datagen.flow_from_directory(validation_dir,
                                                         batch_size=32,
                                                         class_mode  = 'binary',
                                                         target_size = (150, 150))

# Use Adam Optmizer 
model.compile(optimizer='adam',
             loss='binary_crossentropy',
             metrics=['accuracy'])
Found 20000 images belonging to 2 classes.
Found 5000 images belonging to 2 classes.

Perform Gradient Descent

history=model.fit(train_generator,
                 validation_data=validation_generator,
                 steps_per_epoch=100,
                 epochs=15,
                 validation_steps=50,
                 verbose=2)
Epoch 1/15
100/100 - 27s - loss: 0.5716 - accuracy: 0.6922 - val_loss: 0.4843 - val_accuracy: 0.7744
Epoch 2/15
100/100 - 27s - loss: 0.5575 - accuracy: 0.7084 - val_loss: 0.4683 - val_accuracy: 0.7750
Epoch 3/15
100/100 - 26s - loss: 0.5452 - accuracy: 0.7228 - val_loss: 0.4856 - val_accuracy: 0.7665
Epoch 4/15
100/100 - 27s - loss: 0.5294 - accuracy: 0.7347 - val_loss: 0.4654 - val_accuracy: 0.7812
Epoch 5/15
100/100 - 27s - loss: 0.5352 - accuracy: 0.7350 - val_loss: 0.4557 - val_accuracy: 0.7981
Epoch 6/15
100/100 - 26s - loss: 0.5136 - accuracy: 0.7453 - val_loss: 0.4964 - val_accuracy: 0.7621
Epoch 7/15
100/100 - 27s - loss: 0.5249 - accuracy: 0.7334 - val_loss: 0.4959 - val_accuracy: 0.7556
Epoch 8/15
100/100 - 26s - loss: 0.5035 - accuracy: 0.7497 - val_loss: 0.4555 - val_accuracy: 0.7969
Epoch 9/15
100/100 - 26s - loss: 0.5024 - accuracy: 0.7487 - val_loss: 0.4675 - val_accuracy: 0.7728
Epoch 10/15
100/100 - 27s - loss: 0.5015 - accuracy: 0.7500 - val_loss: 0.4276 - val_accuracy: 0.8075
Epoch 11/15
100/100 - 26s - loss: 0.5002 - accuracy: 0.7581 - val_loss: 0.4193 - val_accuracy: 0.8131
Epoch 12/15
100/100 - 27s - loss: 0.4733 - accuracy: 0.7706 - val_loss: 0.5209 - val_accuracy: 0.7398
Epoch 13/15
100/100 - 27s - loss: 0.4999 - accuracy: 0.7538 - val_loss: 0.4109 - val_accuracy: 0.8075
Epoch 14/15
100/100 - 27s - loss: 0.4550 - accuracy: 0.7859 - val_loss: 0.3770 - val_accuracy: 0.8288
Epoch 15/15
100/100 - 26s - loss: 0.4688 - accuracy: 0.7688 - val_loss: 0.4764 - val_accuracy: 0.7786

Plot results

  • Plot training and validation accuracy
  • Plot training and validation loss
In [15]:
import matplotlib.pyplot as plt
#-----------------------------------------------------------
# Retrieve a list of list results on training and test data
# sets for each training epoch
#-----------------------------------------------------------
acc      = history.history[     'accuracy' ]
val_acc  = history.history[ 'val_accuracy' ]
loss     = history.history[    'loss' ]
val_loss = history.history['val_loss' ]

epochs   = range(len(acc)) # Get number of epochs

#------------------------------------------------
# Plot training and validation accuracy per epoch
#------------------------------------------------
plt.plot  ( epochs,     acc,label="training accuracy" )
plt.plot  ( epochs, val_acc, label='validation acuracy' )
plt.title ('Training and validation accuracy')
plt.legend()

plt.figure()

#------------------------------------------------
# Plot training and validation loss per epoch
#------------------------------------------------
plt.plot  ( epochs,     loss , label="training loss")
plt.plot  ( epochs, val_loss,label="validation loss" )
plt.title ('Training and validation loss'   )
plt.legend()


Implementation using Inception Network V3

The implementation is in the Colab notebook Cats_vs_Dog_3.ipynb

This is implemented as below

Use Inception V3

import os

from tensorflow.keras import layers
from tensorflow.keras import Model

  
from tensorflow.keras.applications.inception_v3 import InceptionV3
pre_trained_model = InceptionV3(input_shape = (150, 150, 3), 
                                include_top = False, 
                                weights = 'imagenet')


for layer in pre_trained_model.layers:
  layer.trainable = False
  
# pre_trained_model.summary()

last_layer = pre_trained_model.get_layer('mixed7')
print('last layer output shape: ', last_layer.output_shape)
last_output = last_layer.output
Downloading data from https://storage.googleapis.com/tensorflow/keras-applications/inception_v3/inception_v3_weights_tf_dim_ordering_tf_kernels_notop.h5
87916544/87910968 [==============================] - 1s 0us/step
last layer output shape:  (None, 7, 7, 768)

Use Layer 7 of Inception Network

  • Use Image Augumentation
  • Use Adam Optimizer
In [0]:
import tensorflow as tf
from tensorflow import keras
from tensorflow.keras.optimizers import RMSprop
from tensorflow.keras.preprocessing.image import ImageDataGenerator
# Flatten the output layer to 1 dimension
x = layers.Flatten()(last_output)
# Add a fully connected layer with 1,024 hidden units and ReLU activation
x = layers.Dense(1024, activation='relu')(x)
# Add a dropout rate of 0.2
x = layers.Dropout(0.2)(x)                  
# Add a final sigmoid layer for classification
x = layers.Dense  (1, activation='sigmoid')(x)           

model = Model( pre_trained_model.input, x) 
#train_datagen = ImageDataGenerator( rescale = 1.0/255. )
#validation_datagen = ImageDataGenerator( rescale = 1.0/255. )

train_datagen = ImageDataGenerator(
      rescale=1./255,
      #rotation_range=90,
      width_shift_range=0.2,
      height_shift_range=0.2,
      shear_range=0.2,
      zoom_range=0.2)
      #horizontal_flip=True,
      #fill_mode='nearest')

validation_datagen = ImageDataGenerator(rescale=1./255)
#
train_generator = train_datagen.flow_from_directory(train_dir,
                                                    batch_size=32,
                                                    class_mode='binary',
                                                    target_size=(150, 150))     
# --------------------
# Flow validation images in batches of 20 using test_datagen generator
# --------------------
validation_generator =  validation_datagen.flow_from_directory(validation_dir,
                                                         batch_size=32,
                                                         class_mode  = 'binary',
                                                         target_size = (150, 150))


model.compile(optimizer='adam',
             loss='binary_crossentropy',
             metrics=['accuracy'])
Found 20000 images belonging to 2 classes.
Found 5000 images belonging to 2 classes.

Fit model

history=model.fit(train_generator,
                 validation_data=validation_generator,
                 steps_per_epoch=100,
                 epochs=15,
                 validation_steps=50,
                 verbose=2)
Epoch 1/15
100/100 - 31s - loss: 0.5961 - accuracy: 0.8909 - val_loss: 0.1919 - val_accuracy: 0.9456
Epoch 2/15
100/100 - 30s - loss: 0.2002 - accuracy: 0.9259 - val_loss: 0.1025 - val_accuracy: 0.9550
Epoch 3/15
100/100 - 30s - loss: 0.1618 - accuracy: 0.9366 - val_loss: 0.0920 - val_accuracy: 0.9581
Epoch 4/15
100/100 - 29s - loss: 0.1442 - accuracy: 0.9381 - val_loss: 0.0960 - val_accuracy: 0.9600
Epoch 5/15
100/100 - 30s - loss: 0.1402 - accuracy: 0.9381 - val_loss: 0.0703 - val_accuracy: 0.9794
Epoch 6/15
100/100 - 30s - loss: 0.1437 - accuracy: 0.9413 - val_loss: 0.1090 - val_accuracy: 0.9531
Epoch 7/15
100/100 - 30s - loss: 0.1325 - accuracy: 0.9428 - val_loss: 0.0756 - val_accuracy: 0.9670
Epoch 8/15
100/100 - 29s - loss: 0.1341 - accuracy: 0.9491 - val_loss: 0.0625 - val_accuracy: 0.9737
Epoch 9/15
100/100 - 29s - loss: 0.1186 - accuracy: 0.9513 - val_loss: 0.0934 - val_accuracy: 0.9581
Epoch 10/15
100/100 - 29s - loss: 0.1171 - accuracy: 0.9513 - val_loss: 0.0642 - val_accuracy: 0.9727
Epoch 11/15
100/100 - 29s - loss: 0.1018 - accuracy: 0.9591 - val_loss: 0.0930 - val_accuracy: 0.9606
Epoch 12/15
100/100 - 29s - loss: 0.1190 - accuracy: 0.9541 - val_loss: 0.0737 - val_accuracy: 0.9719
Epoch 13/15
100/100 - 29s - loss: 0.1223 - accuracy: 0.9494 - val_loss: 0.0740 - val_accuracy: 0.9695
Epoch 14/15
100/100 - 29s - loss: 0.1158 - accuracy: 0.9516 - val_loss: 0.0659 - val_accuracy: 0.9744
Epoch 15/15
100/100 - 29s - loss: 0.1168 - accuracy: 0.9591 - val_loss: 0.0788 - val_accuracy: 0.9669

Plot results

  • Plot training and validation accuracy
  • Plot training and validation loss
In [14]:
import matplotlib.pyplot as plt
#-----------------------------------------------------------
# Retrieve a list of list results on training and test data
# sets for each training epoch
#-----------------------------------------------------------
acc      = history.history[     'accuracy' ]
val_acc  = history.history[ 'val_accuracy' ]
loss     = history.history[    'loss' ]
val_loss = history.history['val_loss' ]

epochs   = range(len(acc)) # Get number of epochs

#------------------------------------------------
# Plot training and validation accuracy per epoch
#------------------------------------------------
plt.plot  ( epochs,     acc,label="training accuracy" )
plt.plot  ( epochs, val_acc, label='validation acuracy' )
plt.title ('Training and validation accuracy')
plt.legend()

plt.figure()

#------------------------------------------------
# Plot training and validation loss per epoch
#------------------------------------------------
plt.plot  ( epochs,     loss , label="training loss")
plt.plot  ( epochs, val_loss,label="validation loss" )
plt.title ('Training and validation loss'   )
plt.legend()


I intend to do some interesting stuff with Convolutional Neural Networks.

Watch this space!

See also
1. Architecting a cloud based IP Multimedia System (IMS)
2. Exploring Quantum Gate operations with QCSimulator
3. Big Data 6: The T20 Dance of Apache NiFi and yorkpy
4. The Many Faces of Latency
5. The Clash of the Titans in Test and ODI cricket

To see all posts click Index of posts

Re-working the Lucy Richardson algorithm in OpenCV

Here is my latest attempt at deblurring using the Lucy-Richardson algorithm. For this I looked up the chapter on Iterative deconvolution and the Lucy Richardson algorithm in scribd.

As mentioned in my previous posts the blurred image can be represented as
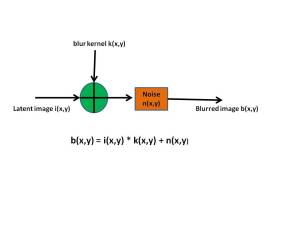
We can represent the ill-posed blurring problem as
b(x,y)  = i(x,y) ** k(x,y) + n(x,y)
where b(x,y) is the blurred image,  i(x,y) the original image, k(x,y) the blur kernel and n(x,y) the noise function. If our estimate of the original image is good then n(x,y) = 0

Hence b(x,y) – i(x,y) ** k(x,y) = 0
If we add i(x,y) to both sides of the equation we have
i(x,y) = i(x,y) + b(x,y) – i(x,y) ** k(x,y)
This can be represented iteratively as
ik+1(x,y) = ik(x,y) + b(x,y) – ik(x,y) ** k(x,y)  (1)

The underlined terms is the error correction.
We have to add the previous estimate with the error correction to get the new estimate.
Now we can seed this by setting ik(x,y) with the blurred image.
Hence our iteration 1 we would substitute
ik(x,y) = b(x,y) in Eqn (1)
So I have done this as follows
I have chosen a blur kernel
double a[9] = {0,40,0,0,40,0,0,40,0};

In the 1st iteration I convolve the blurred image with the kernel
cvFilter2D(im,im_conv_kernel,&kernel1,cvPoint(-1,-1));  – A
To get the error correction I subtract with the convolved term
cvSub(im,im_conv_kernel,im_correction, 0);  – B
Now I add the previous estimate with the error correction to get the new estimate
cvAdd(im,im_correction,im_new_est,NULL);   – C

Finally I repeat the process
im = im_new_est;
im = cvCloneImage(im_new_est);   – D
The convolved image, the error correction and the estimates of the nth iteration is shown below

The 7th,8th and 9th iteration are shown below

Note: You can clone the code from GitHub – An implementation of Lucy-Richardson algorithm in OpenCV

The complete code is given below
// deconvlucy.cpp : Defines the entry point for the console application.
//
// ===================================================================================================================================
// ========================================================Lucy-Richardson algorithm ===================================
//
// Author: Tinniam V Ganesh
// Developed 14 May 2012
// File: deconvlucy.cpp
//=====================================================================================================================================
#include “stdafx.h”
#include “math.h”
#include <cxcore.h>
#include <cv.h>
#include <highgui.h>

#define kappa 10000
int main(int argc, char ** argv)
{
IplImage* im;
IplImage* im_conv_kernel;
IplImage* im_correction;
IplImage* im_new;
IplImage* im_new_est;
IplImage* im1;

char str[80];
int i;
CvMat* cvShowDFT1(IplImage*, int, int,char*);
IplImage* cvShowInvDFT1(IplImage*, CvMat*, int, int,char*);

im1 = cvLoadImage(“kutty-1.jpg”);
cvNamedWindow(“Original-Color”, 0);
cvShowImage(“Original-Color”, im1);
im = cvLoadImage(“kutty-1.jpg”, CV_LOAD_IMAGE_GRAYSCALE );
if( !im )
return -1;

cvNamedWindow(“Original-Gray”, 0);
cvShowImage(“Original-Gray”, im);

// fk+1(x,y) = fk(x,y)

for(i=0;i < 10;i++) {

// Convolve f0(x,y)= g(x,y) with blur kernel
// f0(x,y) ** kernel

// Create a blur kernel
//double a[9]={-1,200,1,-1,200,1,-1,200,1};
//double a[9]={0,-1,0,-1,4,-1,0,-1,0};
//double a[9]={-4,40,4,-4,40,4,-4,40,4};
//double a[9]={-1,2,-1,-1,2,-1,-1,2,-1};
double a[9] = {0,40,0,0,40,0,0,40,0};
CvMat kernel1 = cvMat(3,3,CV_32FC1,a);

// Convolve the kernel with the blurred image as the seed i0(x,y) ** k(x,y)
im_conv_kernel= cvCloneImage(im);
cvFilter2D(im,im_conv_kernel,&kernel1,cvPoint(-1,-1));

cvNamedWindow(“conv”, 0);
cvShowImage(“conv”, im_conv_kernel);

// Subtract from blurred image. Error correction = b(x,y) – ik(x,y) ** k(x.y)
im_correction = cvCreateImage(cvSize(383,357),8,1);;
cvSub(im,im_conv_kernel,im_correction, 0);
cvNamedWindow(“Sub”, 0);
cvShowImage(“Sub”, im_correction);

// Add ik(x,y) with imCorrection – ik(x,y) + b(x,y) – ik(x,y) ** k(x,y)
im_new_est = cvCreateImage(cvSize(383,357),8,1);;
cvAdd(im,im_correction,im_new_est,NULL);

cvNamedWindow(“Add”, 0);
cvShowImage(“Add”, im_new_est);
sprintf(str,”Iteration – %d”,i);
cvNamedWindow(str, 0);
cvShowImage(str, im_new_est);

//Set the estimate as the previous estimate and repeat
im = im_new_est;
im = cvCloneImage(im_new_est);
}
cvWaitKey(-1);
return 0;
}

See also

1. Deblurring with OpenCV: Wiener filter reloaded
2. Dabbling with Wiener filter using OpenCV
3.Experiments with deblurring using OpenCV
4. De-blurring revisited with Wiener filter using OpenCV

You may also like
1.  What’s up Watson? Using IBM Watson’s QAAPI with Bluemix, NodeExpress – Part 1
2.  Bend it like Bluemix, MongoDB with autoscaling – Part 1
3. Informed choices through Machine Learning : Analyzing Kohli, Tendulkar and Dravid
4. A crime map of India in R: Crimes against women

Find me on Google+

Deblurring with OpenCV: Weiner filter reloaded

The problem of deblurring has really caught my fancy though I have only had partial success with it. Deblurring is basically an ill-posed problem where there are 2 unknowns namely the original image and a blurring function. There are many solutions to this problem involving a fair amount of mathematics.

Every now and then I will sneak into some white paper on this topic only to beat a hasty retreat gulping for air as I get drowned in the abstract math. Anyway my search led me to the following presentation “Deblurring in CT (Computer Tomography)” by Kriti Sen Sharma which seemed to make a lot of sense. This presentation shows how a PSF (Point Spread Function or the blur kernel) can blur an image as shown below.

Further it can be shown that the Wiener filter can be represented as
W(u) = P(u*)
——-
|P(u)|^2 + K

Where P(u) is PSD (Point Spread Distribution) of the blur kernel. K is S/N or signal to noise ratio.

For the PSF I took the Gaussian distribution given in Wikipedia – Gaussian blur given by

I tried with various values of SIGMA. The best value was SIGMA = 0.014089642. I get just one pixel with a value of > 0.  This is shown below.

I also tried various values of K. The larger the K the clearer was the DFT INVERSE. This was the best I got.

I am still nowhere near removing the blur but I will get there sometime in the future.
Any and all comments welcome.

Note: You can clone the code from GitHub: Weiner filter reloaded

I am including the code executed with Visual Studio 2010 express

//======================================================================================================================
// Wiener filter implemention using Gaussian blur kernel
// Developed by: Tinniam V Ganesh
// Date: 11 May 2012
//======================================================================================================================
#include “stdafx.h”
#include “math.h”
#include <cxcore.h>
#include <cv.h>
#include <highgui.h>

#define kappa 10000
int main(int argc, char ** argv)
{
int height,width,step,channels,depth;
uchar* data1;
CvMat *dft_A;
CvMat *dft_B;
CvMat *dft_C;
IplImage* im;
IplImage* im1;
IplImage* image_ReB;
IplImage* image_ImB;

IplImage* image_ReC;
IplImage* image_ImC;
IplImage* complex_ImC;
CvScalar val;
IplImage* k_image_hdr;
int i,j,k;

FILE *fp;
fp = fopen(“test.txt”,”w+”);
int dft_M,dft_N;
int dft_M1,dft_N1;

CvMat* cvShowDFT1(IplImage*, int, int,char*);
void cvShowInvDFT1(IplImage*, CvMat*, int, int,char*);

im1 = cvLoadImage(“kutty-1.jpg”);
cvNamedWindow(“Original-Color”, 0);
cvShowImage(“Original-Color”, im1);
im = cvLoadImage(“kutty-1.jpg”, CV_LOAD_IMAGE_GRAYSCALE );
if( !im )
return -1;

cvNamedWindow(“Original-Gray”, 0);
cvShowImage(“Original-Gray”, im);
IplImage* k_image;
int rowLength= 11;
long double kernels[11*11];
CvMat kernel;
int x,y;
long double PI_F=3.14159265358979;

//long double SIGMA = 0.84089642;
long double SIGMA = 0.014089642;
//long double SIGMA = 0.00184089642;
long double EPS = 2.718;
long double numerator,denominator;
long double value,value1;
long double a,b,c,d;

numerator = (pow((float)-3,2) + pow((float) 0,2))/(2*pow((float)SIGMA,2));
printf(“Numerator=%f\n”,numerator);
denominator = sqrt((float) (2 * PI_F * pow(SIGMA,2)));
printf(“denominator=%1.8f\n”,denominator);

value = (pow((float)EPS, (float)-numerator))/denominator;
printf(“Value=%1.8f\n”,value);
for(x = -5; x < 6; x++){
for (y = -5; y < 6; y++)
{
//numerator = (pow((float)x,2) + pow((float) y,2))/(2*pow((float)SIGMA,2));
numerator = (pow((float)x,2) + pow((float)y,2))/(2.0*pow(SIGMA,2));
denominator = sqrt((2.0 * 3.14159265358979 * pow(SIGMA,2)));
value = (pow(EPS,-numerator))/denominator;
printf(” %1.8f “,value);
kernels[x*rowLength +y+55] = (float)value;

}
printf(“\n”);
}
printf(“———————————\n”);
for (i=-5; i < 6; i++){
for(j=-5;j < 6;j++){
printf(” %1.8f “,kernels[i*rowLength +j+55]);
}
printf(“\n”);
}
kernel= cvMat(rowLength, // number of rows
rowLength, // number of columns
CV_32FC1, // matrix data type
&kernels);
k_image_hdr = cvCreateImageHeader( cvSize(rowLength,rowLength), IPL_DEPTH_32F,1);
k_image = cvGetImage(&kernel,k_image_hdr);

height = k_image->height;
width = k_image->width;
step = k_image->widthStep/sizeof(float);
depth = k_image->depth;
channels = k_image->nChannels;
//data1 = (float *)(k_image->imageData);
data1 = (uchar *)(k_image->imageData);
cvNamedWindow(“blur kernel”, 0);
cvShowImage(“blur kernel”, k_image);

dft_M = cvGetOptimalDFTSize( im->height – 1 );
dft_N = cvGetOptimalDFTSize( im->width – 1 );
//dft_M1 = cvGetOptimalDFTSize( im->height+99 – 1 );
//dft_N1 = cvGetOptimalDFTSize( im->width+99 – 1 );
dft_M1 = cvGetOptimalDFTSize( im->height+3 – 1 );
dft_N1 = cvGetOptimalDFTSize( im->width+3 – 1 );
printf(“dft_N1=%d,dft_M1=%d\n”,dft_N1,dft_M1);

// Perform DFT of original image
dft_A = cvShowDFT1(im, dft_M1, dft_N1,”original”);
//Perform inverse (check)
//cvShowInvDFT1(im,dft_A,dft_M1,dft_N1, “original”); – Commented as it overwrites the DFT
// Perform DFT of kernel
dft_B = cvShowDFT1(k_image,dft_M1,dft_N1,”kernel”);
//Perform inverse of kernel (check)
//cvShowInvDFT1(k_image,dft_B,dft_M1,dft_N1, “kernel”);- Commented as it overwrites the DFT
// Multiply numerator with complex conjugate
dft_C = cvCreateMat( dft_M1, dft_N1, CV_64FC2 );
printf(“%d %d %d %d\n”,dft_M,dft_N,dft_M1,dft_N1);

// Multiply DFT(blurred image) * complex conjugate of blur kernel
cvMulSpectrums(dft_A,dft_B,dft_C,CV_DXT_MUL_CONJ);
//cvShowInvDFT1(im,dft_C,dft_M1,dft_N1,”blur1?);

// Split Fourier in real and imaginary parts
image_ReC = cvCreateImage( cvSize(dft_N1, dft_M1), IPL_DEPTH_64F, 1);
image_ImC = cvCreateImage( cvSize(dft_N1, dft_M1), IPL_DEPTH_64F, 1);
complex_ImC = cvCreateImage( cvSize(dft_N1, dft_M1), IPL_DEPTH_64F, 2);
printf(“%d %d %d %d\n”, dft_M,dft_N,dft_M1,dft_N1);
//cvSplit( dft_C, image_ReC, image_ImC, 0, 0 );
cvSplit( dft_C, image_ReC, image_ImC, 0, 0 );

// Compute A^2 + B^2 of denominator or blur kernel
image_ReB = cvCreateImage( cvSize(dft_N1, dft_M1), IPL_DEPTH_64F, 1);
image_ImB = cvCreateImage( cvSize(dft_N1, dft_M1), IPL_DEPTH_64F, 1);

// Split Real and imaginary parts
cvSplit( dft_B, image_ReB, image_ImB, 0, 0 );
cvPow( image_ReB, image_ReB, 2.0);
cvPow( image_ImB, image_ImB, 2.0);
cvAdd(image_ReB, image_ImB, image_ReB,0);
val = cvScalarAll(kappa);
cvAddS(image_ReB,val,image_ReB,0);
//Divide Numerator/A^2 + B^2
cvDiv(image_ReC, image_ReB, image_ReC, 1.0);
cvDiv(image_ImC, image_ReB, image_ImC, 1.0);

// Merge Real and complex parts
cvMerge(image_ReC, image_ImC, NULL, NULL, complex_ImC);
// Perform Inverse
cvShowInvDFT1(im, (CvMat *)complex_ImC,dft_M1,dft_N1,”Weiner o/p k=10000 SIGMA=0.014089642″);
cvWaitKey(-1);
return 0;
}

CvMat* cvShowDFT1(IplImage* im, int dft_M, int dft_N,char* src)
{
IplImage* realInput;
IplImage* imaginaryInput;
IplImage* complexInput;
CvMat* dft_A, tmp;
IplImage* image_Re;
IplImage* image_Im;
char str[80];
double m, M;
realInput = cvCreateImage( cvGetSize(im), IPL_DEPTH_64F, 1);
imaginaryInput = cvCreateImage( cvGetSize(im), IPL_DEPTH_64F, 1);
complexInput = cvCreateImage( cvGetSize(im), IPL_DEPTH_64F, 2);
cvScale(im, realInput, 1.0, 0.0);
cvZero(imaginaryInput);
cvMerge(realInput, imaginaryInput, NULL, NULL, complexInput);

dft_A = cvCreateMat( dft_M, dft_N, CV_64FC2 );
image_Re = cvCreateImage( cvSize(dft_N, dft_M), IPL_DEPTH_64F, 1);
image_Im = cvCreateImage( cvSize(dft_N, dft_M), IPL_DEPTH_64F, 1);

// copy A to dft_A and pad dft_A with zeros
cvGetSubRect( dft_A, &tmp, cvRect(0,0, im->width, im->height));
cvCopy( complexInput, &tmp, NULL );
if( dft_A->cols > im->width )
{
cvGetSubRect( dft_A, &tmp, cvRect(im->width,0, dft_A->cols – im->width, im->height));
cvZero( &tmp );
}
// no need to pad bottom part of dft_A with zeros because of
// use nonzero_rows parameter in cvDFT() call below

cvDFT( dft_A, dft_A, CV_DXT_FORWARD, complexInput->height );
strcpy(str,”DFT -“);
strcat(str,src);
cvNamedWindow(str, 0);

// Split Fourier in real and imaginary parts
cvSplit( dft_A, image_Re, image_Im, 0, 0 );
// Compute the magnitude of the spectrum Mag = sqrt(Re^2 + Im^2)
cvPow( image_Re, image_Re, 2.0);
cvPow( image_Im, image_Im, 2.0);
cvAdd( image_Re, image_Im, image_Re, NULL);
cvPow( image_Re, image_Re, 0.5 );

// Compute log(1 + Mag)
cvAddS( image_Re, cvScalarAll(1.0), image_Re, NULL ); // 1 + Mag
cvLog( image_Re, image_Re ); // log(1 + Mag)
cvMinMaxLoc(image_Re, &m, &M, NULL, NULL, NULL);
cvScale(image_Re, image_Re, 1.0/(M-m), 1.0*(-m)/(M-m));
cvShowImage(str, image_Re);
return(dft_A);
}

void cvShowInvDFT1(IplImage* im, CvMat* dft_A, int dft_M, int dft_N,char* src)
{
IplImage* realInput;
IplImage* imaginaryInput;
IplImage* complexInput;
IplImage * image_Re;
IplImage * image_Im;
double m, M;
char str[80];
realInput = cvCreateImage( cvGetSize(im), IPL_DEPTH_64F, 1);
imaginaryInput = cvCreateImage( cvGetSize(im), IPL_DEPTH_64F, 1);
complexInput = cvCreateImage( cvGetSize(im), IPL_DEPTH_64F, 2);
image_Re = cvCreateImage( cvSize(dft_N, dft_M), IPL_DEPTH_64F, 1);
image_Im = cvCreateImage( cvSize(dft_N, dft_M), IPL_DEPTH_64F, 1);

//cvDFT( dft_A, dft_A, CV_DXT_INV_SCALE, complexInput->height );
cvDFT( dft_A, dft_A, CV_DXT_INV_SCALE, dft_M);
strcpy(str,”DFT INVERSE – “);
strcat(str,src);
cvNamedWindow(str, 0);
// Split Fourier in real and imaginary parts
cvSplit( dft_A, image_Re, image_Im, 0, 0 );
// Compute the magnitude of the spectrum Mag = sqrt(Re^2 + Im^2)
cvPow( image_Re, image_Re, 2.0);
cvPow( image_Im, image_Im, 2.0);
cvAdd( image_Re, image_Im, image_Re, NULL);
cvPow( image_Re, image_Re, 0.5 );

// Compute log(1 + Mag)
cvAddS( image_Re, cvScalarAll(1.0), image_Re, NULL ); // 1 + Mag
cvLog( image_Re, image_Re ); // log(1 + Mag)
cvMinMaxLoc(image_Re, &m, &M, NULL, NULL, NULL);
cvScale(image_Re, image_Re, 1.0/(M-m), 1.0*(-m)/(M-m));
//cvCvtColor(image_Re, image_Re, CV_GRAY2RGBA);
cvShowImage(str, image_Re);
}

See also
– Experiments with deblurring using OpenCV
– De-blurring revisited with Wiener filter using OpenCV
–  Dabbling with Wiener filter using OpenCV
– Re-working the Lucy-Richardson Algorithm in OpenCV

You may also like
1.  What’s up Watson? Using IBM Watson’s QAAPI with Bluemix, NodeExpress – Part 1
2.  Bend it like Bluemix, MongoDB with autoscaling – Part 1
3. Informed choices through Machine Learning : Analyzing Kohli, Tendulkar and Dravid
4. A crime map of India in R: Crimes against women

Find me on Google+

De-blurring revisited with Wiener filter using OpenCV

In this post I continue to experiment with the de-blurring of images using the Wiener filter. For details on the Wiener filter, please look at my earlier post “Dabbling with Wiener filter using OpenCV”.  Thanks to Egli Simon, Switzerland for pointing out a bug in the earlier post which I have now fixed.  The Wiener filter attempts to de-blur by assuming that the source signal is convolved with a blur kernel in the presence of noise.   I have also included the blur kernel as estimated by E. Simon in the code. I am including the de-blurring with 3 different blur kernel radii and different values for the Wiener constant K.  While the de-blurring is still a long way off there is some success.

One of the reasons I have assumed a non-blind blur kernel and try to de-convolve with that. The Wiener filter tries to minimize the Mean Square Error (MSE)  which can be expressed as
e(f) = E[X(f) – X1(f)]^2                                – (1)

where e(f) is the Mean Square Error(MSE) in the frequency domain, X(f) is the original image and X1(f) is the estimated signal which we get by de-convolving the Wiener filter with the observed blurred image i.e. and E[] is the expectation

X1(f) = G(f) * Y(f)                                        -(2)
where G(f) is the Wiener de-convolution filter and Y(f) is the observed blurred image
Substituting (2) in (1) we get
e(f) = E[X(f) – G(f) *Y(f)]^2

If the above equation is solved we can effectively remove the blur.
Feel free to post comments, opinions or ideas.

Watch this space …
I will be back! Hasta la Vista!


Note: You can clone the code below from Git Hib – Another implementation of Weiner filter in OpenCV

The complete code is included below and should work as is

/*
============================================================================
Name : deblur_wiener.c
Author : Tinniam V Ganesh & Egli Simon
Version :
Copyright :
Description : Implementation of Wiener filter in OpenCV
============================================================================
*/

#include <stdio.h>
#include <stdlib.h>
#include “cxcore.h”
#include “cv.h”
#include “highgui.h”

#define kappa 10.0
#define rad 8

int main(int argc, char ** argv)
{
int height,width,step,channels,depth;
uchar* data1;

CvMat *dft_A;
CvMat *dft_B;

CvMat *dft_C;
IplImage* im;
IplImage* im1;

IplImage* image_ReB;
IplImage* image_ImB;

IplImage* image_ReC;
IplImage* image_ImC;
IplImage* complex_ImC;
CvScalar val;

IplImage* k_image_hdr;
int i,j,k;
char str[80];
FILE *fp;
fp = fopen(“test.txt”,”w+”);

int dft_M,dft_N;
int dft_M1,dft_N1;

CvMat* cvShowDFT1(IplImage*, int, int,char*);
void cvShowInvDFT1(IplImage*, CvMat*, int, int,char*);

im1 = cvLoadImage( “kutty-1.jpg”,1 );
cvNamedWindow(“Original-color”, 0);
cvShowImage(“Original-color”, im1);
im = cvLoadImage( “kutty-1.jpg”, CV_LOAD_IMAGE_GRAYSCALE );
if( !im )
return -1;

cvNamedWindow(“Original-gray”, 0);
cvShowImage(“Original-gray”, im);

// Create a random noise matrix
fp = fopen(“test.txt”,”w+”);
int val_noise[357*383];
for(i=0; i <im->height;i++){
for(j=0;j<im->width;j++){
fprintf(fp, “%d “,(383*i+j));
val_noise[383*i+j] = rand() % 128;
}
fprintf(fp, “\n”);
}

CvMat noise = cvMat(im->height,im->width, CV_8UC1,val_noise);

// Add the random noise matric to the image
cvAdd(im,&noise,im, 0);

cvNamedWindow(“Original + Noise”, 0);
cvShowImage(“Original + Noise”, im);

cvSmooth( im, im, CV_GAUSSIAN, 7, 7, 0.5, 0.5 );
cvNamedWindow(“Gaussian Smooth”, 0);
cvShowImage(“Gaussian Smooth”, im);

// Create a blur kernel
IplImage* k_image;
float r = rad;
float radius=((int)(r)*2+1)/2.0;

int rowLength=(int)(2*radius);
printf(“rowlength %d\n”,rowLength);
float kernels[rowLength*rowLength];
printf(“rowl: %i”,rowLength);
int norm=0; //Normalization factor
int x,y;
CvMat kernel;
for(x = 0; x < rowLength; x++)
for (y = 0; y < rowLength; y++)
if (sqrt((x – (int)(radius) ) * (x – (int)(radius) ) + (y – (int)(radius))* (y – (int)(radius))) <= (int)(radius))
norm++;
// Populate matrix
for (y = 0; y < rowLength; y++) //populate array with values
{
for (x = 0; x < rowLength; x++) {
if (sqrt((x – (int)(radius) ) * (x – (int)(radius) ) + (y – (int)(radius))
* (y – (int)(radius))) <= (int)(radius)) {
//kernels[y * rowLength + x] = 255;
kernels[y * rowLength + x] =1.0/norm;
printf(“%f “,1.0/norm);
}
else{
kernels[y * rowLength + x] =0;
}
}
}

/*for (i=0; i < rowLength; i++){
for(j=0;j < rowLength;j++){
printf(“%f “, kernels[i*rowLength +j]);
}
}*/

kernel= cvMat(rowLength, // number of rows
rowLength, // number of columns
CV_32FC1, // matrix data type
&kernels);
k_image_hdr = cvCreateImageHeader( cvSize(rowLength,rowLength), IPL_DEPTH_32F,1);
k_image = cvGetImage(&kernel,k_image_hdr);

height = k_image->height;
width = k_image->width;
step = k_image->widthStep/sizeof(float);
depth = k_image->depth;

channels = k_image->nChannels;
//data1 = (float *)(k_image->imageData);
data1 = (uchar *)(k_image->imageData);
cvNamedWindow(“blur kernel”, 0);
cvShowImage(“blur kernel”, k_image);

dft_M = cvGetOptimalDFTSize( im->height – 1 );
dft_N = cvGetOptimalDFTSize( im->width – 1 );

//dft_M1 = cvGetOptimalDFTSize( im->height+99 – 1 );
//dft_N1 = cvGetOptimalDFTSize( im->width+99 – 1 );

dft_M1 = cvGetOptimalDFTSize( im->height+3 – 1 );
dft_N1 = cvGetOptimalDFTSize( im->width+3 – 1 );

printf(“dft_N1=%d,dft_M1=%d\n”,dft_N1,dft_M1);

// Perform DFT of original image
dft_A = cvShowDFT1(im, dft_M1, dft_N1,”original”);
//Perform inverse (check)
//cvShowInvDFT1(im,dft_A,dft_M1,dft_N1, “original”); – Commented as it overwrites the DFT

// Perform DFT of kernel
dft_B = cvShowDFT1(k_image,dft_M1,dft_N1,”kernel”);
//Perform inverse of kernel (check)
//cvShowInvDFT1(k_image,dft_B,dft_M1,dft_N1, “kernel”);- Commented as it overwrites the DFT

// Multiply numerator with complex conjugate
dft_C = cvCreateMat( dft_M1, dft_N1, CV_64FC2 );

printf(“%d %d %d %d\n”,dft_M,dft_N,dft_M1,dft_N1);

// Multiply DFT(blurred image) * complex conjugate of blur kernel
cvMulSpectrums(dft_A,dft_B,dft_C,CV_DXT_MUL_CONJ);
//cvShowInvDFT1(im,dft_C,dft_M1,dft_N1,”blur1″);

// Split Fourier in real and imaginary parts
image_ReC = cvCreateImage( cvSize(dft_N1, dft_M1), IPL_DEPTH_64F, 1);
image_ImC = cvCreateImage( cvSize(dft_N1, dft_M1), IPL_DEPTH_64F, 1);
complex_ImC = cvCreateImage( cvSize(dft_N1, dft_M1), IPL_DEPTH_64F, 2);
printf(“%d %d %d %d\n”,dft_M,dft_N,dft_M1,dft_N1);

//cvSplit( dft_C, image_ReC, image_ImC, 0, 0 );
cvSplit( dft_C, image_ReC, image_ImC, 0, 0 );

// Compute A^2 + B^2 of denominator or blur kernel
image_ReB = cvCreateImage( cvSize(dft_N1, dft_M1), IPL_DEPTH_64F, 1);
image_ImB = cvCreateImage( cvSize(dft_N1, dft_M1), IPL_DEPTH_64F, 1);

// Split Real and imaginary parts
cvSplit( dft_B, image_ReB, image_ImB, 0, 0 );
cvPow( image_ReB, image_ReB, 2.0);
cvPow( image_ImB, image_ImB, 2.0);
cvAdd(image_ReB, image_ImB, image_ReB,0);
val = cvScalarAll(kappa);
cvAddS(image_ReB,val,image_ReB,0);

//Divide Numerator/A^2 + B^2
cvDiv(image_ReC, image_ReB, image_ReC, 1.0);
cvDiv(image_ImC, image_ReB, image_ImC, 1.0);

// Merge Real and complex parts
cvMerge(image_ReC, image_ImC, NULL, NULL, complex_ImC);
sprintf(str,”O/P Wiener – K=%6.4f rad=%d”,kappa,rad);

// Perform Inverse
cvShowInvDFT1(im, (CvMat *)complex_ImC,dft_M1,dft_N1,str);

cvWaitKey(-1);
return 0;
}

CvMat* cvShowDFT1(IplImage* im, int dft_M, int dft_N,char* src)
{
IplImage* realInput;
IplImage* imaginaryInput;
IplImage* complexInput;
CvMat* dft_A, tmp;
IplImage* image_Re;
IplImage* image_Im;
char str[80];
double m, M;
realInput = cvCreateImage( cvGetSize(im), IPL_DEPTH_64F, 1);
imaginaryInput = cvCreateImage( cvGetSize(im), IPL_DEPTH_64F, 1);
complexInput = cvCreateImage( cvGetSize(im), IPL_DEPTH_64F, 2);
cvScale(im, realInput, 1.0, 0.0);
cvZero(imaginaryInput);
cvMerge(realInput, imaginaryInput, NULL, NULL, complexInput);

dft_A = cvCreateMat( dft_M, dft_N, CV_64FC2 );
image_Re = cvCreateImage( cvSize(dft_N, dft_M), IPL_DEPTH_64F, 1);
image_Im = cvCreateImage( cvSize(dft_N, dft_M), IPL_DEPTH_64F, 1);

// copy A to dft_A and pad dft_A with zeros
cvGetSubRect( dft_A, &tmp, cvRect(0,0, im->width, im->height));
cvCopy( complexInput, &tmp, NULL );
if( dft_A->cols > im->width )
{
cvGetSubRect( dft_A, &tmp, cvRect(im->width,0, dft_A->cols – im->width, im->height));
cvZero( &tmp );
}

// no need to pad bottom part of dft_A with zeros because of
// use nonzero_rows parameter in cvDFT() call below
cvDFT( dft_A, dft_A, CV_DXT_FORWARD, complexInput->height );
strcpy(str,”DFT -“);
strcat(str,src);
cvNamedWindow(str, 0);

// Split Fourier in real and imaginary parts
cvSplit( dft_A, image_Re, image_Im, 0, 0 );

// Compute the magnitude of the spectrum Mag = sqrt(Re^2 + Im^2)
cvPow( image_Re, image_Re, 2.0);
cvPow( image_Im, image_Im, 2.0);
cvAdd( image_Re, image_Im, image_Re, NULL);
cvPow( image_Re, image_Re, 0.5 );

// Compute log(1 + Mag)
cvAddS( image_Re, cvScalarAll(1.0), image_Re, NULL ); // 1 + Mag
cvLog( image_Re, image_Re ); // log(1 + Mag)

cvMinMaxLoc(image_Re, &m, &M, NULL, NULL, NULL);
cvScale(image_Re, image_Re, 1.0/(M-m), 1.0*(-m)/(M-m));
cvShowImage(str, image_Re);
return(dft_A);
}

void cvShowInvDFT1(IplImage* im, CvMat* dft_A, int dft_M, int dft_N,char* src)
{
IplImage* realInput;
IplImage* imaginaryInput;
IplImage* complexInput;
IplImage * image_Re;
IplImage * image_Im;
double m, M;
char str[80];
realInput = cvCreateImage( cvGetSize(im), IPL_DEPTH_64F, 1);
imaginaryInput = cvCreateImage( cvGetSize(im), IPL_DEPTH_64F, 1);
complexInput = cvCreateImage( cvGetSize(im), IPL_DEPTH_64F, 2);
image_Re = cvCreateImage( cvSize(dft_N, dft_M), IPL_DEPTH_64F, 1);
image_Im = cvCreateImage( cvSize(dft_N, dft_M), IPL_DEPTH_64F, 1);

//cvDFT( dft_A, dft_A, CV_DXT_INV_SCALE, complexInput->height );
cvDFT( dft_A, dft_A, CV_DXT_INV_SCALE, dft_M);
strcpy(str,”DFT INVERSE – “);
strcat(str,src);
cvNamedWindow(str, 0);

// Split Fourier in real and imaginary parts
cvSplit( dft_A, image_Re, image_Im, 0, 0 );

// Compute the magnitude of the spectrum Mag = sqrt(Re^2 + Im^2)
cvPow( image_Re, image_Re, 2.0);
cvPow( image_Im, image_Im, 2.0);
cvAdd( image_Re, image_Im, image_Re, NULL);
cvPow( image_Re, image_Re, 0.5 );

// Compute log(1 + Mag)
cvAddS( image_Re, cvScalarAll(1.0), image_Re, NULL ); // 1 + Mag
cvLog( image_Re, image_Re ); // log(1 + Mag)

cvMinMaxLoc(image_Re, &m, &M, NULL, NULL, NULL);
cvScale(image_Re, image_Re, 1.0/(M-m), 1.0*(-m)/(M-m));
//cvCvtColor(image_Re, image, CV_GRAY2RGBA);
cvShowImage(str, image_Re);
}
See also
– De-blurring revisited with Wiener filter using OpenCV
–  Dabbling with Wiener filter using OpenCV
– Deblurring with OpenCV: Wiener filter reloaded
– Re-working the Lucy-Richardson Algorithm in OpenCV

You may also like
1.  What’s up Watson? Using IBM Watson’s QAAPI with Bluemix, NodeExpress – Part 1
2.  Bend it like Bluemix, MongoDB with autoscaling – Part 1
3. Informed choices through Machine Learning : Analyzing Kohli, Tendulkar and Dravid
4. A crime map of India in R: Crimes against women

Find me on Google+

Dabbling with Wiener filter using OpenCV

The technique of reduction of blur and restoration of images is an extremely important field of study and finds numerous applications in medical imaging and astronomy.  One such technique is Wiener filter named after the originator of the technique Prof. Norbert Wiener (1894-1964).  It is usually important to consider these techniques in the frequency domain.

This can be represented diagrammatically as follows

Given that we have
b(x,y) = i(x,y) * k(x,y) + n(x,y)                                       – (1)
where b(x,y) is the blurred image, i(x,y) is the latent image, k(x,y) is the blur kernel and n(x,y) is random noise.
The above in frequency domain can be written as
B(u,v) = I(u,v) * K(u,v) + N(u,v)                                     –  (2)
Inv K(u,v) represents the inverse of the blur kernel and can be determined  from equation (2) by disregarding the noise.  However the inverse filter has high gain at low frequencies and hence tends to amplify noise at these low frequencies.
Wiener filter and Butterworth filter try to minimize these
Wiener filter attempts to minimize the Mean Squared Error (MSE) of the following equation
e^2 = E[( i(x,y)   – mean (i (x,y))^2]

The frequency domain expression for this
T(u,v)           =
K*(u,v)
——–                                                   -(3)
| K(u,v)|^2 + Sn(u,v)/Sf(u,v)
Where T(u,v) is the Wiener filter
K*(u,v) is the complex conjugate of the blur kernel
|K(u,v)|^2  = k^2 + m^2 where k and m are the coefficients of the real and imaginary parts of the blur kernel
Sn(u,v) is the power spectra of noise
Sf(u,v) is the power spectra of the signal
Equation (3) can be represented as
T(u,v)            =
K*(u,v)
——–                                                   –   (4)
| K(u,v)|^2 +  L
Where L is a small positive value
Eqn(4) represents Wiener filter

The lecture  “Image deblurring by Frequency Domain Operations” by Prof. Harvey Rhody is worth a read.
One thing that puzzles me is the Wiener filter is the inverse of the blur kernel with the additional factor of ‘L’ in the denominator. The contribution of the factor ‘L’ will be small, so the Wiener filter appears to be the same as a regular inverse filter. I am probably missing something here(??).

You can clone the code below from Git Hub – Weiner filter with OpenCV

The steps to create the Wiener filter were as follow

1. Create the gray image of the blurred original

2. Add additive noise to the blurred original

      // Add the random noise matric to the image
	cvAdd(im,&noise,im, 0);
3.Gaussian smooth the noisy blurred image
   cvSmooth( im, im, CV_GAUSSIAN, 7, 7, 0.5, 0.5 );
4.Perform DFT and inverse DFT (to check) of the original image (noisy, blurred image)
  // Perform DFT of original image
  dft_A = cvShowDFT1(im, dft_M1, dft_N1,"original");
  //Perform inverse (check)
  cvShowInvDFT1(im,dft_A,dft_M1,dft_N1, "original");
5.Perform DFT and inverse DFT of blur kernel
  // Perform DFT of kernel
  dft_B = cvShowDFT1(k_image,dft_M1,dft_N1,"kernel");
  //Perform inverse of kernel (check)
  cvShowInvDFT1(k_image,dft_B,dft_M1,dft_N1, "kernel");

6.Multiply DFT of original with complex conjugate of blur kernel
   // Multiply numerator with complex conjugate
  dft_C = cvCreateMat( dft_M1, dft_N1, CV_64FC2 );
7.Calculate modulus of blur kernel (denominator)
  // Split Real and imaginary parts
  cvSplit( dft_B, image_ReB, image_ImB, 0, 0 );
  cvPow( image_ReB, image_ReB, 2.0);
  cvPow( image_ImB, image_ImB, 2.0);
  cvAdd(image_ReB, image_ImB, image_ReB,0);
8.Add Wiener constant to modulus of blur kernel (denominator)
 val = cvScalarAll(0.00001);
  cvAddS(image_ReB,val,image_ReB,0);
9.Divide the numerator with the denominator
 //Divide Numerator/A^2 + B^2
  cvDiv(image_ReC, image_ReB, image_ReC, 1.0);
  cvDiv(image_ImC, image_ReB, image_ImC, 1.0);
10.Perform inverse DFT of the filtered signal

// Perform Inverse

 cvShowInvDFT1(im, (CvMat *)complex_ImC,dft_M1,dft_N1,"Output - Wiener filter");

There is still a residual amount of blur (do also read De-blurring revisited with Wiener filter using OpenCV). This can be tried for different values of the Wiener introduced noise.
Note: I would like to give special thanks to Egli Simon who identified the bug in my previous version of the code. The line to display the inverse DFT of the original image & the blur kernel overwrote the DFT contents and I was not getting the Wiener filter to work
Note: You can clone the code below from Git Hub – Weiner filter with OpenCV
The complete code is given below (re-worked and should work as is)
/*
============================================================================
Name : wiener1.c
Author : Tinniam V Ganesh & Egli Simon
Version :
Copyright :
Description : Wiener filter implementation in OpenCV (22 Nov 2011)
============================================================================
*/
#include <stdio.h>
#include <stdlib.h>
#include “cxcore.h”
#include “cv.h”
#include “highgui.h”

#define kappa 1
#define rad 2
int main(int argc, char ** argv)
{
int height,width,step,channels,depth;
uchar* data1;
CvMat *dft_A;
CvMat *dft_B;
CvMat *dft_C;
IplImage* im;
IplImage* im1;
IplImage* image_ReB;
IplImage* image_ImB;
IplImage* image_ReC;
IplImage* image_ImC;
IplImage* complex_ImC;
CvScalar val;
IplImage* k_image_hdr;
int i,j,k;

FILE *fp;
fp = fopen(“test.txt”,”w+”);

int dft_M,dft_N;
int dft_M1,dft_N1;
CvMat* cvShowDFT1(IplImage*, int, int,char*);
void cvShowInvDFT1(IplImage*, CvMat*, int, int,char*);
im1 = cvLoadImage( “kutty-1.jpg”,1 );
cvNamedWindow(“Original-color”, 0);
cvShowImage(“Original-color”, im1);
im = cvLoadImage( “kutty-1.jpg”, CV_LOAD_IMAGE_GRAYSCALE );
if( !im )
return -1;
cvNamedWindow(“Original-gray”, 0);
cvShowImage(“Original-gray”, im);

// Create a random noise matrix
fp = fopen(“test.txt”,”w+”);
int val_noise[357*383];
for(i=0; i <im->height;i++){
for(j=0;j<im->width;j++){
fprintf(fp, “%d “,(383*i+j));
val_noise[383*i+j] = rand() % 128;
}
fprintf(fp, “\n”);
}

CvMat noise = cvMat(im->height,im->width, CV_8UC1,val_noise);

// Add the random noise matric to the image
cvAdd(im,&noise,im, 0);
cvNamedWindow(“Original + Noise”, 0);
cvShowImage(“Original + Noise”, im);
cvSmooth( im, im, CV_GAUSSIAN, 7, 7, 0.5, 0.5 );
cvNamedWindow(“Gaussian Smooth”, 0);
cvShowImage(“Gaussian Smooth”, im);

// Create a blur kernel
IplImage* k_image;
float r = rad;
float radius=((int)(r)*2+1)/2.0;
int rowLength=(int)(2*radius);
printf(“rowlength %d\n”,rowLength);
float kernels[rowLength*rowLength];
printf(“rowl: %i”,rowLength);
int norm=0; //Normalization factor
int x,y;
CvMat kernel;
for(x = 0; x < rowLength; x++)
for (y = 0; y < rowLength; y++)
if (sqrt((x – (int)(radius) ) * (x – (int)(radius) ) + (y – (int)(radius))* (y – (int)(radius))) <= (int)(radius))
norm++;
// Populate matrix
for (y = 0; y < rowLength; y++) //populate array with values
{
for (x = 0; x < rowLength; x++) {
if (sqrt((x – (int)(radius) ) * (x – (int)(radius) ) + (y – (int)(radius))
* (y – (int)(radius))) <= (int)(radius)) {
//kernels[y * rowLength + x] = 255;
kernels[y * rowLength + x] =1.0/norm;
printf(“%f “,1.0/norm);
}
else{
kernels[y * rowLength + x] =0;
}
}
}

/*for (i=0; i < rowLength; i++){
for(j=0;j < rowLength;j++){
printf(“%f “, kernels[i*rowLength +j]);
}
}*/

kernel= cvMat(rowLength, // number of rows
rowLength, // number of columns
CV_32FC1, // matrix data type
&kernels);
k_image_hdr = cvCreateImageHeader( cvSize(rowLength,rowLength), IPL_DEPTH_32F,1);
k_image = cvGetImage(&kernel,k_image_hdr);

height = k_image->height;
width = k_image->width;
step = k_image->widthStep/sizeof(float);
depth = k_image->depth;

channels = k_image->nChannels;
//data1 = (float *)(k_image->imageData);
data1 = (uchar *)(k_image->imageData);
cvNamedWindow(“blur kernel”, 0);
cvShowImage(“blur kernel”, k_image);

dft_M = cvGetOptimalDFTSize( im->height – 1 );
dft_N = cvGetOptimalDFTSize( im->width – 1 );

//dft_M1 = cvGetOptimalDFTSize( im->height+99 – 1 );
//dft_N1 = cvGetOptimalDFTSize( im->width+99 – 1 );

dft_M1 = cvGetOptimalDFTSize( im->height+3 – 1 );
dft_N1 = cvGetOptimalDFTSize( im->width+3 – 1 );

printf(“dft_N1=%d,dft_M1=%d\n”,dft_N1,dft_M1);

// Perform DFT of original image
dft_A = cvShowDFT1(im, dft_M1, dft_N1,”original”);
//Perform inverse (check)
//cvShowInvDFT1(im,dft_A,dft_M1,dft_N1, “original”); – Commented as it overwrites the DFT

// Perform DFT of kernel
dft_B = cvShowDFT1(k_image,dft_M1,dft_N1,”kernel”);
//Perform inverse of kernel (check)
//cvShowInvDFT1(k_image,dft_B,dft_M1,dft_N1, “kernel”);- Commented as it overwrites the DFT

// Multiply numerator with complex conjugate
dft_C = cvCreateMat( dft_M1, dft_N1, CV_64FC2 );

printf(“%d %d %d %d\n”,dft_M,dft_N,dft_M1,dft_N1);

// Multiply DFT(blurred image) * complex conjugate of blur kernel
cvMulSpectrums(dft_A,dft_B,dft_C,CV_DXT_MUL_CONJ);
//cvShowInvDFT1(im,dft_C,dft_M1,dft_N1,”blur1″);

// Split Fourier in real and imaginary parts
image_ReC = cvCreateImage( cvSize(dft_N1, dft_M1), IPL_DEPTH_64F, 1);
image_ImC = cvCreateImage( cvSize(dft_N1, dft_M1), IPL_DEPTH_64F, 1);
complex_ImC = cvCreateImage( cvSize(dft_N1, dft_M1), IPL_DEPTH_64F, 2);

printf(“%d %d %d %d\n”,dft_M,dft_N,dft_M1,dft_N1);

//cvSplit( dft_C, image_ReC, image_ImC, 0, 0 );
cvSplit( dft_C, image_ReC, image_ImC, 0, 0 );

// Compute A^2 + B^2 of denominator or blur kernel
image_ReB = cvCreateImage( cvSize(dft_N1, dft_M1), IPL_DEPTH_64F, 1);
image_ImB = cvCreateImage( cvSize(dft_N1, dft_M1), IPL_DEPTH_64F, 1);

// Split Real and imaginary parts
cvSplit( dft_B, image_ReB, image_ImB, 0, 0 );
cvPow( image_ReB, image_ReB, 2.0);
cvPow( image_ImB, image_ImB, 2.0);
cvAdd(image_ReB, image_ImB, image_ReB,0);

val = cvScalarAll(kappa);
cvAddS(image_ReB,val,image_ReB,0);

//Divide Numerator/A^2 + B^2
cvDiv(image_ReC, image_ReB, image_ReC, 1.0);
cvDiv(image_ImC, image_ReB, image_ImC, 1.0);

// Merge Real and complex parts
cvMerge(image_ReC, image_ImC, NULL, NULL, complex_ImC);

// Perform Inverse
cvShowInvDFT1(im, (CvMat *)complex_ImC,dft_M1,dft_N1,”O/p Wiener k=1 rad=2″);

cvWaitKey(-1);
return 0;
}

CvMat* cvShowDFT1(IplImage* im, int dft_M, int dft_N,char* src)
{
IplImage* realInput;
IplImage* imaginaryInput;
IplImage* complexInput;

CvMat* dft_A, tmp;

IplImage* image_Re;
IplImage* image_Im;

char str[80];

double m, M;

realInput = cvCreateImage( cvGetSize(im), IPL_DEPTH_64F, 1);
imaginaryInput = cvCreateImage( cvGetSize(im), IPL_DEPTH_64F, 1);
complexInput = cvCreateImage( cvGetSize(im), IPL_DEPTH_64F, 2);
cvScale(im, realInput, 1.0, 0.0);
cvZero(imaginaryInput);
cvMerge(realInput, imaginaryInput, NULL, NULL, complexInput);
dft_A = cvCreateMat( dft_M, dft_N, CV_64FC2 );
image_Re = cvCreateImage( cvSize(dft_N, dft_M), IPL_DEPTH_64F, 1);
image_Im = cvCreateImage( cvSize(dft_N, dft_M), IPL_DEPTH_64F, 1);
// copy A to dft_A and pad dft_A with zeros
cvGetSubRect( dft_A, &tmp, cvRect(0,0, im->width, im->height));
cvCopy( complexInput, &tmp, NULL );
if( dft_A->cols > im->width )
{
cvGetSubRect( dft_A, &tmp, cvRect(im->width,0, dft_A->cols – im->width, im->height));
cvZero( &tmp );
}

// no need to pad bottom part of dft_A with zeros because of
// use nonzero_rows parameter in cvDFT() call below

cvDFT( dft_A, dft_A, CV_DXT_FORWARD, complexInput->height );

strcpy(str,”DFT -“);
strcat(str,src);
cvNamedWindow(str, 0);

// Split Fourier in real and imaginary parts
cvSplit( dft_A, image_Re, image_Im, 0, 0 );
// Compute the magnitude of the spectrum Mag = sqrt(Re^2 + Im^2)
cvPow( image_Re, image_Re, 2.0);
cvPow( image_Im, image_Im, 2.0);
cvAdd( image_Re, image_Im, image_Re, NULL);
cvPow( image_Re, image_Re, 0.5 );

// Compute log(1 + Mag)
cvAddS( image_Re, cvScalarAll(1.0), image_Re, NULL ); // 1 + Mag
cvLog( image_Re, image_Re ); // log(1 + Mag)

cvMinMaxLoc(image_Re, &m, &M, NULL, NULL, NULL);
cvScale(image_Re, image_Re, 1.0/(M-m), 1.0*(-m)/(M-m));
cvShowImage(str, image_Re);
return(dft_A);
}

void cvShowInvDFT1(IplImage* im, CvMat* dft_A, int dft_M, int dft_N,char* src)
{

IplImage* realInput;
IplImage* imaginaryInput;
IplImage* complexInput;
IplImage * image_Re;
IplImage * image_Im;
double m, M;
char str[80];

realInput = cvCreateImage( cvGetSize(im), IPL_DEPTH_64F, 1);
imaginaryInput = cvCreateImage( cvGetSize(im), IPL_DEPTH_64F, 1);
complexInput = cvCreateImage( cvGetSize(im), IPL_DEPTH_64F, 2);

image_Re = cvCreateImage( cvSize(dft_N, dft_M), IPL_DEPTH_64F, 1);
image_Im = cvCreateImage( cvSize(dft_N, dft_M), IPL_DEPTH_64F, 1);

//cvDFT( dft_A, dft_A, CV_DXT_INV_SCALE, complexInput->height );
cvDFT( dft_A, dft_A, CV_DXT_INV_SCALE, dft_M);
strcpy(str,”DFT INVERSE – “);
strcat(str,src);
cvNamedWindow(str, 0);

// Split Fourier in real and imaginary parts
cvSplit( dft_A, image_Re, image_Im, 0, 0 );

// Compute the magnitude of the spectrum Mag = sqrt(Re^2 + Im^2)
cvPow( image_Re, image_Re, 2.0);
cvPow( image_Im, image_Im, 2.0);
cvAdd( image_Re, image_Im, image_Re, NULL);
cvPow( image_Re, image_Re, 0.5 );

// Compute log(1 + Mag)
cvAddS( image_Re, cvScalarAll(1.0), image_Re, NULL ); // 1 + Mag
cvLog( image_Re, image_Re ); // log(1 + Mag)

cvMinMaxLoc(image_Re, &m, &M, NULL, NULL, NULL);
cvScale(image_Re, image_Re, 1.0/(M-m), 1.0*(-m)/(M-m));
//cvCvtColor(image_Re, image_Re, CV_GRAY2RGBA);

cvShowImage(str, image_Re);

}

Checkout my book ‘Deep Learning from first principles Second Edition- In vectorized Python, R and Octave’.  My book is available on Amazon  as paperback ($18.99) and in kindle version($9.99/Rs449).

You may also like my companion book “Practical Machine Learning with R and Python:Second Edition- Machine Learning in stereo” available in Amazon in paperback($12.99) and Kindle($9.99/Rs449) versions.

See also
– Experiments with deblurring using OpenCV
–  Dabbling with Wiener filter using OpenCV
– Deblurring with OpenCV: Wiener filter reloaded
– Re-working the Lucy-Richardson Algorithm in OpenCV


Find me on Google+

Experiments with deblurring using OpenCV

Deblurring refers to the removal of the blur from blurred images.  The removal of blur is extremely important in the fields of medical imaging, astronomy etc. In medical imaging this is also known as denoising and finds extensive applications in ultra sonic and CT images.  Similarly in astronomy there is a need to denoise and deblur images that are taken by space telescopes for e.g. the Hubble telescope.

Deblurring is really a tough problem to solve though it has been around for ages. While going through some of the white papers on deblurring I have been particularly fascinated by the results. The blurred images are restored back to its pristine, original sharp image. It is almost magical and is amazing to know that a computer program is able to detect and remove patches, almost bordering on “computer perception”.

However the solution to the problem is very involved. Almost every white paper I read in deblurring techniques involves abstruse mathematical concepts, enough to make one break into ‘cold sweat’ as I did several times. There are several well known methods of removing blur from images. The chief among them are the Richardson-Lucy method, the Weiner filter (do read my post “Dabbling with Wiener filter using OpenCV“), Radon transform or some form Bayesian filtering etc. All of these methods perform the converse of convolution known as de-convolution.  Almost all approaches are based on the following equation

b(x) = k(x) * i(x) + n(x)                           – (1)

Where b(x) – is the blurred image, i(x) is the latent (good) image, k(x) is the blur kernel also known as the Point Spread Function (PSF) and n(x) is random noise.

The key fact to note in the above equation is that the blurred image (b) is a convolution of a good latent image with a blur kernel plus some additive noise. So the good latent image is convolved by a blurring function or the points spread function and results in the blurred image.

Now there are 2 unknowns in the above equation, both the blur kernel and the latent image. To obtain the latent image a process known as de-convolution has to be performed.

If equation (1) is converted to the frequency domain using the Fourier transform on equation (1) we have

B(w) =  K(w) * I(w) + N(w)
Ignoring noise we have
I(w)  = B(w)/K(w)
or
I(w)  = DFT [B(w)]/DFT[K(w)]
Or i(t) = Inverse DFT {[DFT B(w)]/DFT[K(w)]}
If DFT[K(w)] can be represented as A+iB then the above can be represented as
i(t) = Inverse DFT { DFT [B(w)] * (A – iB)}
—————————
A**2 + B**2
where A-iB is the complex conjugate of the DFT of the blur kernel

This is known as de-convolution. There are two types of de-convolution blind and non-blind. In the non-blind de-convolution method an initial blur kernel is assumed and is used to de-blur the image. In the blind convolution an initial estimate of the blur kernel is made and the latent image is successively iterated to obtain the best image. This is based on a method known as maximum-a-posteriori (MAP) to iterate through successive estimations of better and better blur kernels. The Richardson-Lucy algorithm also tries to estimate the blur kernel from the blurred image.

In this post I  perform de-convolution using an estimated blur kernel. As can be seen there is a slight reduction of the blur. By choosing a large kernel probably a 100 x 100 matrix would give a better result.

You can clone this code from GitHub at “Deblurring by deconvolution in OpenCV

Kindly do share any thoughts, ideas that you have. I have included the full code for this. Feel free to use the code and tweak it as you see fit and please share any findings you come across.

Steps in the de-convolution process

  1. Perform DFT on blurred image. Also perform Inverse DFT to verify whether the process of DFT is correct or not. Make sure that the line for performing the inverse is commented out as it overwrites the DFT array.
           // Perform DFT of original image
		dft_A = cvShowDFT(im, dft_M1, dft_N1,"original");
		//Perform inverse (check)
		cvShowInvDFT(im,dft_A,dft_M1,dft_N1,fp, "original");

2. Perform DFT on blur kernel. Also perform inverse DFT to get back original contents. Make sure that the line for performing the inverse is commented out as it overwrites the DFT array.

		// Perform DFT of kernel
		dft_B = cvShowDFT(k_image,dft_M1,dft_N1,"kernel");
		//Perform inverse of kernel (check)
		cvShowInvDFT(k_image,dft_B,dft_M1,dft_N1,fp, "kernel");


    3. Multiply the DFT of image with the complex conjugate of the DFT of the blur kernel
		// Multiply numerator with complex conjugate
		dft_C = cvCreateMat( dft_M1, dft_N1, CV_64FC2 );
     4. Compute A**2 + B**2
		// Split Real and imaginary parts
		cvSplit( dft_B, image_ReB, image_ImB, 0, 0 );
    	        cvPow( image_ReB, image_ReB, 2.0);
		cvPow( image_ImB, image_ImB, 2.0);
		cvAdd(image_ReB, image_ImB, image_ReB,0);
     5. Divide numerator with A**2 + B**2
		//Divide Numerator/A^2 + B^2
		cvDiv(image_ReC, image_ReB, image_ReC, 1.0);
		cvDiv(image_ImC, image_ReB, image_ImC, 1.0);
                  6.Merge real and imaginary parts
		// Merge Real and complex parts
		cvMerge(image_ReC, image_ImC, NULL, NULL, complex_ImC);
         7.Finally perform Inverse DFT
		cvShowInvDFT(im, complex_ImC,dft_M1,dft_N1,fp,"deblur");

I have included the complete re-worked code below for the process of de-convolution. There was a small bug in the initial version. This has been fixed and the code below should work as is.

Note: You can clone this code from GitHub at “Deblurring by deconvolution in OpenCV
Do also take a look at my post “Reworking the Lucy Richardson algorithm in OpenCV
/*
============================================================================
Name : deconv.c
Author : Tinniam V Ganesh
Version :
Copyright :
Description : Deconvolution in OpenCV
============================================================================
*/

#include
#include
#include “cxcore.h”
#include “cv.h”
#include “highgui.h”

int main(int argc, char ** argv)
{
int height,width,step,channels;
uchar* data;
uchar* data1;
int i,j,k;
float s;

CvMat *dft_A;
CvMat *dft_B;
CvMat *dft_C;
IplImage* im;
IplImage* im1;
IplImage* image_ReB;
IplImage* image_ImB;
IplImage* image_ReC;
IplImage* image_ImC;
IplImage* complex_ImC;

IplImage* image_ReDen;
IplImage* image_ImDen;

FILE *fp;
fp = fopen(“test.txt”,”w+”);

int dft_M,dft_N;
int dft_M1,dft_N1;
CvMat* cvShowDFT();
void cvShowInvDFT();

im1 = cvLoadImage( “kutty-1.jpg”,1 );
cvNamedWindow(“original-color”, 0);
cvShowImage(“original-color”, im1);
im = cvLoadImage( “kutty-1.jpg”, CV_LOAD_IMAGE_GRAYSCALE );
if( !im )
return -1;

cvNamedWindow(“original-gray”, 0);
cvShowImage(“original-gray”, im);
// Create blur kernel (non-blind)
//float vals[]={.000625,.000625,.000625,.003125,.003125,.003125,.000625,.000625,.000625};
//float vals[]={-0.167,0.333,0.167,-0.167,.333,.167,-0.167,.333,.167};

float vals[]={.055,.055,.055,.222,.222,.222,.055,.055,.055};
CvMat kernel = cvMat(3, // number of rows
3, // number of columns
CV_32FC1, // matrix data type
vals);
IplImage* k_image_hdr;
IplImage* k_image;

k_image_hdr = cvCreateImageHeader(cvSize(3,3),IPL_DEPTH_64F,2);
k_image = cvCreateImage(cvSize(3,3),IPL_DEPTH_64F,1);
k_image = cvGetImage(&kernel,k_image_hdr);

/*IplImage* k_image;
k_image = cvLoadImage( “kernel4.bmp”,0 );*/
cvNamedWindow(“blur kernel”, 0);

height = k_image->height;
width = k_image->width;
step = k_image->widthStep;

channels = k_image->nChannels;
//data1 = (float *)(k_image->imageData);
data1 = (uchar *)(k_image->imageData);

cvShowImage(“blur kernel”, k_image);

dft_M = cvGetOptimalDFTSize( im->height – 1 );
dft_N = cvGetOptimalDFTSize( im->width – 1 );

//dft_M1 = cvGetOptimalDFTSize( im->height+99 – 1 );
//dft_N1 = cvGetOptimalDFTSize( im->width+99 – 1 );

dft_M1 = cvGetOptimalDFTSize( im->height+3 – 1 );
dft_N1 = cvGetOptimalDFTSize( im->width+3 – 1 );

// Perform DFT of original image
dft_A = cvShowDFT(im, dft_M1, dft_N1,”original”);
//Perform inverse (check & comment out) – Commented as it overwrites dft_A
//cvShowInvDFT(im,dft_A,dft_M1,dft_N1,fp, “original”);

// Perform DFT of kernel
dft_B = cvShowDFT(k_image,dft_M1,dft_N1,”kernel”);
//Perform inverse of kernel (check & comment out) – commented as it overwrites dft_B
//cvShowInvDFT(k_image,dft_B,dft_M1,dft_N1,fp, “kernel”);

// Multiply numerator with complex conjugate
dft_C = cvCreateMat( dft_M1, dft_N1, CV_64FC2 );

printf(“%d %d %d %d\n”,dft_M,dft_N,dft_M1,dft_N1);

// Multiply DFT(blurred image) * complex conjugate of blur kernel
cvMulSpectrums(dft_A,dft_B,dft_C,CV_DXT_MUL_CONJ);

// Split Fourier in real and imaginary parts
image_ReC = cvCreateImage( cvSize(dft_N1, dft_M1), IPL_DEPTH_64F, 1);
image_ImC = cvCreateImage( cvSize(dft_N1, dft_M1), IPL_DEPTH_64F, 1);
complex_ImC = cvCreateImage( cvSize(dft_N1, dft_M1), IPL_DEPTH_64F, 2);

printf(“%d %d %d %d\n”,dft_M,dft_N,dft_M1,dft_N1);

//cvSplit( dft_C, image_ReC, image_ImC, 0, 0 );
cvSplit( dft_C, image_ReC, image_ImC, 0, 0 );

// Compute A^2 + B^2 of denominator or blur kernel
image_ReB = cvCreateImage( cvSize(dft_N1, dft_M1), IPL_DEPTH_64F, 1);
image_ImB = cvCreateImage( cvSize(dft_N1, dft_M1), IPL_DEPTH_64F, 1);

// Split Real and imaginary parts
cvSplit( dft_B, image_ReB, image_ImB, 0, 0 );
cvPow( image_ReB, image_ReB, 2.0);
cvPow( image_ImB, image_ImB, 2.0);
cvAdd(image_ReB, image_ImB, image_ReB,0);

//Divide Numerator/A^2 + B^2
cvDiv(image_ReC, image_ReB, image_ReC, 1.0);
cvDiv(image_ImC, image_ReB, image_ImC, 1.0);

// Merge Real and complex parts
cvMerge(image_ReC, image_ImC, NULL, NULL, complex_ImC);

// Perform Inverse
cvShowInvDFT(im, complex_ImC,dft_M1,dft_N1,fp,”deblur”);
cvWaitKey(-1);
return 0;
}

CvMat* cvShowDFT(im, dft_M, dft_N,src)
IplImage* im;
int dft_M, dft_N;
char* src;
{
IplImage* realInput;
IplImage* imaginaryInput;
IplImage* complexInput;

CvMat* dft_A, tmp;

IplImage* image_Re;
IplImage* image_Im;

char str[80];

double m, M;

realInput = cvCreateImage( cvGetSize(im), IPL_DEPTH_64F, 1);
imaginaryInput = cvCreateImage( cvGetSize(im), IPL_DEPTH_64F, 1);
complexInput = cvCreateImage( cvGetSize(im), IPL_DEPTH_64F, 2);

cvScale(im, realInput, 1.0, 0.0);
cvZero(imaginaryInput);
cvMerge(realInput, imaginaryInput, NULL, NULL, complexInput);

dft_A = cvCreateMat( dft_M, dft_N, CV_64FC2 );
image_Re = cvCreateImage( cvSize(dft_N, dft_M), IPL_DEPTH_64F, 1);
image_Im = cvCreateImage( cvSize(dft_N, dft_M), IPL_DEPTH_64F, 1);

// copy A to dft_A and pad dft_A with zeros
cvGetSubRect( dft_A, &tmp, cvRect(0,0, im->width, im->height));
cvCopy( complexInput, &tmp, NULL );
if( dft_A->cols > im->width )
{
cvGetSubRect( dft_A, &tmp, cvRect(im->width,0, dft_A->cols – im->width, im->height));
cvZero( &tmp );
}

// no need to pad bottom part of dft_A with zeros because of
// use nonzero_rows parameter in cvDFT() call below

cvDFT( dft_A, dft_A, CV_DXT_FORWARD, complexInput->height );

strcpy(str,”DFT -“);
strcat(str,src);
cvNamedWindow(str, 0);

// Split Fourier in real and imaginary parts
cvSplit( dft_A, image_Re, image_Im, 0, 0 );

// Compute the magnitude of the spectrum Mag = sqrt(Re^2 + Im^2)
cvPow( image_Re, image_Re, 2.0);
cvPow( image_Im, image_Im, 2.0);
cvAdd( image_Re, image_Im, image_Re, NULL);
cvPow( image_Re, image_Re, 0.5 );

// Compute log(1 + Mag)
cvAddS( image_Re, cvScalarAll(1.0), image_Re, NULL ); // 1 + Mag
cvLog( image_Re, image_Re ); // log(1 + Mag)

cvMinMaxLoc(image_Re, &m, &M, NULL, NULL, NULL);
cvScale(image_Re, image_Re, 1.0/(M-m), 1.0*(-m)/(M-m));
cvShowImage(str, image_Re);
return(dft_A);
}

void cvShowInvDFT(im, dft_A, dft_M, dft_N,fp, src)
IplImage* im;
CvMat* dft_A;
int dft_M,dft_N;
FILE *fp;
char* src;
{

IplImage* realInput;
IplImage* imaginaryInput;
IplImage* complexInput;

IplImage * image_Re;
IplImage * image_Im;

double m, M;
char str[80];

realInput = cvCreateImage( cvGetSize(im), IPL_DEPTH_64F, 1);
imaginaryInput = cvCreateImage( cvGetSize(im), IPL_DEPTH_64F, 1);
complexInput = cvCreateImage( cvGetSize(im), IPL_DEPTH_64F, 2);

image_Re = cvCreateImage( cvSize(dft_N, dft_M), IPL_DEPTH_64F, 1);
image_Im = cvCreateImage( cvSize(dft_N, dft_M), IPL_DEPTH_64F, 1);

//cvDFT( dft_A, dft_A, CV_DXT_INV_SCALE, complexInput->height );
cvDFT( dft_A, dft_A, CV_DXT_INV_SCALE, dft_M);
strcpy(str,”DFT INVERSE – “);
strcat(str,src);
cvNamedWindow(str, 0);

// Split Fourier in real and imaginary parts
cvSplit( dft_A, image_Re, image_Im, 0, 0 );

// Compute the magnitude of the spectrum Mag = sqrt(Re^2 + Im^2)
cvPow( image_Re, image_Re, 2.0);
cvPow( image_Im, image_Im, 2.0);
cvAdd( image_Re, image_Im, image_Re, NULL);
cvPow( image_Re, image_Re, 0.5 );

// Compute log(1 + Mag)
cvAddS( image_Re, cvScalarAll(1.0), image_Re, NULL ); // 1 + Mag
cvLog( image_Re, image_Re ); // log(1 + Mag)

cvMinMaxLoc(image_Re, &m, &M, NULL, NULL, NULL);
cvScale(image_Re, image_Re, 1.0/(M-m), 1.0*(-m)/(M-m));
//cvCvtColor(image_Re, image_Re, CV_GRAY2RGBA);

cvShowImage(str, image_Re);
}


Checkout my book ‘Deep Learning from first principles Second Edition- In vectorized Python, R and Octave’.  My book is available on Amazon  as paperback ($18.99) and in kindle version($9.99/Rs449).

You may also like my companion book “Practical Machine Learning with R and Python:Second Edition- Machine Learning in stereo” available in Amazon in paperback($12.99) and Kindle($9.99/Rs449) versions.

See also

My book ‘Practical Machine Learning with R and Python’ on Amazon
– De-blurring revisited with Wiener filter using OpenCV
–  Dabbling with Wiener filter using OpenCV
– Deblurring with OpenCV: Wiener filter reloaded
– Re-working the Lucy-Richardson Algorithm in OpenCV
You may also like
1.  What’s up Watson? Using IBM Watson’s QAAPI with Bluemix, NodeExpress – Part 1
2.  Bend it like Bluemix, MongoDB with autoscaling – Part 1
3. Informed choices through Machine Learning : Analyzing Kohli, Tendulkar and Dravid
4. A crime map of India in R: Crimes against women

Find me on Google+

OpenCV: Fun with filters and convolution

My initial encounter with filters, convolution and correlation in OpenCV made me play around with the filters for Gaussian smooth, erosion and dilation operations on random image files. However I found the experience rather unsatisfactory and I wanted to get a real feel for the working of these operations. Suddenly a thought struck me. Could I restore an old family photograph of my parents? The photograph has areas of white patches that had to be removed.

So I started to dig a little more into the filters, convolution and correlation matrices to get a better understanding.

This is the original photograph.

My Mom & late Dad
As can be seen there are large patches in several places in the photograph. So I decided to use cvFloodFill to fill these areas.

a)      cvFloodFill: Since I had to identify the spots where these patches occurred I took a dump of the cvMat of the image which I resized to about 29 x 42. By inspecting the data I could see that the patches typically corresponded to intensity values that were greater than 170. So I decided that the cvFloodFill should happen with the seed around these parts.   So the code checks the intensity values > 170 and calls cvFloodFill. After much tweaking I could see that the white patches were now filled with gray (newval intensity= 150.0) So I was able to get rid of the white patches.


b)      cvSmooth: The next step that I took was to perform a Gaussian smooth of the picture. This smoothed out the filled parts


c)       cvErode & cvDilate: I followed this with cvErode to smooth out the dark areas  and cvDilate to smooth out the bright areas.


d)      cvFilter2D:  I wanted to now sharpen the image. I did a lot of experiments with different kernel values but I found this to be extremely difficult to work with. After much trial and error I came with a kernel values of
double a[9]={-1,20,1,-1,20,1,-1,20,1};
The sharpening was reasonable but there are areas where there are white streaks. I still need to figure out a kernel that can sharpen images. For this also to understand what was happening I tried to dump the values of the image to get a feel of where the values lay.


e)      cvSmooth: Finally I performed a cvSmooth of the filtered output.

While I have had fair success there is still a lot more left to be desired from the final version.
The complete process flow

The code is included below

#include “cv.h”
#include “highgui.h”
#include “stdio.h”
int main(int argc, char** argv)
{
IplImage* img = cvLoadImage(“dad_mom.jpg”,0);
IplImage* dst;
IplImage* dst1;
IplImage* dst2;
IplImage* dst3;
IplImage* dst4;
int i,j,k;
int height,width,step,channels;
uchar* data;
uchar* data1;
uchar* outdata;
CvScalar s;
CvScalar lodiff,highdiff,newval;
// get the image data
height    = img->height;
width     = img->width;
step      = img->widthStep;
channels  = img->nChannels;
data      = (uchar *)img->imageData;
double a[9]={-1,20,1,-1,20,1,-1,20,1};
//double a[9]={1/16,1/8,1/16,1/8,1/4,1/8,1/16,1/8,1/16};
double values[9]={1/16,0,-1/16,2/16,0,-2/16,1/16,0,-1/16};
CvPoint seed;
CvMat kernel= cvMat(3,3,CV_32FC1,a);
printf(“Processing a %d x %d image with %d channels\n”,height,width,channels);
// Create windows
cvNamedWindow(“Original”,CV_WINDOW_AUTOSIZE);
cvNamedWindow(“Flood Fill”,CV_WINDOW_AUTOSIZE);
cvNamedWindow(“Smooth”,CV_WINDOW_AUTOSIZE);
cvNamedWindow(“Erode”,CV_WINDOW_AUTOSIZE);
cvNamedWindow(“Dilate”,CV_WINDOW_AUTOSIZE);
cvNamedWindow(“Filter”,CV_WINDOW_AUTOSIZE);
cvNamedWindow(“Smooth1”,CV_WINDOW_AUTOSIZE);
// Original image
cvShowImage(“Original”, img);
/* Flood fill in white patches intensity > 170.0 */
highdiff=cvRealScalar(5.0);
lodiff=cvRealScalar(5.0);
newval=cvRealScalar(150.0);
for(i=0;i<height;i++) {
for(j=0;j<width;j++) {
for(k=0;k<channels;k++) {
//printf(“Data = %d \n”,data[i*step+j*channels+k]);
if((data[i*step+j*channels+k]) > 170.0)
{
seed=cvPoint(j,i);
//printf(“data=%dFlood
seed=%d,%d\n”,data[i*step+j*channels+k],i,j);
cvFloodFill(img,seed,newval,lodiff,highdiff, NULL,CV_FLOODFILL_FIXED_RANGE,NULL);                                                                              }
else
{
;
}
}
}
//printf(“\n”);
}
cvShowImage(“Flood Fill”,img);
// Gaussian smooth
dst = cvCloneImage(img);
cvSmooth( img, dst, CV_GAUSSIAN, 3, 3, 0, 0 );
cvShowImage(“Smooth”,dst);
// Erode the image
dst1 = cvCloneImage(img);
IplConvKernel* kern = cvCreateStructuringElementEx(3,3,1,1,CV_SHAPE_RECT,values);
cvErode(dst,dst1,kern,1);
cvShowImage(“Erode”,dst1);
// Perform dilation operation
dst2 = cvCloneImage(img);
cvDilate(dst1,dst2,kern,1);
cvShowImage(“Dilate”,dst2);
// Filter the image with convolution kernel. Sharpen the image
dst3 = cvCloneImage(img);
printf(“reached here\n”);
cvFilter2D(dst2,dst3,&kernel,cvPoint(-1,-1));
cvShowImage(“Filter”,dst3);
// Smoothen the image
dst4 = cvCloneImage(img);
cvSmooth( dst3, dst4, CV_MEDIAN, 3, 0, 0, 0 );
cvShowImage(“Smooth1”,dst4);
// Cleanup
cvWaitKey(0);
cvReleaseImage(&img);
cvReleaseImage(&dst);
cvDestroyWindow(“Original”);
vDestroyWindow(“Restore”);

}

Checkout my book ‘Deep Learning from first principles Second Edition- In vectorized Python, R and Octave’.  My book is available on Amazon  as paperback ($18.99) and in kindle version($9.99/Rs449).
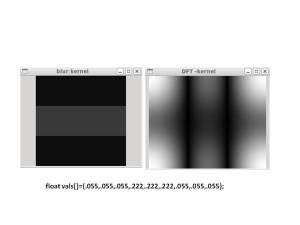
You may also like my companion book “Practical Machine Learning with R and Python:Second Edition- Machine Learning in stereo” available in Amazon in paperback($12.99) and Kindle($9.99/Rs449) versions.


Find me on Google+