In this post I create a simple Webserver with Node.js which uses PostgreSQL database in the backend. This post shows how to perform simple database operations of insert, select, update and delete using REST APIs (POST, GET, PUT & DELETE).
Assuming that you already have Node.js installed here are the steps to create this CRUD (Create, Remove Update & Delete) Webserver.
1.Install Node.js if you already haven’t from Nodejs.org
2. Create a test directory pg for this PostgreSQL based Node.js Webserver
3. Open a command prompt and run
npm install pg
4.You will also need to install the PostgreSQL Enterprise DB with installer. Choose the appropriate OS and CPU
5.For this example I create a simple Employee Database.
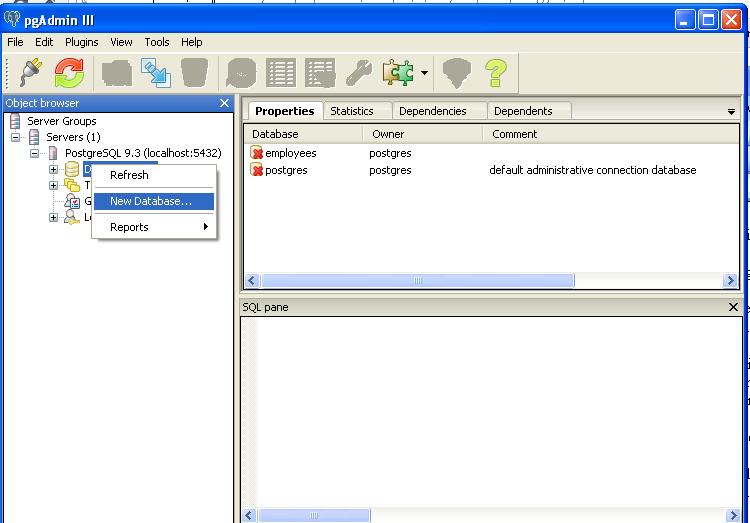
6. In Windows Click Start->All Programs->PostgreSQL 9.3->pgAdmin III
7. Right click Databases-> New Database and Enter employees
8. The next step is to create Node.js Webserver and connect to this Database. PostgreSQL accepts DB connections through port 5432.
9.In this post The Webserver accepts connections from port 5433. Here is the shell of the Node.js Webserver
var pg = require("pg")

var http = require("http")

var port = 5433;

var host = '127.0.0.1';
http.createServer(function(req, res) {

if(req.method == 'POST') {

insert_records(req,res);

}

else if(req.method == 'GET') {

list_records(req,res);

}

else if(req.method == 'PUT') {

update_record(req,res);

}

else if(req.method == 'DELETE') {

delete_record(req,res);

}

}).listen(port,host);

console.log("Connected to " + port + "   " + host);
The Webserver accepts the usual 4 REST API calls – POST, GET, UPDATE, and DELETE for which there are 4 separate function calls. The REST API calls correspond to the database operations insert, select, update and delete respectively.
10. Prior to performing each operation the a client connects to the database as follows
var conString = "pg://postgres:postgres@localhost:5432/employees";

var client = new pg.Client(conString);

client.connect();
11. The POST operation is performed as follows
var insert_records = function(req, res) {

…

…

//Drop table if it exists

client.query("DROP TABLE IF EXISTS emps");

// Creat table and insert 2 records into it

client.query("CREATE TABLE IF NOT EXISTS emps(firstname varchar(64), lastname varchar(64))");

client.query("INSERT INTO emps(firstname, lastname) values($1, $2)", ['Tinniam', 'Ganesh']);

client.query("INSERT INTO emps(firstname, lastname) values($1, $2)", ['Anand', 'Karthik']);
12. To display the contents of the database the list_records function is used as follows
var list_records = function(req, res) {

console.log("In listing records");

// Select all rows in the table

var query = client.query("SELECT firstname, lastname FROM emps ORDER BY lastname, firstname");

query.on("row", function (row, result) {

result.addRow(row);

});

query.on("end", function (result) {
13. The REST API Update is performed as below
var update_record = function(req, res) {

// Update the record where the firstname is Anand

query = client.query("UPDATE emps set firstname = 'Kumar' WHERE firstname='Anand' AND lastname='Karthik'");
14.Finally a delete is performed using a delete_record method
var delete_record = function(req, res) {

// Delete the record where the lastname is Karthik

client.query("DELETE FROM  emps WHERE lastname = 'Karthik'");
15.The output of each operation is sent back as HTML as
query.on("row", function (row, result) {

result.addRow(row);

});

query.on("end", function (result) {

// On end JSONify and write the results to console and to HTML output

console.log(JSON.stringify(result.rows, null, "    "));

res.writeHead(200, {'Content-Type': 'text/plain'});

res.write(JSON.stringify(result.rows) + "\n");

res.end();

});
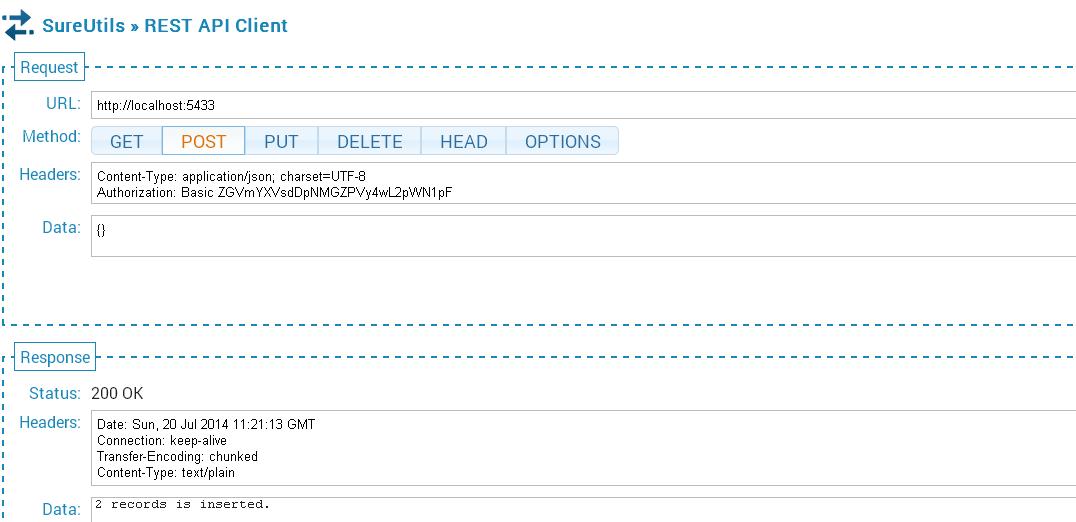
16.To test the Webserver you need to install a REST API client for the browser you use. I installed the SureUtils-.REST API Client. his is a Chrome extension nand can be installed from Chrome Web Store (search for REST API client). You could choose any REST API client of your choice for the browser you intend to use (Chrome, Firefox)
17.Here are the tests I performed
18.The POST API call
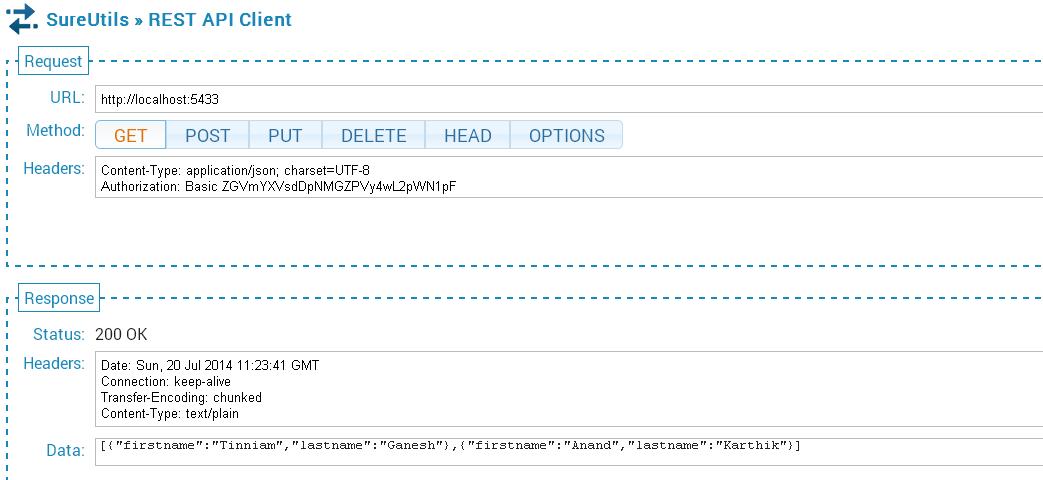
19. The GET API call
20.The PUT call followed by GET call
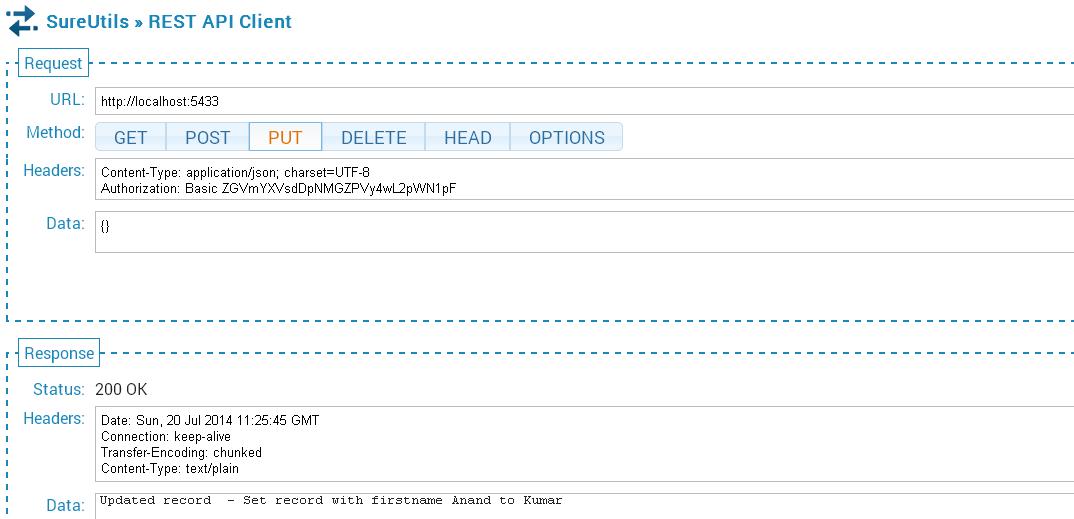

The PUT API updates Anand Karthik to Kumar Karthik. This is shown in the GET API call.
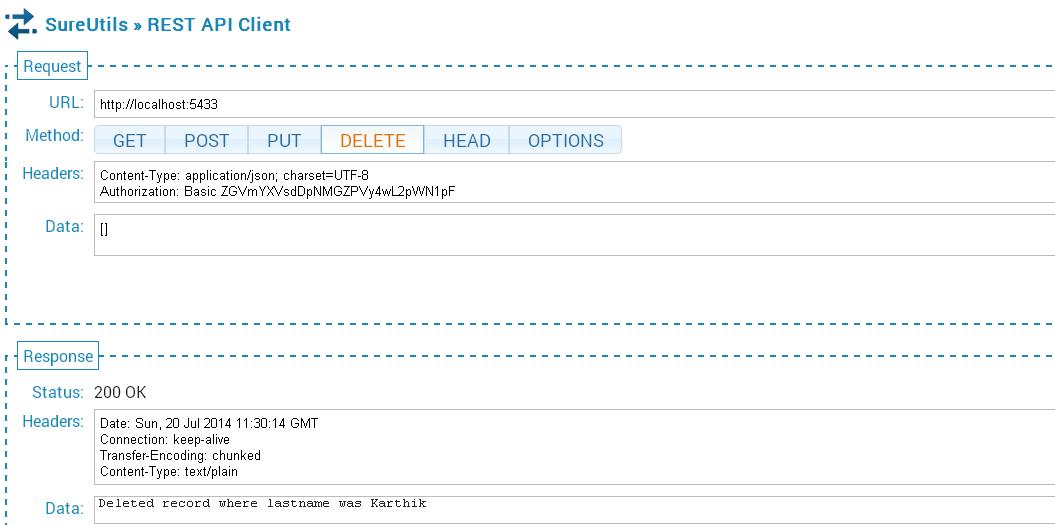
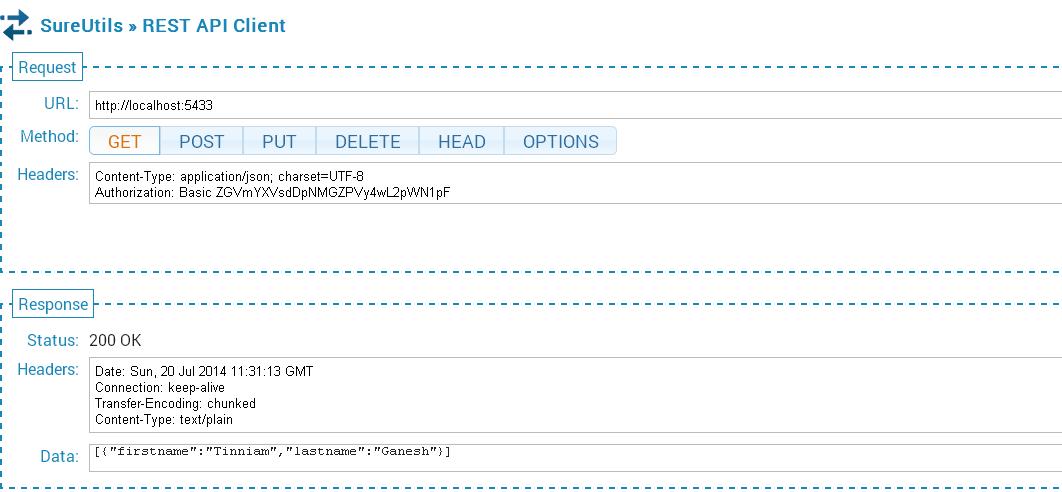
21. The DELETE call followed by the GET call
Here the DELETE API call deletes the Kumar Karthik record. The GET API call now displays only 1 record.
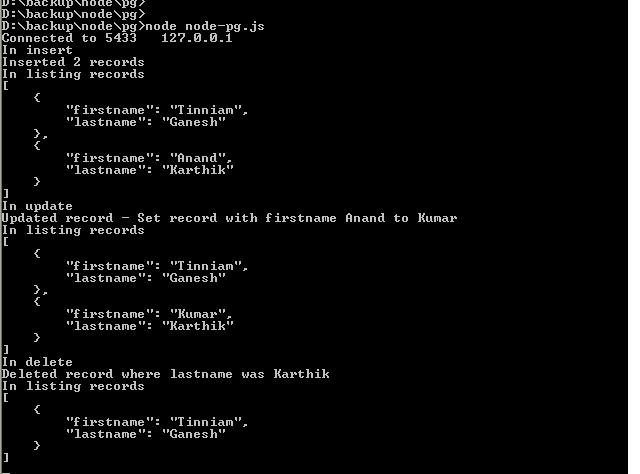
22. The console.log output for the operations above is shown below
The code for the Node.js- PostgreSQL can be cloned from GitHub at node-pg
 Checkout my book ‘Deep Learning from first principles Second Edition- In vectorized Python, R and Octave’. My book is available on Amazon as paperback ($18.99) and in kindle version($9.99/Rs449).
You may also like my companion book “Practical Machine Learning with R and Python:Second Edition- Machine Learning in stereo” available in Amazon in paperback($12.99) and Kindle($9.99/Rs449) versions.
Also see
1. My book ‘Practical Machine Learning in R and Python: Third edition’ on Amazon
2.My book ‘Deep Learning from first principles:Second Edition’ now on Amazon
3.The Clash of the Titans in Test and ODI cricket
4. Introducing QCSimulator: A 5-qubit quantum computing simulator in R
5.Latency, throughput implications for the Cloud
6. Simulating a Web Joint in Android
5. Pitching yorkpy … short of good length to IPL – Part 1
Also see
– Introducing cricketr: An R package for analyzing performances of cricketers
– A crime map of India in R: Crimes against women
– What’s up Watson? Using IBM Watson’s QAAPI with Bluemix, NodeExpress – Part 1
– Bend it like Bluemix, MongoDB with autoscaling – Part 1
– Analyzing cricket’s batting legends – Through the mirage with R
– Masters of spin: Unraveling the web with R