My book ‘Practical Machine Learning in R and Python: Second edition’ on Amazon

Note: The 3rd edition of this book is now available My book ‘Practical Machine Learning in R and Python: Third edition’ on Amazon

The third edition of my book ‘Practical Machine Learning with R and Python – Machine Learning in stereo’ is now available in both paperback ($12.99) and kindle ($9.99/Rs449) versions.  This second edition includes more content,  extensive comments and formatting for better readability.

In this book I implement some of the most common, but important Machine Learning algorithms in R and equivalent Python code.
1. Practical machine with R and Python: Third Edition – Machine Learning in Stereo(Paperback-$12.99)
2. Practical machine with R and Third Edition – Machine Learning in Stereo(Kindle- $9.99/Rs449)

This book is ideal both for beginners and the experts in R and/or Python. Those starting their journey into datascience and ML will find the first 3 chapters useful, as they touch upon the most important programming constructs in R and Python and also deal with equivalent statements in R and Python. Those who are expert in either of the languages, R or Python, will find the equivalent code ideal for brushing up on the other language. And finally,those who are proficient in both languages, can use the R and Python implementations to internalize the ML algorithms better.

Here is a look at the topics covered

Table of Contents
Preface …………………………………………………………………………….4
Introduction ………………………………………………………………………6
1. Essential R ………………………………………………………………… 8
2. Essential Python for Datascience ……………………………………………57
3. R vs Python …………………………………………………………………81
4. Regression of a continuous variable ……………………………………….101
5. Classification and Cross Validation ………………………………………..121
6. Regression techniques and regularization ………………………………….146
7. SVMs, Decision Trees and Validation curves ………………………………191
8. Splines, GAMs, Random Forests and Boosting ……………………………222
9. PCA, K-Means and Hierarchical Clustering ………………………………258
References ……………………………………………………………………..269

Pick up your copy today!!
Hope you have a great time learning as I did while implementing these algorithms!

Presentation on ‘Machine Learning in plain English – Part 1’

This is the first part on my series ‘Machine Learning in plain English – Part 1’ in which I discuss the intuition behind different Machine Learning algorithms, metrics and the approaches etc. These presentations will not include tiresome math or laborious programming constructs, and will instead focus on just the concepts behind the Machine Learning algorithms.  This presentation discusses what Machine Learning is, Gradient Descent, linear, multi variate & polynomial regression, bias/variance, under fit, good fit and over fit and finally logistic regression etc.

It is hoped that these presentations will trigger sufficient interest in you, to explore this fascinating field further

To see actual implementations of the most widely used Machine Learning algorithms in R and Python, check out My book ‘Practical Machine Learning with R and Python’ on Amazon

Also see
1. Practical Machine Learning with R and Python – Part 3
2.R vs Python: Different similarities and similar differences
3. Perils and pitfalls of Big Data
4. Deep Learning from first principles in Python, R and Octave – Part 2
5. Getting started with memcached-libmemcached

To see all post see “Index of posts

My book ‘Practical Machine Learning with R and Python’ on Amazon

Note: The 3rd edition of this book is now available My book ‘Practical Machine Learning in R and Python: Third edition’ on Amazon

My book ‘Practical Machine Learning with R and Python: Second Edition – Machine Learning in stereo’ is now available in both paperback ($10.99) and kindle ($7.99/Rs449) versions. In this book I implement some of the most common, but important Machine Learning algorithms in R and equivalent Python code. This is almost like listening to parallel channels of music in stereo!
1. Practical machine with R and Python: Third Edition – Machine Learning in Stereo(Paperback-$12.99)
2. Practical machine with R and Python Third Edition – Machine Learning in Stereo(Kindle- $8.99/Rs449)
This book is ideal both for beginners and the experts in R and/or Python. Those starting their journey into datascience and ML will find the first 3 chapters useful, as they touch upon the most important programming constructs in R and Python and also deal with equivalent statements in R and Python. Those who are expert in either of the languages, R or Python, will find the equivalent code ideal for brushing up on the other language. And finally,those who are proficient in both languages, can use the R and Python implementations to internalize the ML algorithms better.

Here is a look at the topics covered

Table of Contents
Essential R …………………………………….. 7
Essential Python for Datascience ………………..   54
R vs Python ……………………………………. 77
Regression of a continuous variable ………………. 96
Classification and Cross Validation ……………….113
Regression techniques and regularization …………. 134
SVMs, Decision Trees and Validation curves …………175
Splines, GAMs, Random Forests and Boosting …………202
PCA, K-Means and Hierarchical Clustering …………. 234

Pick up your copy today!!
Hope you have a great time learning as I did while implementing these algorithms!

cricketr plays the ODIs!

Published in R bloggers: cricketr plays the ODIs

Introduction

In this post my package ‘cricketr’ takes a swing at One Day Internationals(ODIs). Like test batsman who adapt to ODIs with some innovative strokes, the cricketr package has some additional functions and some modified functions to handle the high strike and economy rates in ODIs. As before I have chosen my top 4 ODI batsmen and top 4 ODI bowlers.

Unititled2

If you are passionate about cricket, and love analyzing cricket performances, then check out my racy book on cricket ‘Cricket analytics with cricketr and cricpy – Analytics harmony with R & Python’! This book discusses and shows how to use my R package ‘cricketr’ and my Python package ‘cricpy’ to analyze batsmen and bowlers in all formats of the game (Test, ODI and T20). The paperback is available on Amazon at $21.99 and  the kindle version at $9.99/Rs 449/-. A must read for any cricket lover! Check it out!!

You can download the latest PDF version of the book  at  ‘Cricket analytics with cricketr and cricpy: Analytics harmony with R and Python-6th edition

Untitled

Important note 1: The latest release of ‘cricketr’ now includes the ability to analyze performances of teams now!!  See Cricketr adds team analytics to its repertoire!!!

Important note 2 : Cricketr can now do a more fine-grained analysis of players, see Cricketr learns new tricks : Performs fine-grained analysis of players

Important note 3: Do check out the python avatar of cricketr, ‘cricpy’ in my post ‘Introducing cricpy:A python package to analyze performances of cricketers

Do check out my interactive Shiny app implementation using the cricketr package – Sixer – R package cricketr’s new Shiny avatar

You can also read this post at Rpubs as odi-cricketr. Dowload this report as a PDF file from odi-cricketr.pdf

Important note: Do check out my other posts using cricketr at cricketr-posts

Note: If you would like to do a similar analysis for a different set of batsman and bowlers, you can clone/download my skeleton cricketr template from Github (which is the R Markdown file I have used for the analysis below). You will only need to make appropriate changes for the players you are interested in. Just a familiarity with R and R Markdown only is needed.
Batsmen

  1. Virendar Sehwag (Ind)
  2. AB Devilliers (SA)
  3. Chris Gayle (WI)
  4. Glenn Maxwell (Aus)

Bowlers

  1. Mitchell Johnson (Aus)
  2. Lasith Malinga (SL)
  3. Dale Steyn (SA)
  4. Tim Southee (NZ)

I have sprinkled the plots with a few of my comments. Feel free to draw your conclusions! The analysis is included below

The profile for Virender Sehwag is 35263. This can be used to get the ODI data for Sehwag. For a batsman the type should be “batting” and for a bowler the type should be “bowling” and the function is getPlayerDataOD()

The package can be installed directly from CRAN

if (!require("cricketr")){ 
    install.packages("cricketr",lib = "c:/test") 
} 
library(cricketr)

or from Github

library(devtools)
install_github("tvganesh/cricketr")
library(cricketr)

The One day data for a particular player can be obtained with the getPlayerDataOD() function. To do you will need to go to ESPN CricInfo Player and type in the name of the player for e.g Virendar Sehwag, etc. This will bring up a page which have the profile number for the player e.g. for Virendar Sehwag this would be http://www.espncricinfo.com/india/content/player/35263.html. Hence, Sehwag’s profile is 35263. This can be used to get the data for Virat Sehwag as shown below

sehwag <- getPlayerDataOD(35263,dir="..",file="sehwag.csv",type="batting")

Analyses of Batsmen

The following plots gives the analysis of the 4 ODI batsmen

  1. Virendar Sehwag (Ind) – Innings – 245, Runs = 8586, Average=35.05, Strike Rate= 104.33
  2. AB Devilliers (SA) – Innings – 179, Runs= 7941, Average=53.65, Strike Rate= 99.12
  3. Chris Gayle (WI) – Innings – 264, Runs= 9221, Average=37.65, Strike Rate= 85.11
  4. Glenn Maxwell (Aus) – Innings – 45, Runs= 1367, Average=35.02, Strike Rate= 126.69

Plot of 4s, 6s and the scoring rate in ODIs

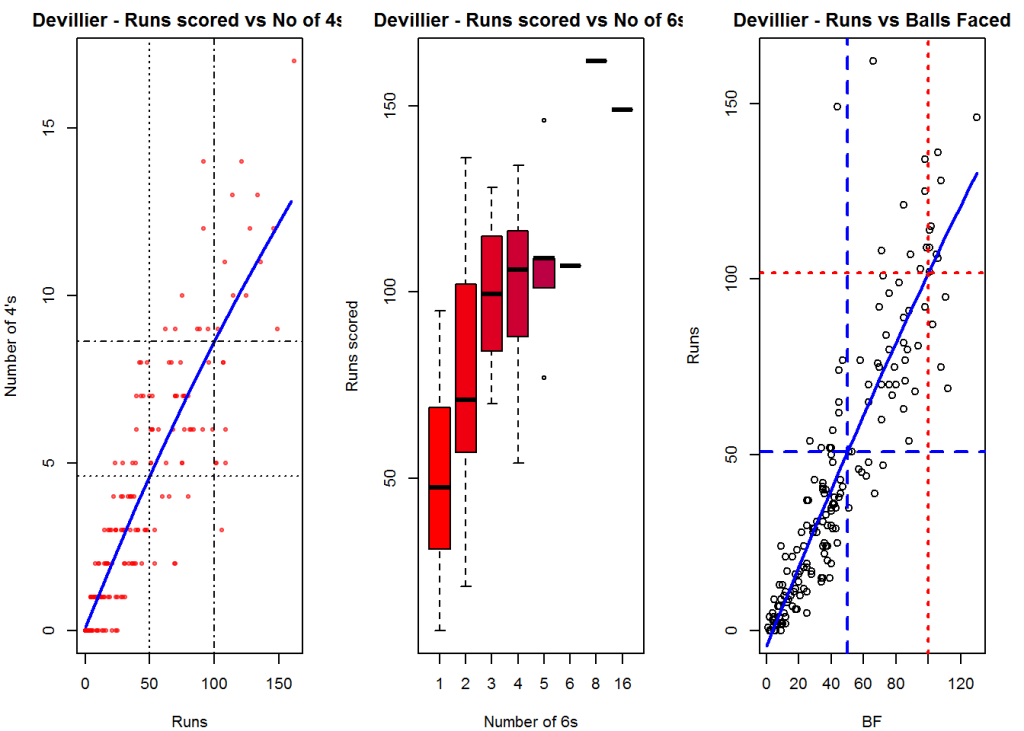
The 3 charts below give the number of

  1. 4s vs Runs scored
  2. 6s vs Runs scored
  3. Balls faced vs Runs scored

A regression line is fitted in each of these plots for each of the ODI batsmen A. Virender Sehwag

par(mfrow=c(1,3))
par(mar=c(4,4,2,2))
batsman4s("./sehwag.csv","Sehwag")
batsman6s("./sehwag.csv","Sehwag")
batsmanScoringRateODTT("./sehwag.csv","Sehwag")

sehwag-4s6sSR-1

dev.off()
## null device 
##           1

B. AB Devilliers

par(mfrow=c(1,3))
par(mar=c(4,4,2,2))
batsman4s("./devilliers.csv","Devillier")
batsman6s("./devilliers.csv","Devillier")
batsmanScoringRateODTT("./devilliers.csv","Devillier")
devillier-4s6SR-1

dev.off()
## null device 
##           1

C. Chris Gayle

par(mfrow=c(1,3))
par(mar=c(4,4,2,2))
batsman4s("./gayle.csv","Gayle")
batsman6s("./gayle.csv","Gayle")
batsmanScoringRateODTT("./gayle.csv","Gayle")

gayle-4s6sSR-1

dev.off()
## null device 
##           1

D. Glenn Maxwell

par(mfrow=c(1,3))
par(mar=c(4,4,2,2))
batsman4s("./maxwell.csv","Maxwell")
batsman6s("./maxwell.csv","Maxwell")
batsmanScoringRateODTT("./maxwell.csv","Maxwell")

maxwell-4s6sout-1

dev.off()
## null device 
##           1

Relative Mean Strike Rate

In this first plot I plot the Mean Strike Rate of the batsmen. It can be seen that Maxwell has a awesome strike rate in ODIs. However we need to keep in mind that Maxwell has relatively much fewer (only 45 innings) innings. He is followed by Sehwag who(most innings- 245) also has an excellent strike rate till 100 runs and then we have Devilliers who roars ahead. This is also seen in the overall strike rate in above

par(mar=c(4,4,2,2))
frames <- list("./sehwag.csv","./devilliers.csv","gayle.csv","maxwell.csv")
names <- list("Sehwag","Devilliers","Gayle","Maxwell")
relativeBatsmanSRODTT(frames,names)

plot-1-1

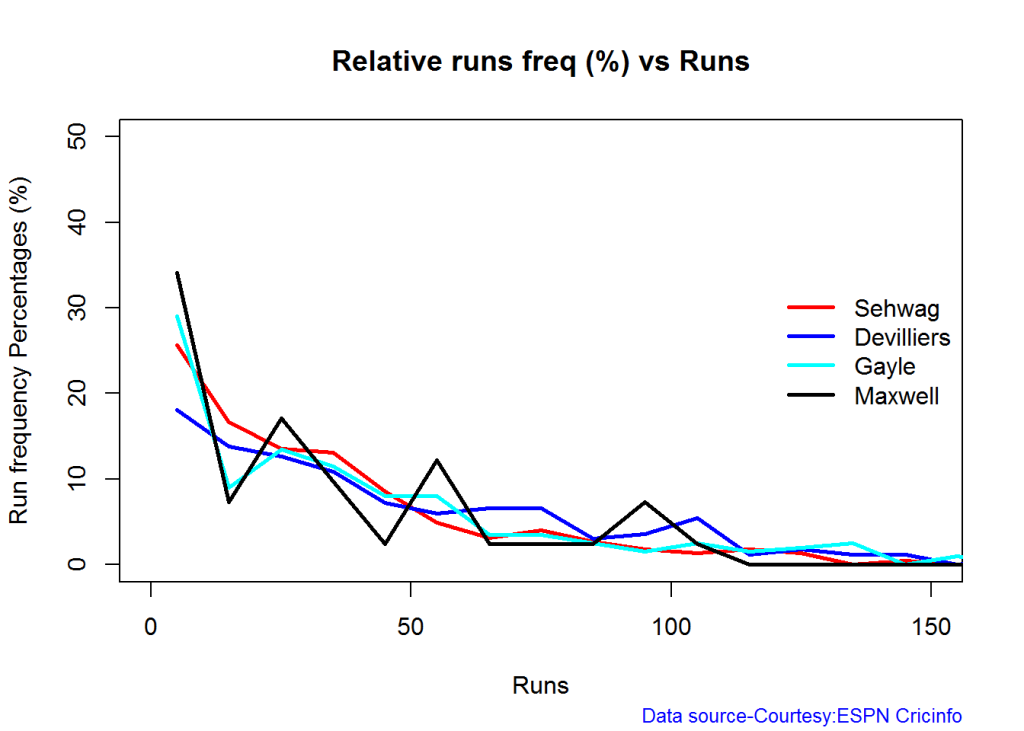
Relative Runs Frequency Percentage

Sehwag leads in the percentage of runs in 10 run ranges upto 50 runs. Maxwell and Devilliers lead in 55-66 & 66-85 respectively.

frames <- list("./sehwag.csv","./devilliers.csv","gayle.csv","maxwell.csv")
names <- list("Sehwag","Devilliers","Gayle","Maxwell")
relativeRunsFreqPerfODTT(frames,names)
plot-2-1

Percentage of 4s,6s in the runs scored

The plot below shows the percentage of runs made by the batsmen by ways of 1s,2s,3s, 4s and 6s. It can be seen that Sehwag has the higheest percent of 4s (33.36%) in his overall runs in ODIs. Maxwell has the highest percentage of 6s (13.36%) in his ODI career. If we take the overall 4s+6s then Sehwag leads with (33.36 +5.95 = 39.31%),followed by Gayle (27.80+10.15=37.95%)

Percent 4’s,6’s in total runs scored

The plot below shows the contrib

frames <- list("./sehwag.csv","./devilliers.csv","gayle.csv","maxwell.csv")
names <- list("Sehwag","Devilliers","Gayle","Maxwell")
runs4s6s <-batsman4s6s(frames,names)

plot-46s-1

print(runs4s6s)
##                Sehwag Devilliers Gayle Maxwell
## Runs(1s,2s,3s)  60.69      67.39 62.05   62.11
## 4s              33.36      24.28 27.80   24.53
## 6s               5.95       8.32 10.15   13.36
 

Runs forecast

The forecast for the batsman is shown below.

par(mfrow=c(2,2))
par(mar=c(4,4,2,2))
batsmanPerfForecast("./sehwag.csv","Sehwag")
batsmanPerfForecast("./devilliers.csv","Devilliers")
batsmanPerfForecast("./gayle.csv","Gayle")
batsmanPerfForecast("./maxwell.csv","Maxwell")

swcr-perf-1

dev.off()
## null device 
##           1

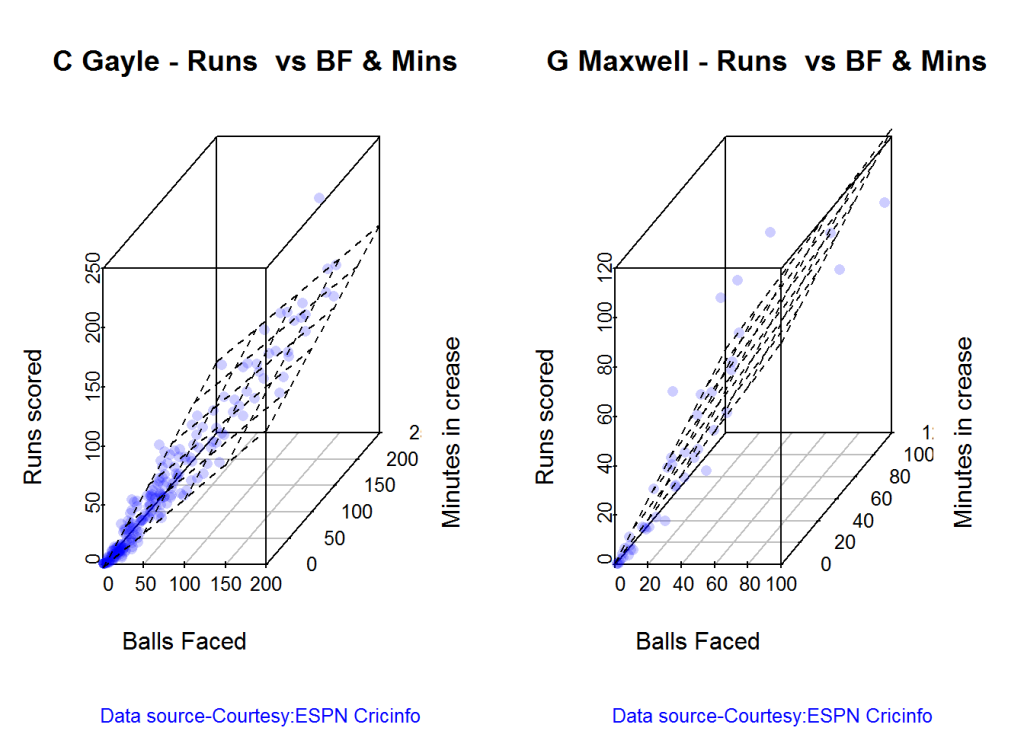
3D plot of Runs vs Balls Faced and Minutes at Crease

The plot is a scatter plot of Runs vs Balls faced and Minutes at Crease. A prediction plane is fitted

par(mfrow=c(1,2))
par(mar=c(4,4,2,2))
battingPerf3d("./sehwag.csv","V Sehwag")
battingPerf3d("./devilliers.csv","AB Devilliers")

plot-3-1

dev.off()
## null device 
##           1
par(mfrow=c(1,2))
par(mar=c(4,4,2,2))
battingPerf3d("./gayle.csv","C Gayle")
battingPerf3d("./maxwell.csv","G Maxwell")
plot-4-1

dev.off()
## null device 
##           1

Predicting Runs given Balls Faced and Minutes at Crease

A multi-variate regression plane is fitted between Runs and Balls faced +Minutes at crease.

BF <- seq( 10, 200,length=10)
Mins <- seq(30,220,length=10)
newDF <- data.frame(BF,Mins)

sehwag <- batsmanRunsPredict("./sehwag.csv","Sehwag",newdataframe=newDF)
devilliers <- batsmanRunsPredict("./devilliers.csv","Devilliers",newdataframe=newDF)
gayle <- batsmanRunsPredict("./gayle.csv","Gayle",newdataframe=newDF)
maxwell <- batsmanRunsPredict("./maxwell.csv","Maxwell",newdataframe=newDF)

The fitted model is then used to predict the runs that the batsmen will score for a hypotheticial Balls faced and Minutes at crease. It can be seen that Maxwell sets a searing pace in the predicted runs for a given Balls Faced and Minutes at crease followed by Sehwag. But we have to keep in mind that Maxwell has only around 1/5th of the innings of Sehwag (45 to Sehwag’s 245 innings). They are followed by Devilliers and then finally Gayle

batsmen <-cbind(round(sehwag$Runs),round(devilliers$Runs),round(gayle$Runs),round(maxwell$Runs))
colnames(batsmen) <- c("Sehwag","Devilliers","Gayle","Maxwell")
newDF <- data.frame(round(newDF$BF),round(newDF$Mins))
colnames(newDF) <- c("BallsFaced","MinsAtCrease")
predictedRuns <- cbind(newDF,batsmen)
predictedRuns
##    BallsFaced MinsAtCrease Sehwag Devilliers Gayle Maxwell
## 1          10           30     11         12    11      18
## 2          31           51     33         32    28      43
## 3          52           72     55         52    46      67
## 4          73           93     77         71    63      92
## 5          94          114    100         91    81     117
## 6         116          136    122        111    98     141
## 7         137          157    144        130   116     166
## 8         158          178    167        150   133     191
## 9         179          199    189        170   151     215
## 10        200          220    211        190   168     240

Highest runs likelihood

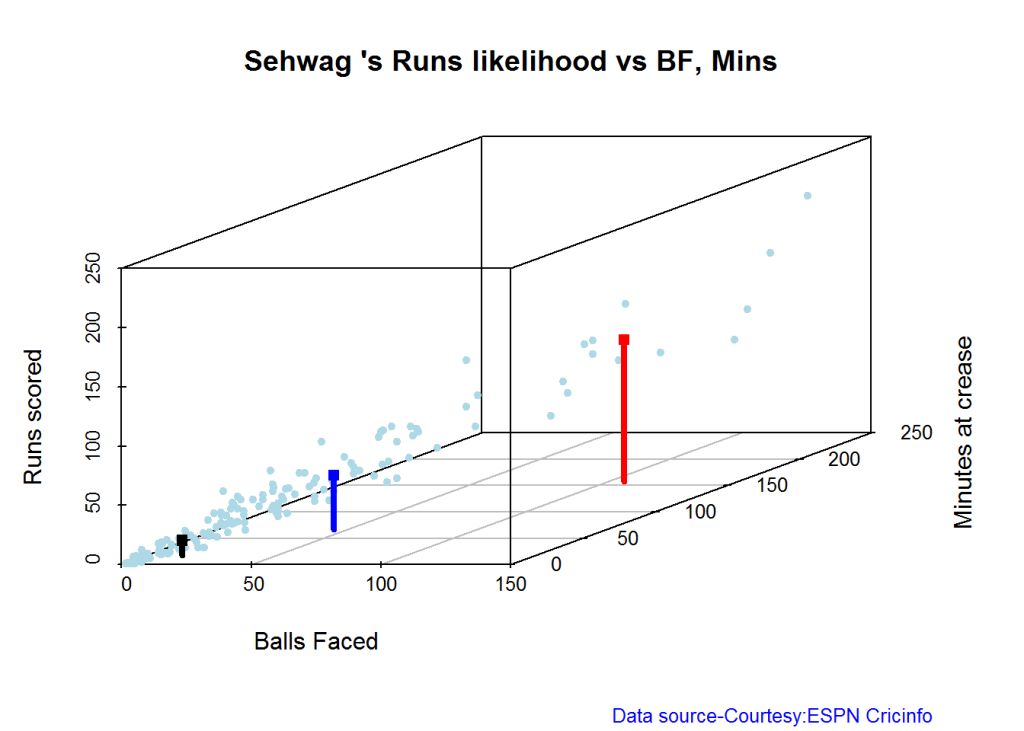
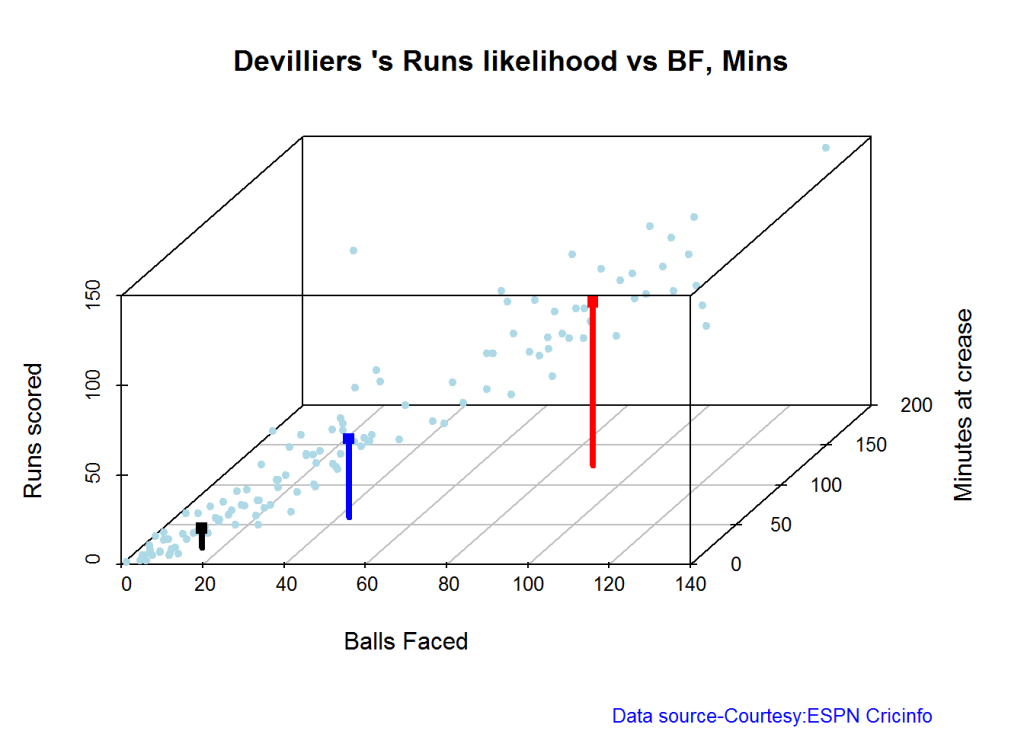
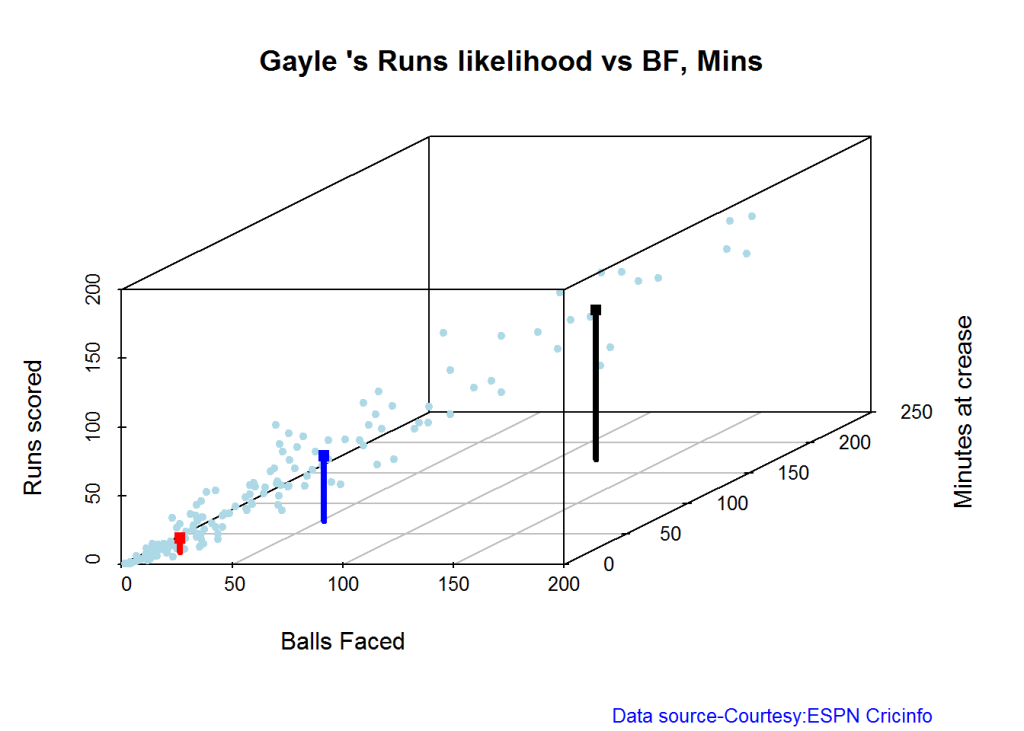
The plots below the runs likelihood of batsman. This uses K-Means It can be seen that Devilliers has almost 27.75% likelihood to make around 90+ runs. Gayle and Sehwag have 34% to make 40+ runs. A. Virender Sehwag

A. Virender Sehwag

batsmanRunsLikelihood("./sehwag.csv","Sehwag")
smith-1

## Summary of  Sehwag 's runs scoring likelihood
## **************************************************
## 
## There is a 35.22 % likelihood that Sehwag  will make  46 Runs in  44 balls over 67  Minutes 
## There is a 9.43 % likelihood that Sehwag  will make  119 Runs in  106 balls over  158  Minutes 
## There is a 55.35 % likelihood that Sehwag  will make  12 Runs in  13 balls over 18  Minutes

B. AB Devilliers

batsmanRunsLikelihood("./devilliers.csv","Devilliers")
warner-1

## Summary of  Devilliers 's runs scoring likelihood
## **************************************************
## 
## There is a 30.65 % likelihood that Devilliers  will make  44 Runs in  43 balls over 60  Minutes 
## There is a 29.84 % likelihood that Devilliers  will make  91 Runs in  88 balls over  124  Minutes 
## There is a 39.52 % likelihood that Devilliers  will make  11 Runs in  15 balls over 21  Minutes

C. Chris Gayle

batsmanRunsLikelihood("./gayle.csv","Gayle")
cook,cache-TRUE-1

## Summary of  Gayle 's runs scoring likelihood
## **************************************************
## 
## There is a 32.69 % likelihood that Gayle  will make  47 Runs in  51 balls over 72  Minutes 
## There is a 54.49 % likelihood that Gayle  will make  10 Runs in  15 balls over  20  Minutes 
## There is a 12.82 % likelihood that Gayle  will make  109 Runs in  119 balls over 172  Minutes

D. Glenn Maxwell

batsmanRunsLikelihood("./maxwell.csv","Maxwell")

oot-1

## Summary of  Maxwell 's runs scoring likelihood
## **************************************************
## 
## There is a 34.38 % likelihood that Maxwell  will make  39 Runs in  29 balls over 35  Minutes 
## There is a 15.62 % likelihood that Maxwell  will make  89 Runs in  55 balls over  69  Minutes 
## There is a 50 % likelihood that Maxwell  will make  6 Runs in  7 balls over 9  Minutes

Average runs at ground and against opposition

A. Virender Sehwag

par(mfrow=c(1,2))
par(mar=c(4,4,2,2))
batsmanAvgRunsGround("./sehwag.csv","Sehwag")
batsmanAvgRunsOpposition("./sehwag.csv","Sehwag")

avgrg-1-1

dev.off()
## null device 
##           1

B. AB Devilliers

par(mfrow=c(1,2))
par(mar=c(4,4,2,2))
batsmanAvgRunsGround("./devilliers.csv","Devilliers")
batsmanAvgRunsOpposition("./devilliers.csv","Devilliers")

avgrg-2-1

dev.off()
## null device 
##           1

C. Chris Gayle

par(mfrow=c(1,2))
par(mar=c(4,4,2,2))
batsmanAvgRunsGround("./gayle.csv","Gayle")
batsmanAvgRunsOpposition("./gayle.csv","Gayle")

avgrg-3-1

dev.off()
## null device 
##           1

D. Glenn Maxwell

par(mfrow=c(1,2))
par(mar=c(4,4,2,2))
batsmanAvgRunsGround("./maxwell.csv","Maxwell")
batsmanAvgRunsOpposition("./maxwell.csv","Maxwell")

avgrg-4-1

dev.off()
## null device 
##           1

Moving Average of runs over career

The moving average for the 4 batsmen indicate the following

1. The moving average of Devilliers and Maxwell is on the way up.
2. Sehwag shows a slight downward trend from his 2nd peak in 2011
3. Gayle maintains a consistent 45 runs for the last few years

par(mfrow=c(2,2))
par(mar=c(4,4,2,2))
batsmanMovingAverage("./sehwag.csv","Sehwag")
batsmanMovingAverage("./devilliers.csv","Devilliers")
batsmanMovingAverage("./gayle.csv","Gayle")
batsmanMovingAverage("./maxwell.csv","Maxwell")

sdgm-ma-1

dev.off()
## null device 
##           1

Check batsmen in-form, out-of-form

  1. Maxwell, Devilliers, Sehwag are in-form. This is also evident from the moving average plot
  2. Gayle is out-of-form
checkBatsmanInForm("./sehwag.csv","Sehwag")
## *******************************************************************************************
## 
## Population size: 143  Mean of population: 33.76 
## Sample size: 16  Mean of sample: 37.44 SD of sample: 55.15 
## 
## Null hypothesis H0 : Sehwag 's sample average is within 95% confidence interval 
##         of population average
## Alternative hypothesis Ha : Sehwag 's sample average is below the 95% confidence
##         interval of population average
## 
## [1] "Sehwag 's Form Status: In-Form because the p value: 0.603525  is greater than alpha=  0.05"
## *******************************************************************************************
checkBatsmanInForm("./devilliers.csv","Devilliers")
## *******************************************************************************************
## 
## Population size: 111  Mean of population: 43.5 
## Sample size: 13  Mean of sample: 57.62 SD of sample: 40.69 
## 
## Null hypothesis H0 : Devilliers 's sample average is within 95% confidence interval 
##         of population average
## Alternative hypothesis Ha : Devilliers 's sample average is below the 95% confidence
##         interval of population average
## 
## [1] "Devilliers 's Form Status: In-Form because the p value: 0.883541  is greater than alpha=  0.05"
## *******************************************************************************************
checkBatsmanInForm("./gayle.csv","Gayle")
## *******************************************************************************************
## 
## Population size: 140  Mean of population: 37.1 
## Sample size: 16  Mean of sample: 17.25 SD of sample: 20.25 
## 
## Null hypothesis H0 : Gayle 's sample average is within 95% confidence interval 
##         of population average
## Alternative hypothesis Ha : Gayle 's sample average is below the 95% confidence
##         interval of population average
## 
## [1] "Gayle 's Form Status: Out-of-Form because the p value: 0.000609  is less than alpha=  0.05"
## *******************************************************************************************
checkBatsmanInForm("./maxwell.csv","Maxwell")
## *******************************************************************************************
## 
## Population size: 28  Mean of population: 25.25 
## Sample size: 4  Mean of sample: 64.25 SD of sample: 36.97 
## 
## Null hypothesis H0 : Maxwell 's sample average is within 95% confidence interval 
##         of population average
## Alternative hypothesis Ha : Maxwell 's sample average is below the 95% confidence
##         interval of population average
## 
## [1] "Maxwell 's Form Status: In-Form because the p value: 0.948744  is greater than alpha=  0.05"
## *******************************************************************************************

Analysis of bowlers

  1. Mitchell Johnson (Aus) – Innings-150, Wickets – 239, Econ Rate : 4.83
  2. Lasith Malinga (SL)- Innings-182, Wickets – 287, Econ Rate : 5.26
  3. Dale Steyn (SA)- Innings-103, Wickets – 162, Econ Rate : 4.81
  4. Tim Southee (NZ)- Innings-96, Wickets – 135, Econ Rate : 5.33

Malinga has the highest number of innings and wickets followed closely by Mitchell. Steyn and Southee have relatively fewer innings.

To get the bowler’s data use

malinga <- getPlayerDataOD(49758,dir=".",file="malinga.csv",type="bowling")

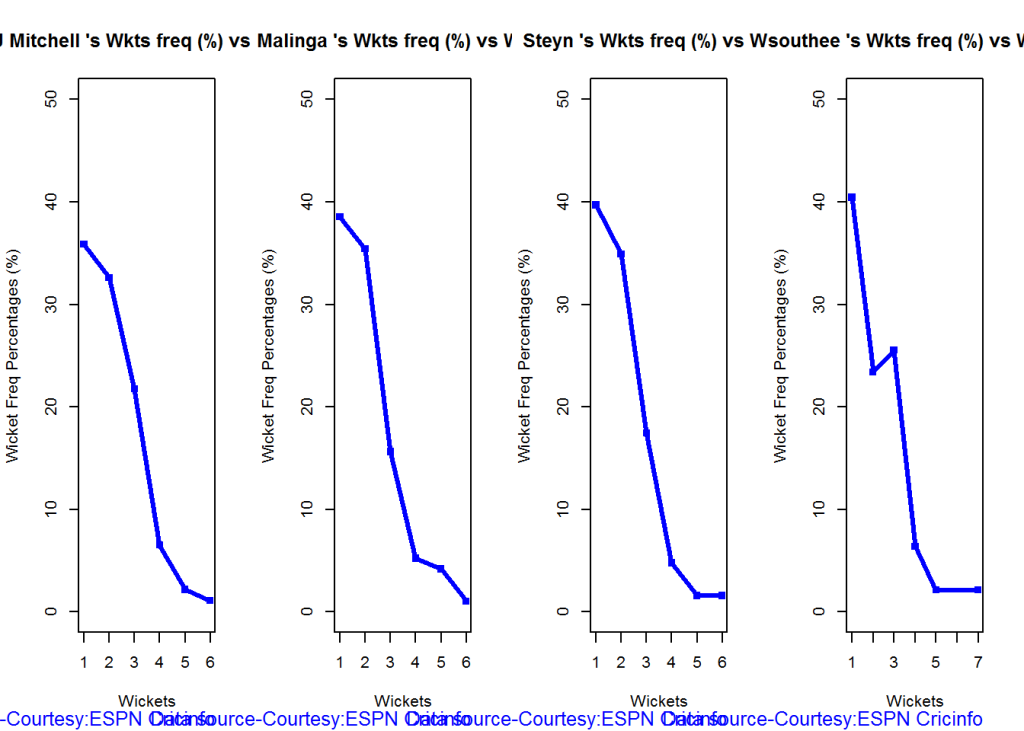
Wicket Frequency percentage

This plot gives the percentage of wickets for each wickets (1,2,3…etc)

par(mfrow=c(1,4))
par(mar=c(4,4,2,2))
bowlerWktsFreqPercent("./mitchell.csv","J Mitchell")
bowlerWktsFreqPercent("./malinga.csv","Malinga")
bowlerWktsFreqPercent("./steyn.csv","Steyn")
bowlerWktsFreqPercent("./southee.csv","southee")
relBowlFP-1

dev.off()
## null device 
##           1

Wickets Runs plot

The plot below gives a boxplot of the runs ranges for each of the wickets taken by the bowlers. M Johnson and Steyn are more economical than Malinga and Southee corroborating the figures above

par(mfrow=c(1,4))
par(mar=c(4,4,2,2))

bowlerWktsRunsPlot("./mitchell.csv","J Mitchell")
bowlerWktsRunsPlot("./malinga.csv","Malinga")
bowlerWktsRunsPlot("./steyn.csv","Steyn")
bowlerWktsRunsPlot("./southee.csv","southee")

wktsrun-1

dev.off()
## null device 
##           1

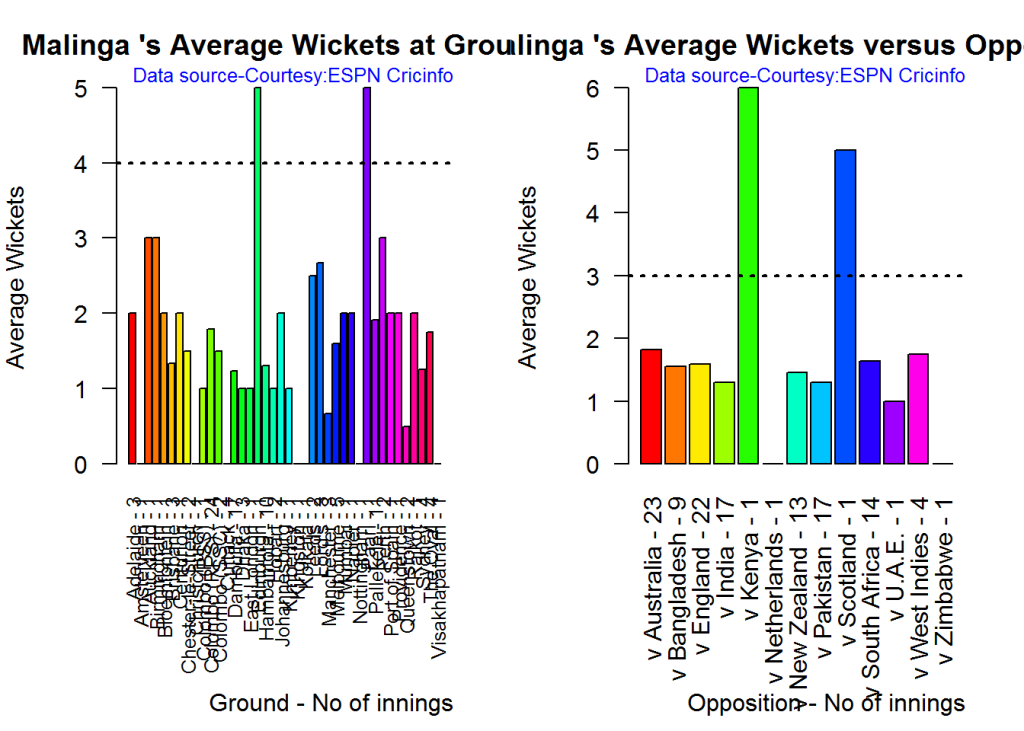
Average wickets in different grounds and opposition

A. Mitchell Johnson

par(mfrow=c(1,2))
par(mar=c(4,4,2,2))
bowlerAvgWktsGround("./mitchell.csv","J Mitchell")
bowlerAvgWktsOpposition("./mitchell.csv","J Mitchell")

gr-1-1

dev.off()
## null device 
##           1

B. Lasith Malinga

par(mfrow=c(1,2))
par(mar=c(4,4,2,2))
bowlerAvgWktsGround("./malinga.csv","Malinga")
bowlerAvgWktsOpposition("./malinga.csv","Malinga")
gr-2-1

dev.off()
## null device 
##           1

C. Dale Steyn

par(mfrow=c(1,2))
par(mar=c(4,4,2,2))
bowlerAvgWktsGround("./steyn.csv","Steyn")
bowlerAvgWktsOpposition("./steyn.csv","Steyn")

gr-3-1

dev.off()
## null device 
##           1

D. Tim Southee

par(mfrow=c(1,2))
par(mar=c(4,4,2,2))
bowlerAvgWktsGround("./southee.csv","southee")
bowlerAvgWktsOpposition("./southee.csv","southee")

avgrg-4-1

dev.off()
## null device 
##           1

Relative bowling performance

The plot below shows that Mitchell Johnson and Southee have more wickets in 3-4 wickets range while Steyn and Malinga in 1-2 wicket range

frames <- list("./mitchell.csv","./malinga.csv","steyn.csv","southee.csv")
names <- list("M Johnson","Malinga","Steyn","Southee")
relativeBowlingPerf(frames,names)

relBowlPerf-1

Relative Economy Rate against wickets taken

Steyn had the best economy rate followed by M Johnson. Malinga and Southee have a poorer economy rate

frames <- list("./mitchell.csv","./malinga.csv","steyn.csv","southee.csv")
names <- list("M Johnson","Malinga","Steyn","Southee")
relativeBowlingERODTT(frames,names)

relBowlER-1

Moving average of wickets over career

Johnson and Steyn career vs wicket graph is on the up-swing. Southee is maintaining a reasonable record while Malinga shows a decline in ODI performance

par(mfrow=c(2,2))
par(mar=c(4,4,2,2))
bowlerMovingAverage("./mitchell.csv","M Johnson")
bowlerMovingAverage("./malinga.csv","Malinga")
bowlerMovingAverage("./steyn.csv","Steyn")
bowlerMovingAverage("./southee.csv","Southee")

jmss-bowlma-1

dev.off()
## null device 
##           1

Wickets forecast

par(mfrow=c(2,2))
par(mar=c(4,4,2,2))
bowlerPerfForecast("./mitchell.csv","M Johnson")
bowlerPerfForecast("./malinga.csv","Malinga")
bowlerPerfForecast("./steyn.csv","Steyn")
bowlerPerfForecast("./southee.csv","southee")

jsba-pfcst-1

dev.off()
## null device 
##           1

Check bowler in-form, out-of-form

All the bowlers are shown to be still in-form

checkBowlerInForm("./mitchell.csv","J Mitchell")
## *******************************************************************************************
## 
## Population size: 135  Mean of population: 1.55 
## Sample size: 15  Mean of sample: 2 SD of sample: 1.07 
## 
## Null hypothesis H0 : J Mitchell 's sample average is within 95% confidence interval 
##         of population average
## Alternative hypothesis Ha : J Mitchell 's sample average is below the 95% confidence
##         interval of population average
## 
## [1] "J Mitchell 's Form Status: In-Form because the p value: 0.937917  is greater than alpha=  0.05"
## *******************************************************************************************
checkBowlerInForm("./malinga.csv","Malinga")
## *******************************************************************************************
## 
## Population size: 163  Mean of population: 1.58 
## Sample size: 19  Mean of sample: 1.58 SD of sample: 1.22 
## 
## Null hypothesis H0 : Malinga 's sample average is within 95% confidence interval 
##         of population average
## Alternative hypothesis Ha : Malinga 's sample average is below the 95% confidence
##         interval of population average
## 
## [1] "Malinga 's Form Status: In-Form because the p value: 0.5  is greater than alpha=  0.05"
## *******************************************************************************************
checkBowlerInForm("./steyn.csv","Steyn")
## *******************************************************************************************
## 
## Population size: 93  Mean of population: 1.59 
## Sample size: 11  Mean of sample: 1.45 SD of sample: 0.69 
## 
## Null hypothesis H0 : Steyn 's sample average is within 95% confidence interval 
##         of population average
## Alternative hypothesis Ha : Steyn 's sample average is below the 95% confidence
##         interval of population average
## 
## [1] "Steyn 's Form Status: In-Form because the p value: 0.257438  is greater than alpha=  0.05"
## *******************************************************************************************
checkBowlerInForm("./southee.csv","southee")
## *******************************************************************************************
## 
## Population size: 86  Mean of population: 1.48 
## Sample size: 10  Mean of sample: 0.8 SD of sample: 1.14 
## 
## Null hypothesis H0 : southee 's sample average is within 95% confidence interval 
##         of population average
## Alternative hypothesis Ha : southee 's sample average is below the 95% confidence
##         interval of population average
## 
## [1] "southee 's Form Status: Out-of-Form because the p value: 0.044302  is less than alpha=  0.05"
## *******************************************************************************************

***************

Key findings

Here are some key conclusions ODI batsmen

  1. AB Devilliers has high frequency of runs in the 60-120 range and the highest average
  2. Sehwag has the most number of innings and good strike rate
  3. Maxwell has the best strike rate but it should be kept in mind that he has 1/5 of the innings of Sehwag. We need to see how he progress further
  4. Sehwag has the highest percentage of 4s in the runs scored, while Maxwell has the most 6s
  5. For a hypothetical Balls Faced and Minutes at creases Maxwell will score the most runs followed by Sehwag
  6. The moving average of indicates that the best is yet to come for Devilliers and Maxwell. Sehwag has a few more years in him while Gayle shows a decline in ODI performance and an out of form is indicated.

ODI bowlers

  1. Malinga has the highest played the highest innings and also has the highest wickets though he has poor economy rate
  2. M Johnson is the most effective in the 3-4 wicket range followed by Southee
  3. M Johnson and Steyn has the best overall economy rate followed by Malinga and Steyn 4 M Johnson and Steyn’s career is on the up-swing,Southee maintains a steady consistent performance, while Malinga shows a downward trend

Hasta la vista! I’ll be back!
Watch this space!

Also see my other posts in R

  1. Introducing cricketr! : An R package to analyze performances of cricketers
  2. cricketr digs the Ashes!
  3. A peek into literacy in India: Statistical Learning with R
  4. A crime map of India in R – Crimes against women
  5. Analyzing cricket’s batting legends – Through the mirage with R
  6. Mirror, mirror . the best batsman of them all?

You may also like

  1. A closer look at “Robot Horse on a Trot” in Android
  2. What’s up Watson? Using IBM Watson’s QAAPI with Bluemix, NodeExpress – Part 1
  3. Bend it like Bluemix, MongoDB with autoscaling – Part 2
  4. Informed choices through Machine Learning : Analyzing Kohli, Tendulkar and Dravid
  5. TWS-4: Gossip protocol: Epidemics and rumors to the rescue
  6. Deblurring with OpenCV:Weiner filter reloadedhttp://www.r-bloggers.com/cricketr-plays-the-odis/

Informed choices through Machine Learning-2: Pitting together Kumble, Kapil, Chandra

Continuing my earlier ‘innings’, of test driving my knowledge in Machine Learning acquired via Coursera,  I now turn my attention towards the bowling performances of our Indian bowling heroes. In this post I give a slightly different ‘spin’ to the bowling analysis and hope I can ‘swing’ your opinion based on my assessment.

I guess that is enough of my cricketing ‘double-speak’ for now and I will get down to the real business of my bowling analysis!

If you are passionate about cricket, and love analyzing cricket performances, then check out my 2 racy books on cricket! In my books, I perform detailed yet compact analysis of performances of both batsmen, bowlers besides evaluating team & match performances in Tests , ODIs, T20s & IPL. You can buy my books on cricket from Amazon at $12.99 for the paperback and $4.99/$6.99 respectively for the kindle versions. The books can be accessed at Cricket analytics with cricketr  and Beaten by sheer pace-Cricket analytics with yorkr  A must read for any cricket lover! Check it out!!

1


As in my earlier post Informed choices through Machine Learning – Analyzing Kohli, Tendulkar and Dravid ,the first part of the post has my analyses and the latter part has the details of the implementation of the algorithm. Feel free to read the first part and either scan or skip the latter.

To perform this analysis I have skipped the data on our recent crop of new bowlers. The reason being that data is scant on these bowlers, besides they also seem to have a relatively shorter shelf life (hope there are a couple of finds in this Australian tour of Dec 2014). For the analyses I have chosen B S Chandrasekhar, Kapil Dev Anil Kumble. My rationale as to why I chose the above 3

B S Chandrasekhar also known as “Chandra’ was one of the most lethal leg spinners in the late 1970’s. He had a very dangerous combination of fast leg breaks, searing tops spins interspersed with the  occasional googly. On many occasions he would leave most batsmen completely clueless.

Kapil Nikhanj Dev, the Haryana Hurricane who could outwit the most technically sound batsmen  through some really clever bowling. His variations were almost always effective and he would achieve the vital breakthrough outsmarting the opponent.

And finally Anil Kumble, I chose Kumble because in my opinion he is truly the embodiment of the ‘thinking’ bowler. Many times I have seen Kumble repeatedly beat batsmen. It was like he was telling the batsman ‘check’ as he bowled faster leg breaks, flippers, a straighter delivery or top spins before finally crashing into the wickets or trapping the batsmen. It felt he was saying ‘checkmate dude!’

I have taken the data for the 3 bowlers from ESPN Cricinfo. Only the Test matches were considered for the analyses. All tests against all oppositions both at home and away were included

The assumptions taken and basis of the computation is included below
a.The data is based on the following 2 input variables a) Overs bowled b) Runs given. The output variable is ‘Wickets taken’

b.To my surprise I found that in the late 1970’s when BS Chandrasekhar used to bowl, an over had 8 balls for matches in Australia. So, I had to normalize this data for Chandra to make it on par with the others. Hence for Chandra where the overs were made up of 8 balls the overs was calculated as follows
Overs (O) = (Overs * 8)/6

c.The Economy rate E was calculated as below
E = Overs/runs was chosen as input variable to take into account fewer runs given by the bowler

d.The output variable was re-calculated as Strike Rate (SR) to determine the ‘bowling effectiveness’
Strike Rate = Wickets/Overs
(not be confused with a batsman’s strike rate batsman strike rate = runs/ balls faced)

e.Hence the analysis is based on
f(O,E) = SR
An outline of the Octave code and the data used can be cloned from GitHub at ml-bowling-analyze

 1. Surface of Bowling Effectiveness (SBE)
In my earlier post I was able to fit a ‘prediction plane’ based on the minutes at crease, balls faced versus the runs scored. But in this case a plane did not make sense as the wickets can only range from 0 – 10 and in most cases averaging between 3 and 5. So I plot the best fitting 3-D surface over the predicted hypothesis function. The steps performed are

1) The data for the different  bowlers were cleaned with data which indicated (DNB – Did not bowl)
2) The Economy Rate (E) = Runs given/Overs and Strike Rate(SR) = Wickets/overs were calculated.
3) The product of Overs (O), and Economy(E) were stored as Over_Economy(OE)
4) The hypothesis function was computed as h(O, E, OE) = y
5) Theta was calculated using the Normal Equation. The Surface of Bowling Effectiveness( SBE) was then plotted. The plots for each of the bowler is shown below

Here are the plots

A) Anil Kumble
The  data of Kumble, based on Overs bowled & Economy rate versus the Strike Rate is plotted as a 3-D scatter plot (pink crosses). The best fit as determined by solving the optimum theta using the Normal Equation is plotted as 3-D surface shown below.
kumble-1
The 3-D surface is what I have termed as ‘Surface of Bowling Effectiveness (SBE)’ as it depicts bowlers overall effectiveness as it plots the overs (O), ‘economy rate’ E against predicted ‘strike rate’ SR.
Here is another view
kumble-2
The theta values obtained for Kumble are
Theta =
0.104208
-0.043769
-0.016305
0.011949

And the cost at this theta is
Cost Function J = 0.0046269

B) B S Chandrasekhar
Here are the best optimal surface plot for Chandra with the data on O,E vs SR plotted as a 3D scatter plot.  Note: The dataset for  Chandrasekhar is smaller compared to the other two.
chandra-1Another view for Chandra
chandra-2

Theta values for B S Chandrasekhar are
Theta =
0.095780
-0.025377
-0.024847
0.023415
and the cost is
Cost Function J = 0.0032980

c) Kapil Dev
The plots  for Kapil
kapil-1
Another view of SBE for Kapil
kapil-2
The Theta values and cost function for Kapil are
Theta =
0.090219
0.027725
0.023894
-0.021434
Cost Function J = 0.0035123

2. Predicting wickets
In the previous section the optimum theta with the lowest Cost Function J was calculated. Based on the value of theta, the wickets that will be taken by a bowler can be computed as the product of the hypothesis function and theta. i.e.

y= h(x) * theta  => Strike Rate (SR) = [1 O E OE] * theta
Now predicted wickets can be calculated as

wickets = Strike rate(SR) * Overs(O)
This is done  for Kumble, Chandra and Kapil  for different combinations of Overs(O) and Economy(E) rate.

Here are the results
Predicted wickets for Anil Kumble
The plot of predicted wickets for Kumble is represented below
kumble-wickets-1
This can also be represented as a a table
kumble-wkts-tbl

Predicted wickets for B S Chandrasekhar
chandra-wickets-1
The table for Chandra
chandra-wkts-tbl
 Predicted wickets for Kapil Dev

The plot
kapil-wicket-2

The predicted table from the hypothesis function for Kapil Dev
kapil-wkts-tbl

Observation: A closer look at  the predicted wickets for Kapil, Kumble and B S Chandra shows an interesting aspect. The predicted number of wickets is higher for lower economy rates. With a little thought we can see bowlers on turning or pitches with a lot of movement can not only be more economical but can also be destructive and take a lot of wickets. Hence the higher wickets for lower economy rates!

Implementation details
In this post I have used the Normal Equation to get the optimal values of theta for local minimum of the Gradient function.  As mentioned above when I had run the 3D scatter plot fitting a 2D plane did not seem quite right. So I had to experiment with different polynomial equations first trying 2nd order, 3rd order and also the sqrt

I tried the following where ‘O is Overs, ‘E’ stands for Economy Rate and ‘SR’ the predicated Strike rate. Theta is the computed theta from the Normal Equation. The notation in  Matrix notation is shown below

i) A linear plane
SR = [1 O E] * theta

ii) Using the sqrt function
SR = [1 sqrt(O) sqrt(E)]  * theta

iii) Using 2nd order plynomial
SR = [1 O^2 E^2] * theta

iv) Using the 3rd order polynomial
SR = [1 O^3 E^3] * theta

v) Before finally settling on
SR = [1 O E OE] * theta

where OE  = O .* E

The last one seemed to give me the lowest cost and also seemed the most logical visual choice.

A good resource to play around with different functions and check out the shapes of combinations of variables and polynomial order of equation is at WolframAlpha: Plotting and Graphics

Note 1: The gradient descent with the Normal Equation has been performed on the entire data set (approx 220 for Kumble & Kapil) and 99 for Chandra. The proper process for verifying a Machine Learning algorithm is to split the data set into (60% training data, 20% cross validation data and 20% as the test set).  We need to validate the prediction function against the cross-validation set, fine tune it and finally ensure that it  fits  the test set samples well.  However, this split was not done as the data set itself was very low. The entire data set was used to perform the optimal surface fit

Note 2: The optimal theta values have been chosen with a feature vector that is of the form
[1 x y x .* y] The Surface of  Bowling Effectiveness’ has been plotted above. It may appear that there is a’high bias’ in the fit and an even better fit could be obtained by choosing higher order polynomials like
[1 x y x*y x^2 y^2 (x^2) .* y x  .* (y^2)] or
[1 x y x*y x^2 y^2 x^3 y^3]  etc
While we can get a better fit we could run into the problem of ‘high variance; and without the cross validation and test set we will not be able to verify the results, Hence the simpler option [1 x y x*y] was chosen

The Octave code outline and the data used can be cloned from GitHub at ml-bowling-analyze

 Conclusion:

1) Predicted wickets: The predicted number of wickets is higher at lower economy rates
2) Comparing performances: There are different ways of looking at the results. One possible way is to check for a particular number of overs and economy rate who is most effective. Here is one way. Taking a small slice from each bowler’s predicted wickets table for anm Economy Rate=4.0 the predicted wickets are

comp

From the above it does appear that Kapil is definitely more effective than the other two. However one could slice and dice in different ways, maybe the most economical for a given numbers and wickets combination or wickets taken in the least overs etc. Do add your thoughts. comments on my assessment or analysis

Also see
1. Analyzing cricket’s batting legends – Through the mirage with R
2. Masters of spin: Unraveling the web with R

You may also like
1. A peek into literacy in India:Statistical learning with R
2. A crime map of India in R: Crimes against women
3.  What’s up Watson? Using IBM Watson’s QAAPI with Bluemix, NodeExpress – Part 1

Simplifying ML: Logistic regression – Part 2

Logistic regression is another class of Machine Learning algorithms which comes under supervised learning. In this regression technique we need to classify data. Take a look at my earlier post Simplifying Machine Learning algorithms – Part 1 I had discussed linear regression. For e.g if we had data on tumor sizes versus the fact that the tumor was benign or malignant, the question is whether given a tumor size we can predict whether this tumor would be benign or cancerous. So we need to have the ability to classify this data.

This is shown below

4

It is obvious that a line with a certain slope could easily separate the two.

As another example we could have an algorithm that is able to automatically classify mail as either spam or not spam based on the subject line. So for e.g if the subject line had words like medicine, prize, lottery etc we could with a fair degree of probability classify this as spam.

However some classification problems could be far more complex.  We may need to classify another problem as shown below.

5

From the above it can be seen that hypothesis function is second order equation which is either a circle or an ellipse.

In the case of logistic regression the hypothesis function should be able to switch between 2 values 0 or 1 almost like a transistor either being in cutoff or in saturation state.

In the case of logistic regression 0 <= hƟ <= 1

The hypothesis function uses function of the following form

g(z) = 1/(1 + e‑z)

and hƟ (x) = g(ƟTX)

6

The function g(z) shown above has the characteristic required for logistic regression as it has the following shape

The function rapidly asymptotes at 1 when hƟ (x) >= 0.5 and  hƟ (x) asymptotes to 0 when hƟ (x) < 0.5

As in linear regression we can have hypothesis function be of an appropriate order. So for e.g. in the ellipse figure above one could choose a hypothesis function as follows

hƟ (x) = Ɵ0 + Ɵ1x12 + Ɵ2x22 + Ɵ3x1 +  Ɵ4x2


or


hƟ (x) = 1/(1 + e –(Ɵ0 + Ɵ1×12 + Ɵ2×22 + Ɵ3×1 +  Ɵ4×2))

We could choose the general form of a circle which is

f(x) = ax2 + by2 +2gx + 2hy + d

The cost function for logistic regression is given below

Cost(hƟ (x),y) = { -log(hƟ (x))             if y = 1

-log(1 – hƟ (x)))       if y = 0

In the case of regression there was a single cost function which could determine the error of the data against the predicted value.

The cost in the event of logistic regression is given as above as a set of 2 equations one for the case where the data is 1 and another for the case where the data is 0.

The reason for this is as follows. If we consider y =1 as a positive value, then when our hypothesis correctly predicts 1 then we have a ‘true positive’ however if we predict 0 when it should be 1 then we have a false negative. Similarly when the data is 0 and we predict a 1 then this is the case of a false positive and if we correctly predict 0 when it is 0 it is true negative.

Here is the reason as how the cost function

Cost(hƟ (x),y) = { -log(hƟ (x))             if y = 1

-log(1 – hƟ (x)))       if y = 0

Was arrived at. By definition the cost function gives the error between the predicted value and the data value.

The logic for determining the appropriate function is as follows

For y = 1

y=1 & hypothesis = 1 then cost = 0

y= 1 & hypothesis = 0 then cost = Infinity

Similarly for y = 0

y = 0 & hypotheses  = 0 then cost = 0

y = 0 & hypothesis = 1 then cost = Infinity

and the the functions above serve exactly this purpose as can be seen

7

Hence the cost can be written as

J(Ɵ) = Cost(hƟ (x),y) = -y * log(hƟ (x))  – (1-y) * (log(1 – hƟ (x))

This is the same as the equation above

The same gradient descent algorithm can now be used to minimize the cost function

So we can iterate througj

Ɵj =   Ɵj – α δ/δ Ɵj J(Ɵ0, Ɵ1,… Ɵn)

This works out to a function that is similar to linear regression

Ɵj = Ɵj – α 1/m { Σ hƟ (xi) – yi} xj i

This will enable the machine to fairly accurately determine the parameters Ɵj for the features x and provide the hypothesis function.

This is based on the Coursera course on Machine Learning by Professor Andrew Ng. Highly recommended!!!

Find me on Google+