Near Real-time Analytics of ICC Men’s T20 World Cup with GooglyPlusPlus

In my last post GooglyPlusPlus gets ready for ICC Men’s T20 World Cup, I had mentioned that GooglyPlusPlus was preparing for the big event the ICC Men’s T20 World cup. Now that the T20 World cup is underway, my Shiny app in R, GooglyPlusPlus ,will be generating near real-time analytics of matches completed the previous day. Besides the app can also do historical analysis of players, teams and matches.

The whole process is automated. A cron job will execute every day, in the morning, which will automatically download the matches of the previous day from Cricsheet, unzip them, start a pipeline which will transform and process the match data into necessary folders and finally upload the newly acquired data into my Shiny app. Hence, you will be able to access all the breathless, pulsating cricketing action in timeless, interactive plots and tables which will capture all aspects of Men’s T20 matches, namely batsman, bowler performance, match analysis, team-vs-team, team-vs-all teams besides ranking of batsmen & bowlers. Since the data is cumulative, all the analytics are historical and current.

Check out GooglyPlusPlus!!

The data for GooglyPlusPlus is taken from Cricsheet

Interest in cricket, has mushroomed in recent times around the world, with the addition of new formats which started with ODI, T20, T10, 100 ball and so on. There are leagues which host these matches at different levels around the world. While GooglyPlusPlus, provides near real-time analytics of Men’s T20 World cup, we can clearly envision a big data platform which ingests matches daily from multiple cricket formats, leagues around the world generating real-time and near real-time analytics which are essential these days to selection of teams at different levels through auctions. For more discussion on this see my posts

  1. Big Data 7: yorkr waltzes with Apache NiFi
  2. Big Data 6: The T20 Dance of Apache NiFi and yorkpy

We could imagine a Data Lake, into which are ingested data from the different cricket formats, leagues through appropriate technology connectors. Once the data is ingested, we could have data pipelines, based on Azure ADF, Apache NiFi, Apache Airflow or Amazon EMR etc., to transform, process and enhance the data, generating real-time analytics on the fly. Recent formats like T20, T10 require more urgency in strategic thinking based on scoring within limited overs, or containing batsmen from going on a rampage within the set of overs, the analytics on a fly may help the coach to modify the batting or bowling lineup at points in match. In this context see my earlier post Using Linear Programming (LP) for optimizing bowling change or batting lineup in T20 cricket

All of these are not just possible, but are likely to become reality as more and more formats, leagues and cricket data proliferate around the world.

This post, focuses on generating near-real time analytics for ICC Men’s T20 World Cup using GooglyPlusPlus. Included below, is a sampling of the analytics that you can perform for analysing the matches. In addition you can do all the analysis included in my post GooglyPlusPlus gets ready for ICC Men’s T20 World Cup

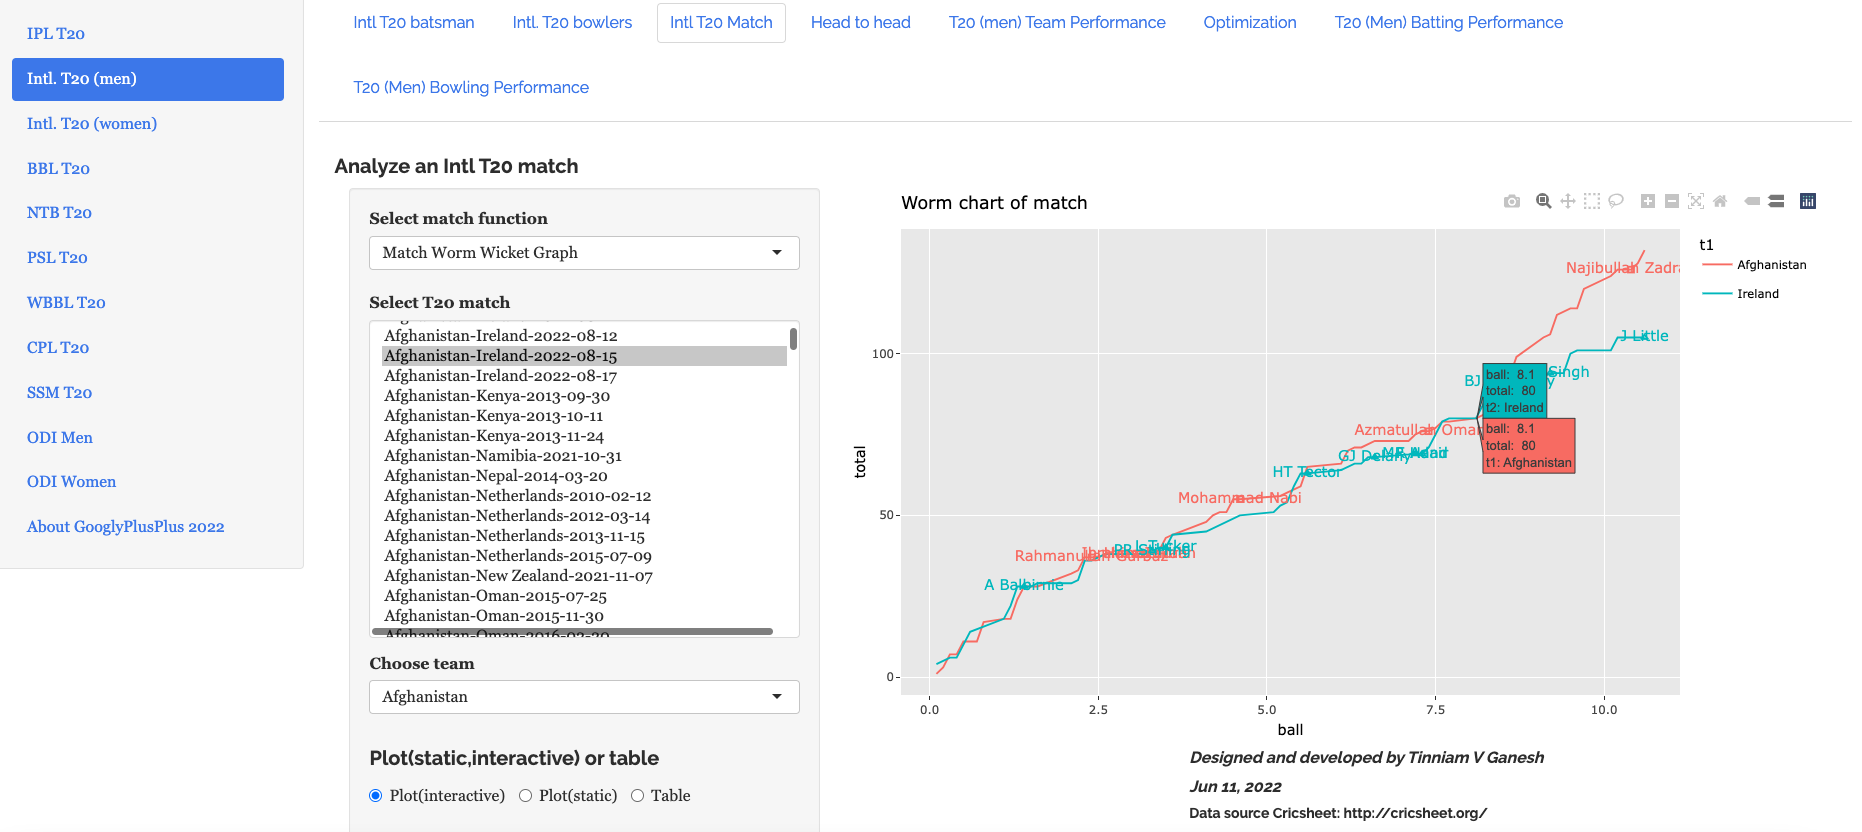
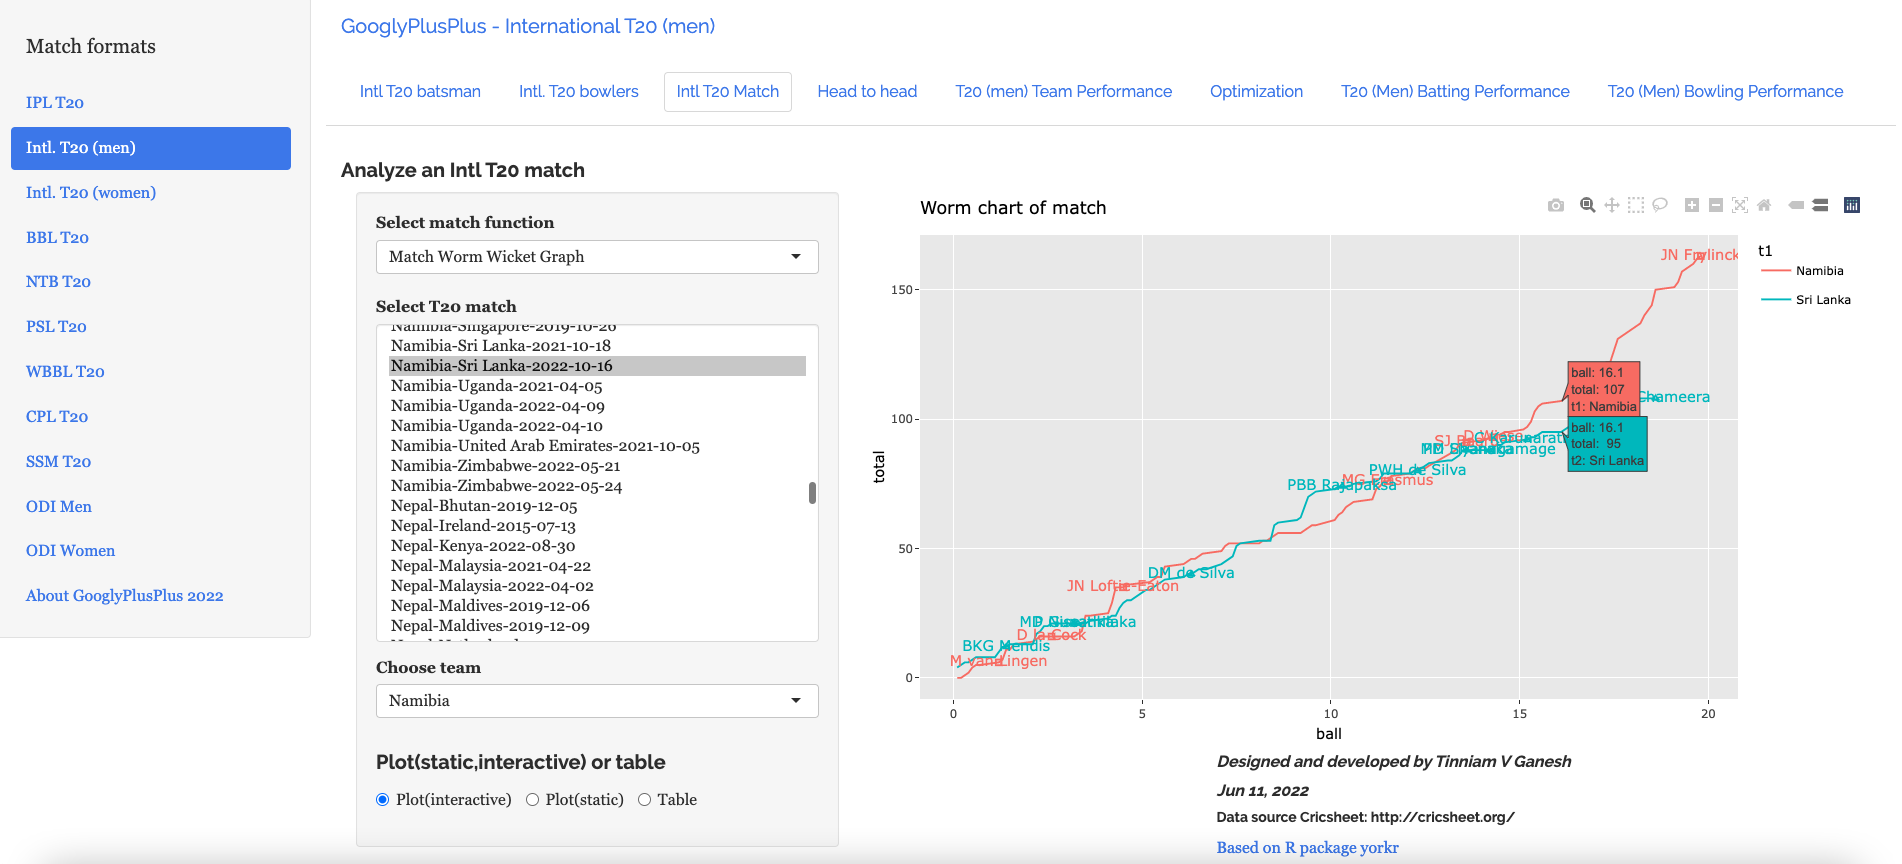
  1. Namibia-Sri Lanka-16 Oct 2022 : Match Worm graph

The opening match between Namibia vs Sri Lanka resulted in an upset. We can see this in the match worm-wicket graph below

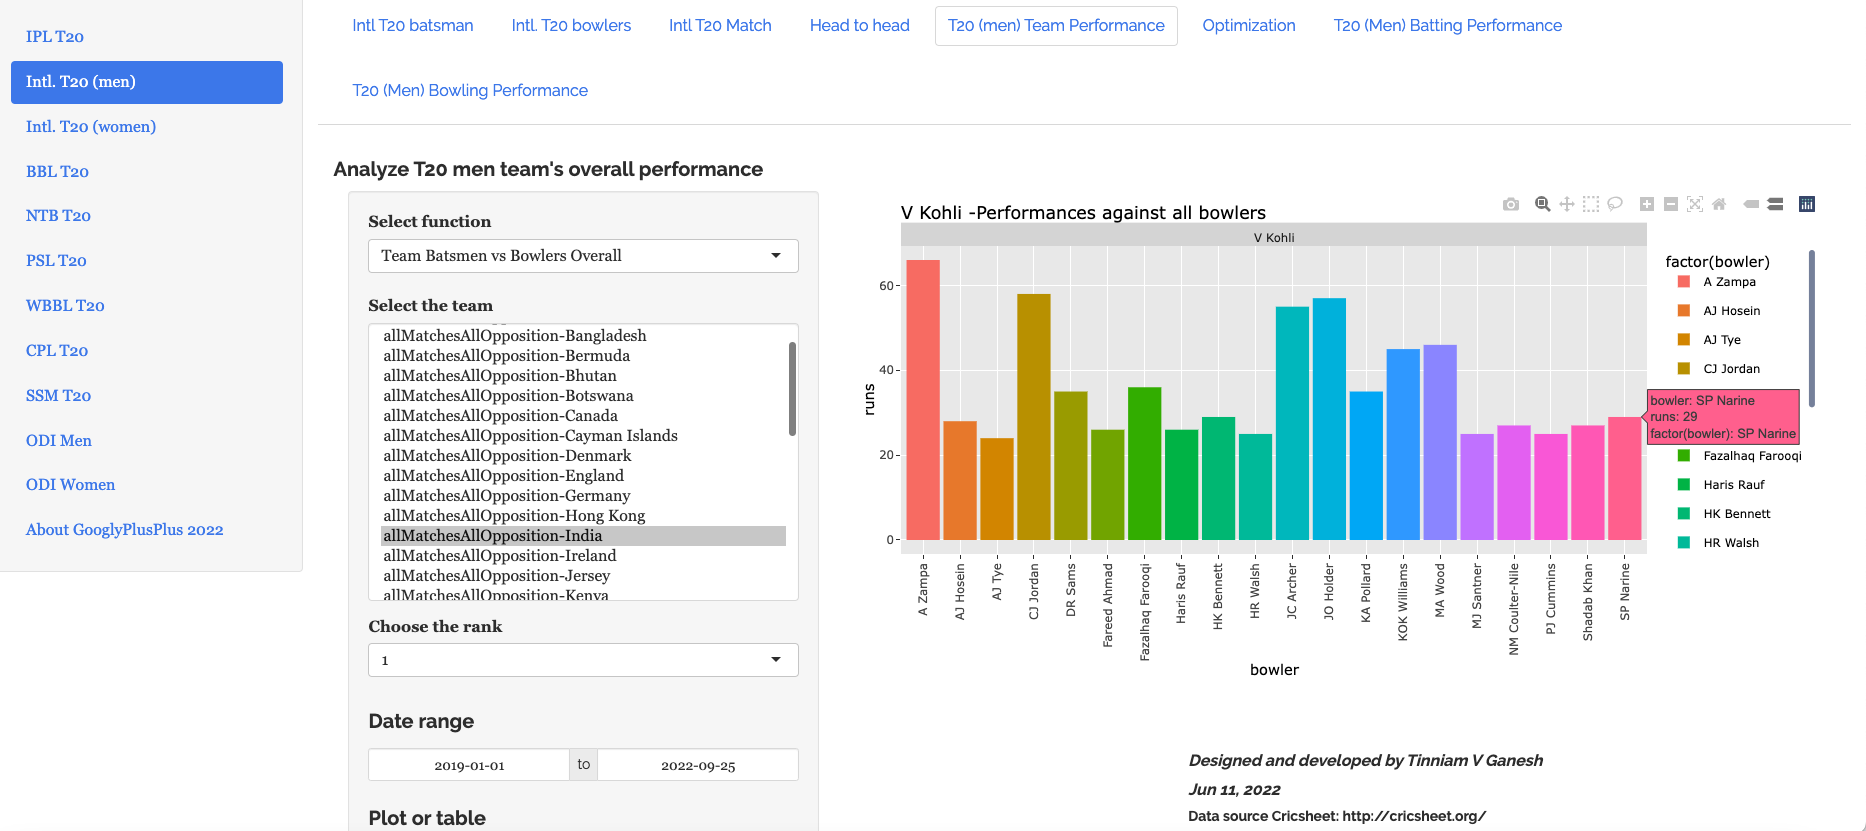
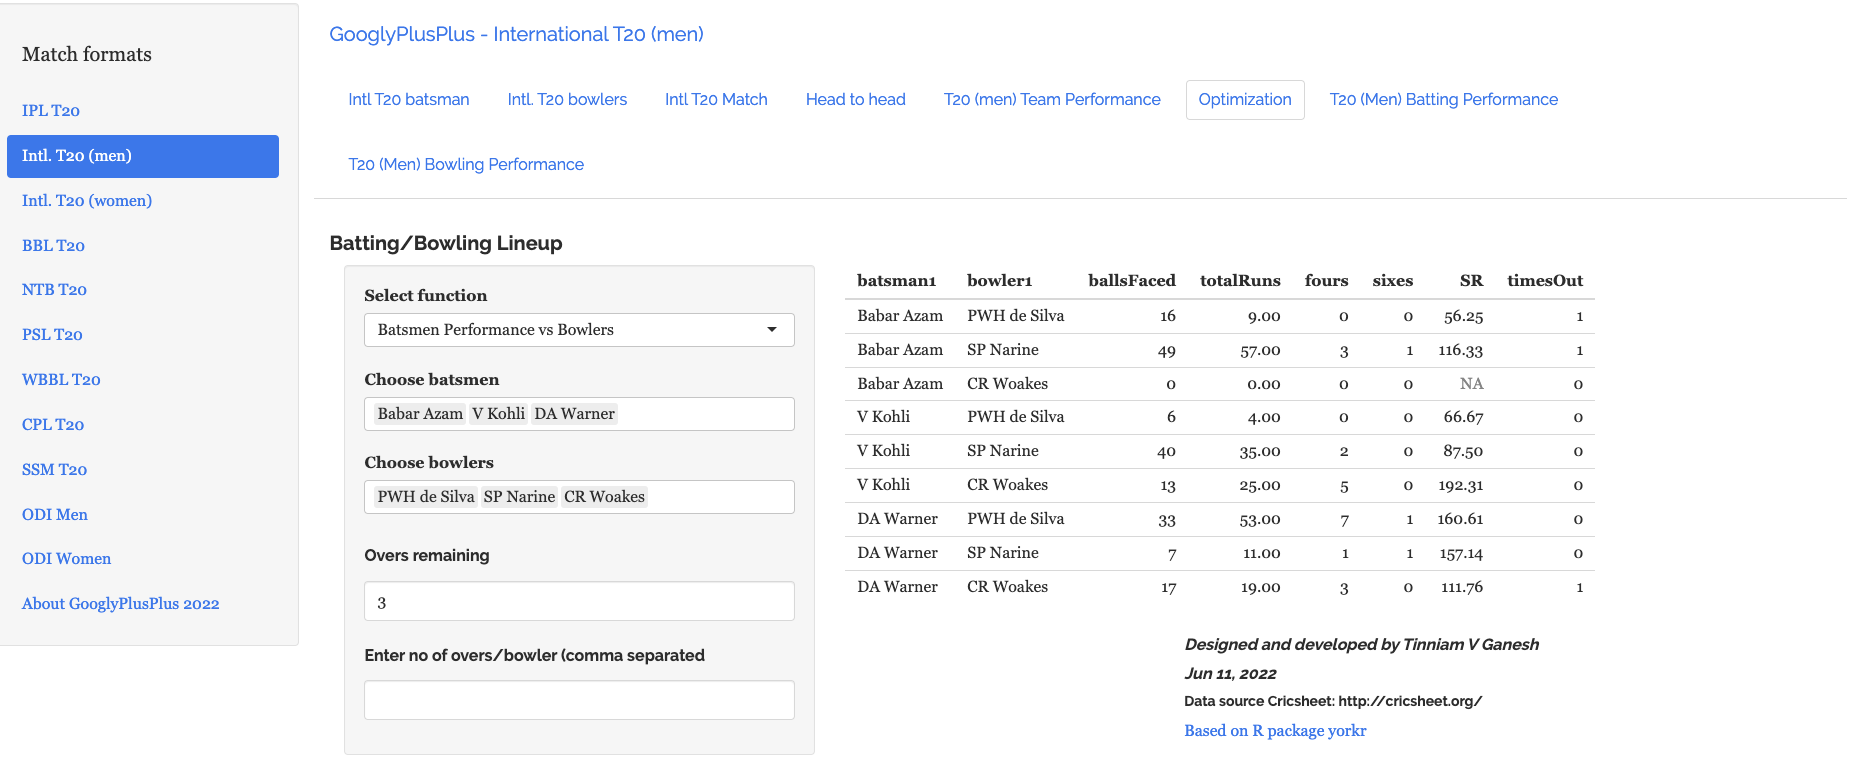
2. Scotland vs West Indies – 17 Oct 2022: Batsmen vs Bowlers

George Munsey was the top scorer for Scotland and was instrumental in the win against WI. His performance against West Indies bowlers is shown below. Note, the charts are interactive

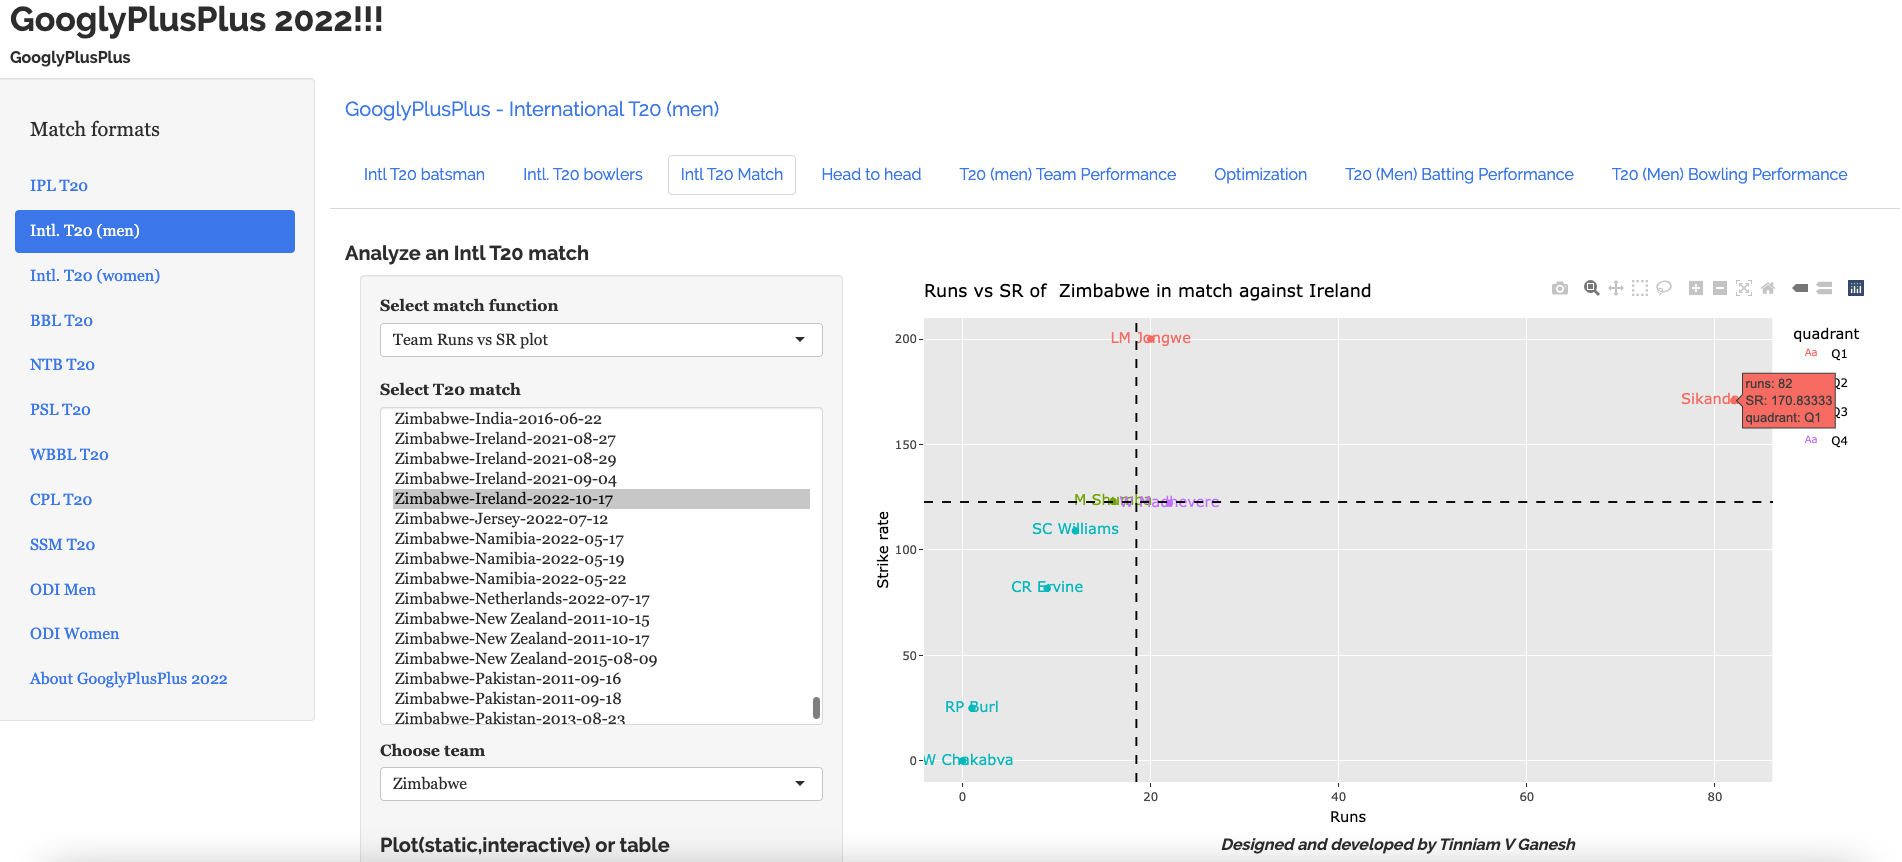
3. Zimbabwe vs Ireland – 17 Oct 2022 : Team Runs vs SR

Sikander Raza of Zimbabwe with 82 runs with the strike rate ~ 170

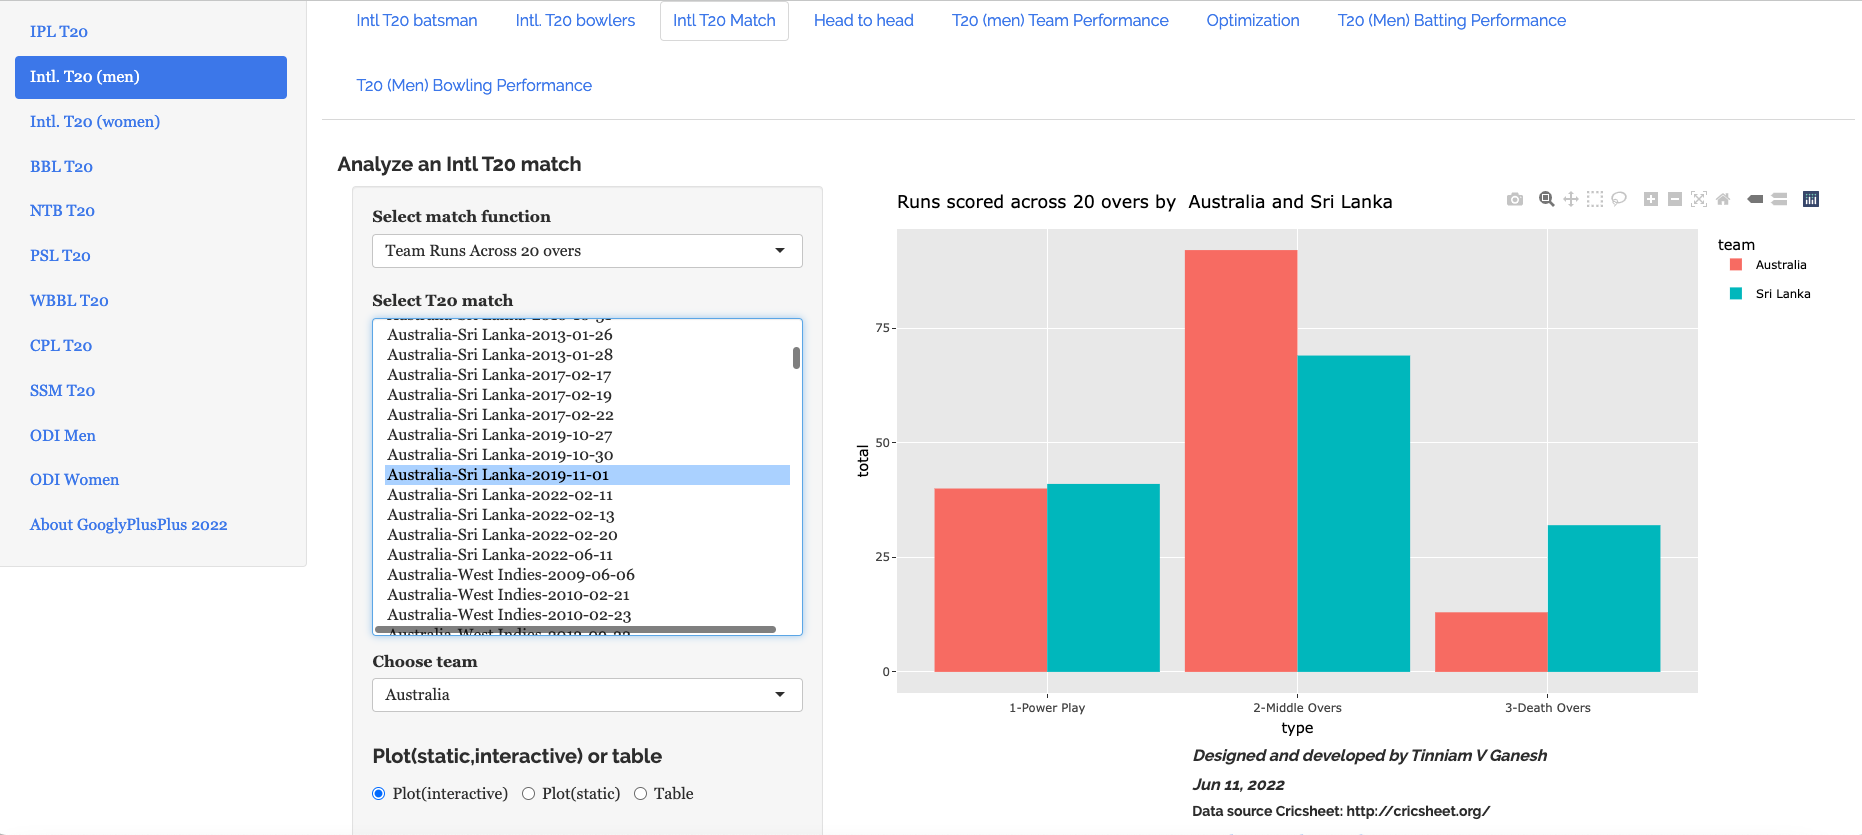
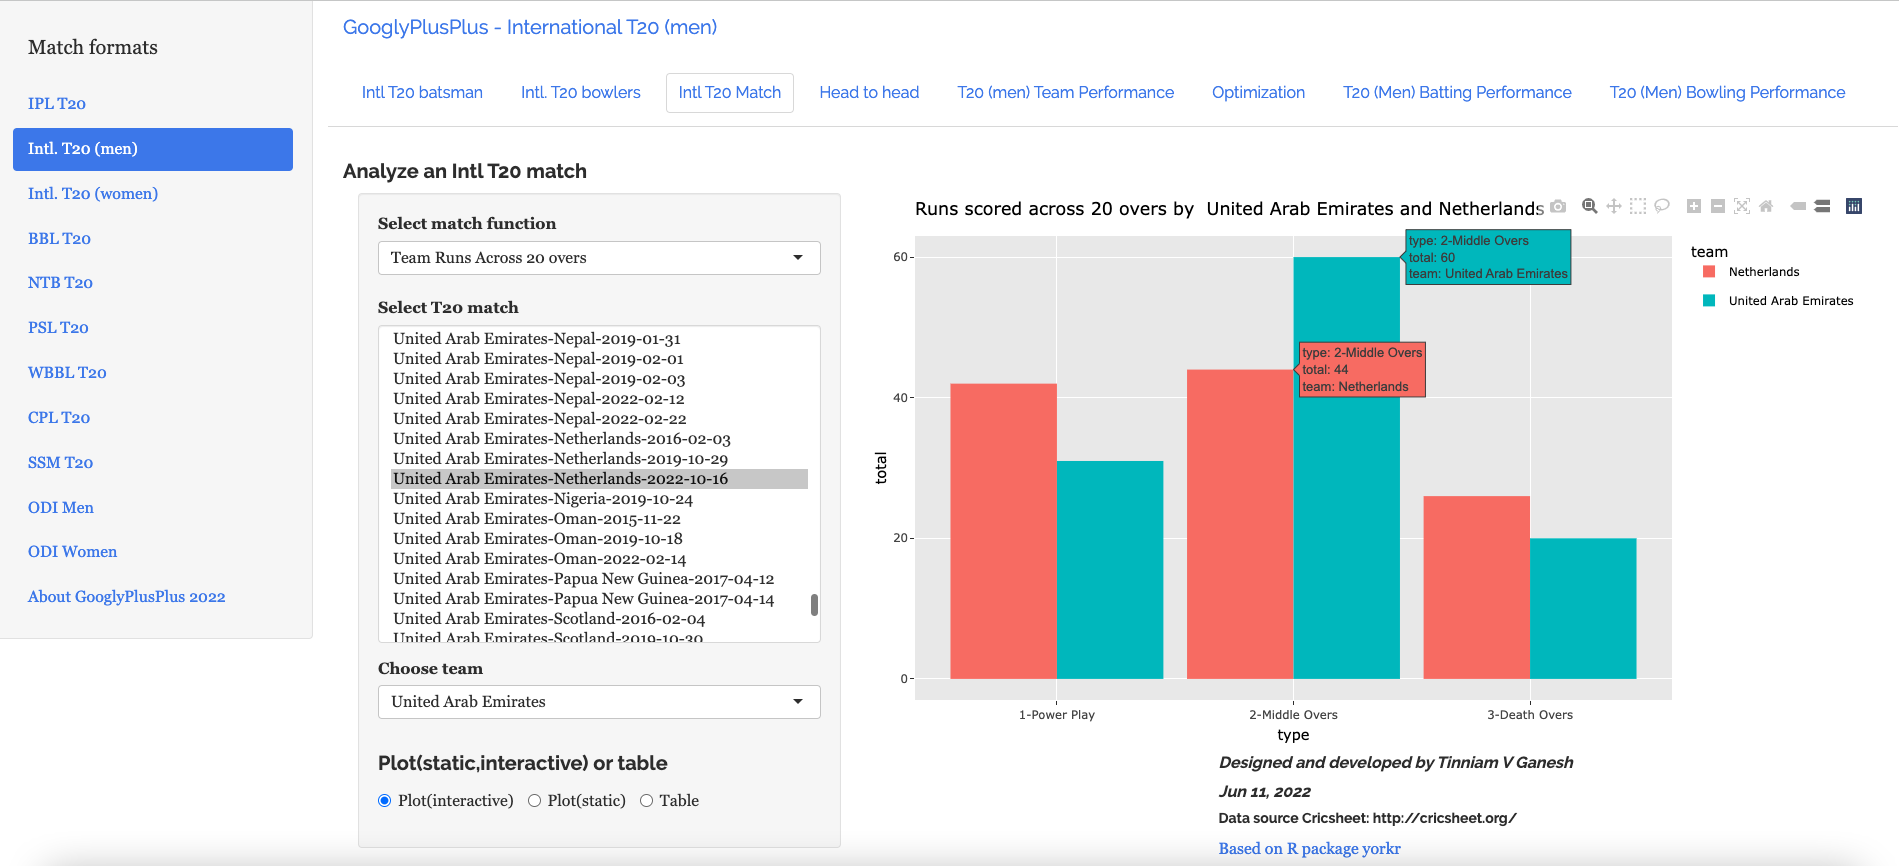
4. United Arab Emirates vs Netherlands – 16 Oct 2022: Team runs across 20 overs

UAE pipped Netherlands in the middle overs and were able to win by 1 ball and 3 wickets

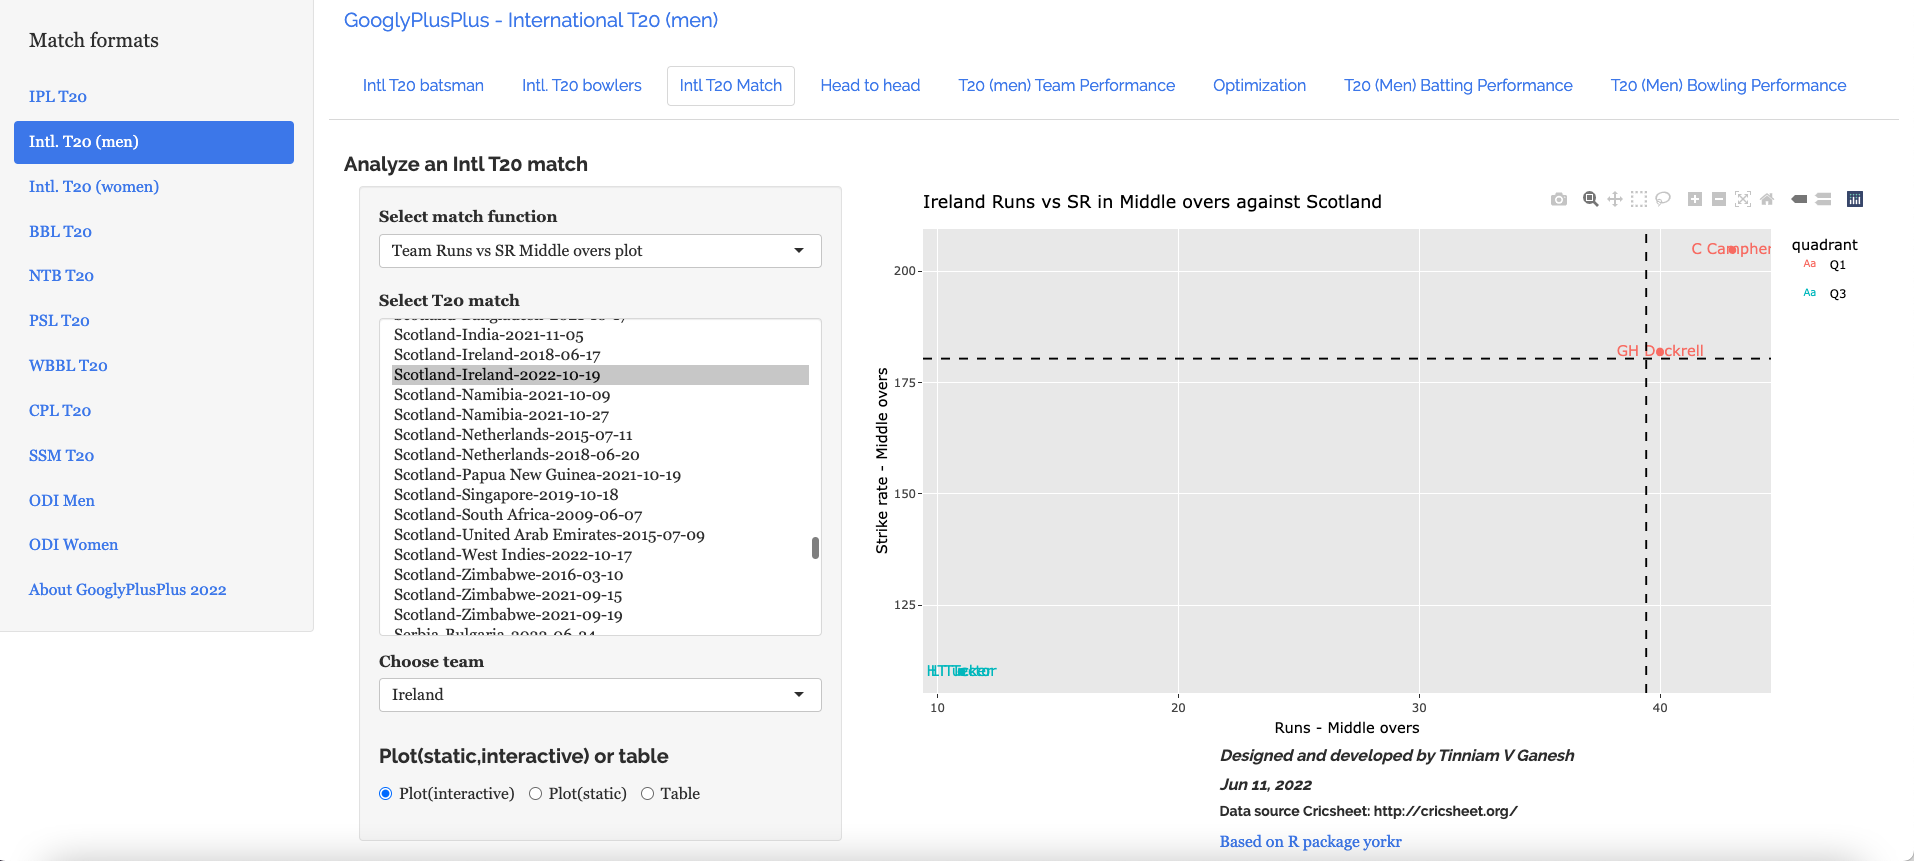
5. Scotland vs Ireland – 19 Oct 2022 : Team Runs vs SR Middle overs plot

Curtis Campher snatched the game away from Scotland with his stellar performance in middle and death overs

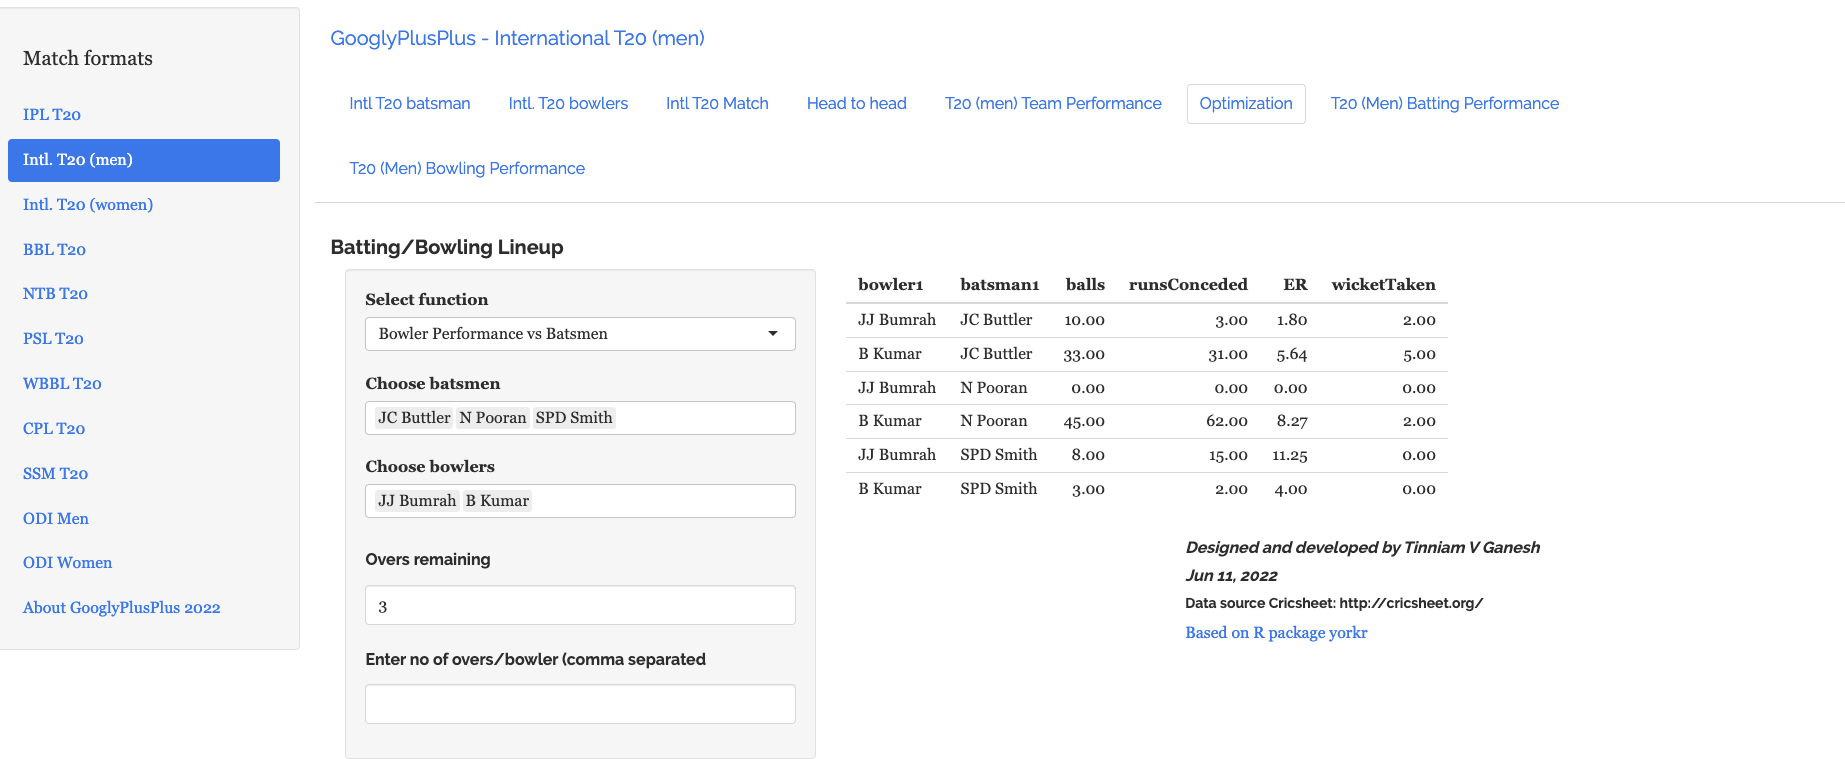
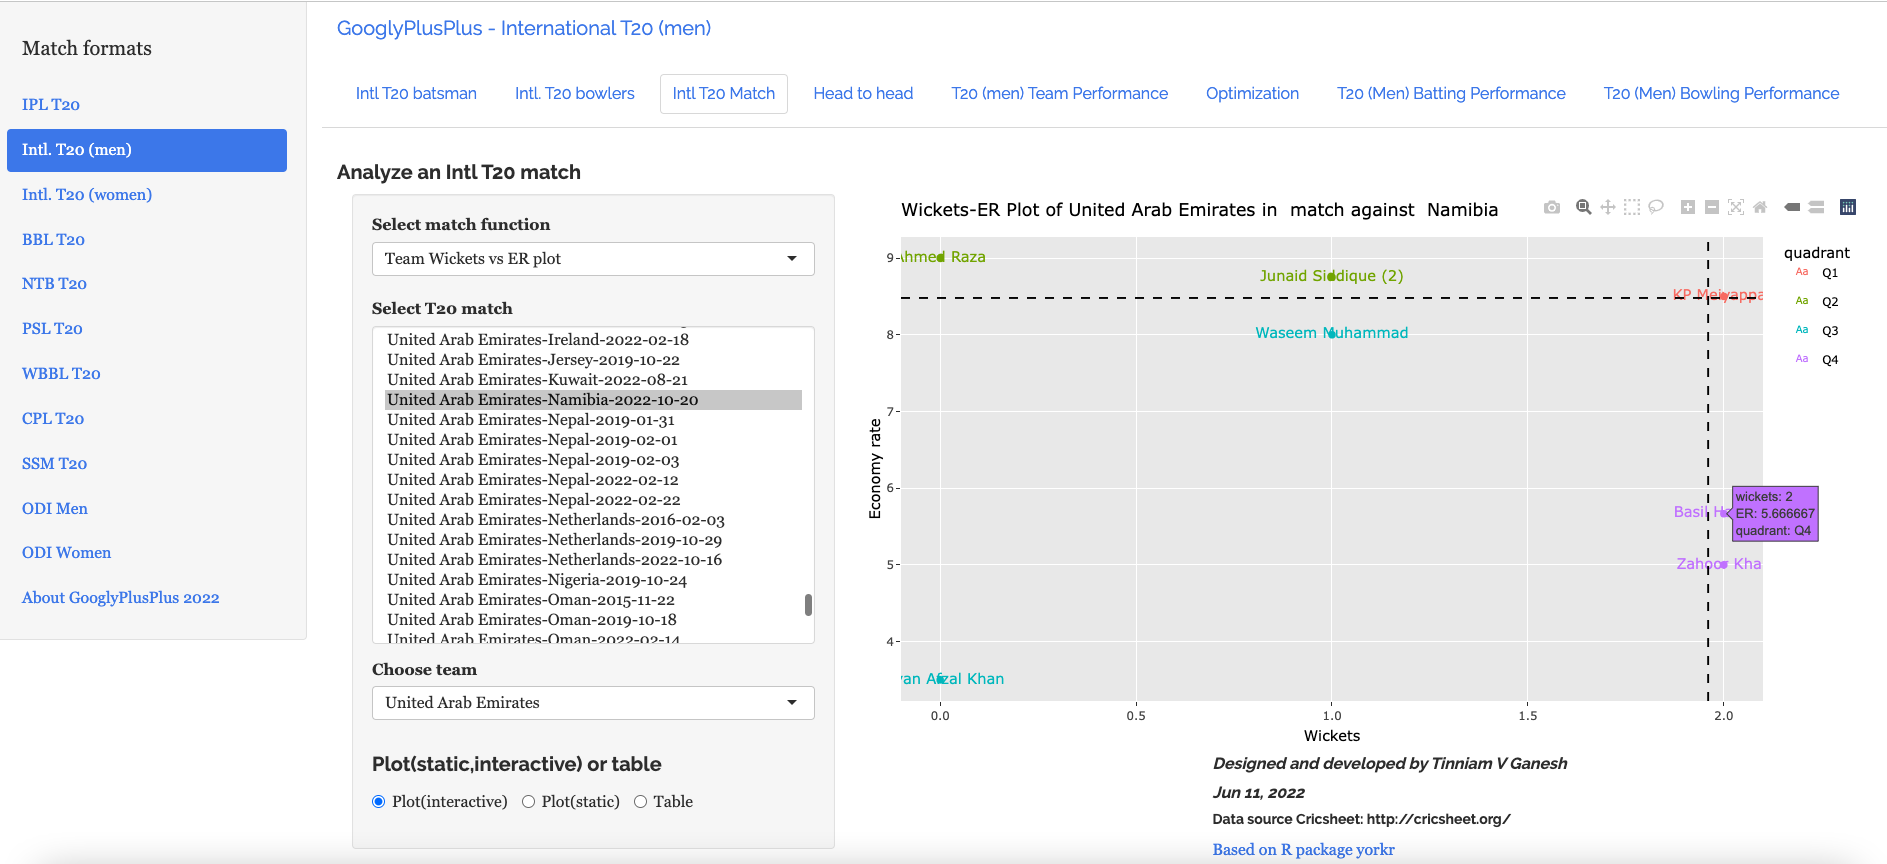
6. UAE vs Namibia : 20 Oct 2022 : Team Wickets vs ER plot

Basoor Hameed and Zahoor Khan got 2 wickets apiece with an economy rate of ~5.00 but still they were not able to stop UAE from stealing a win

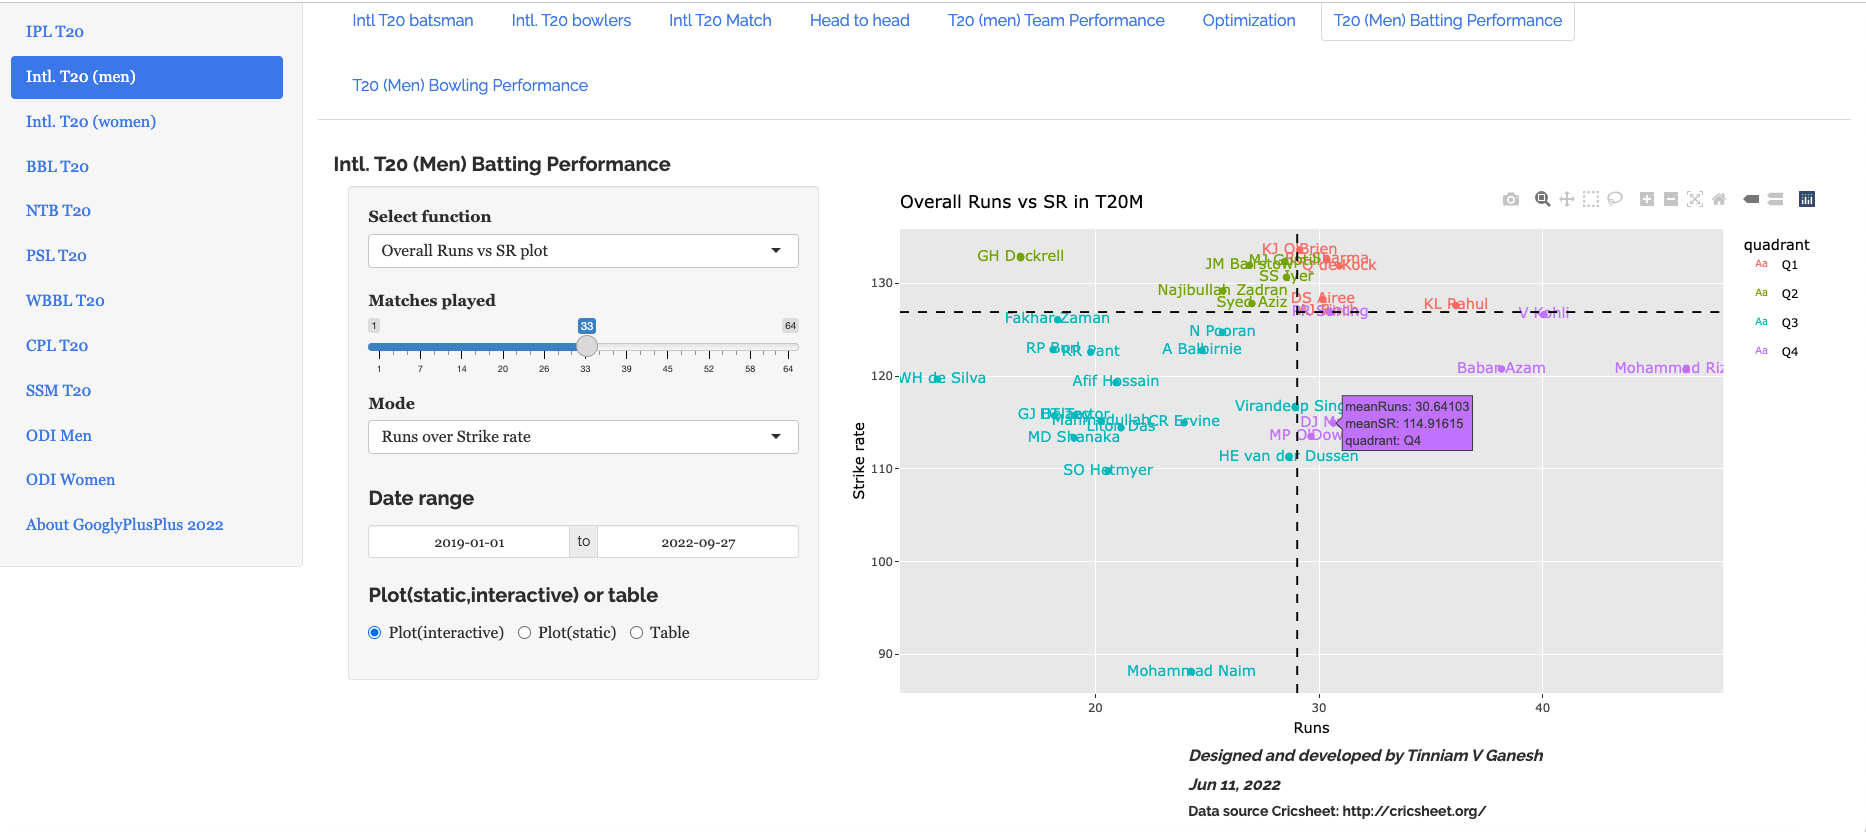
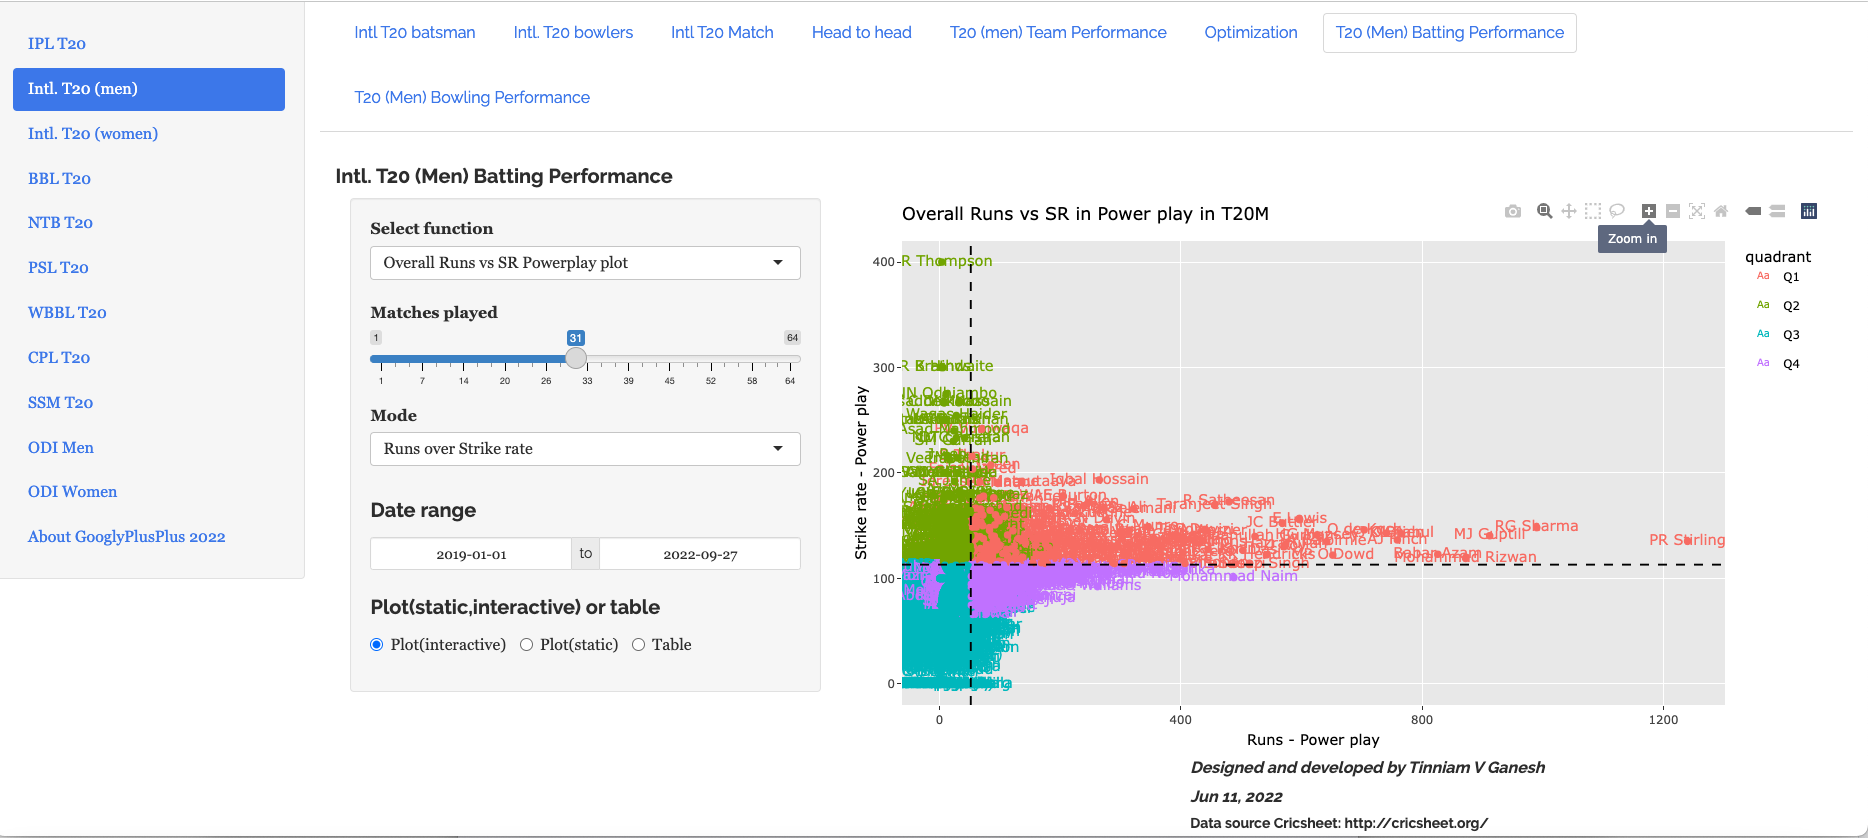
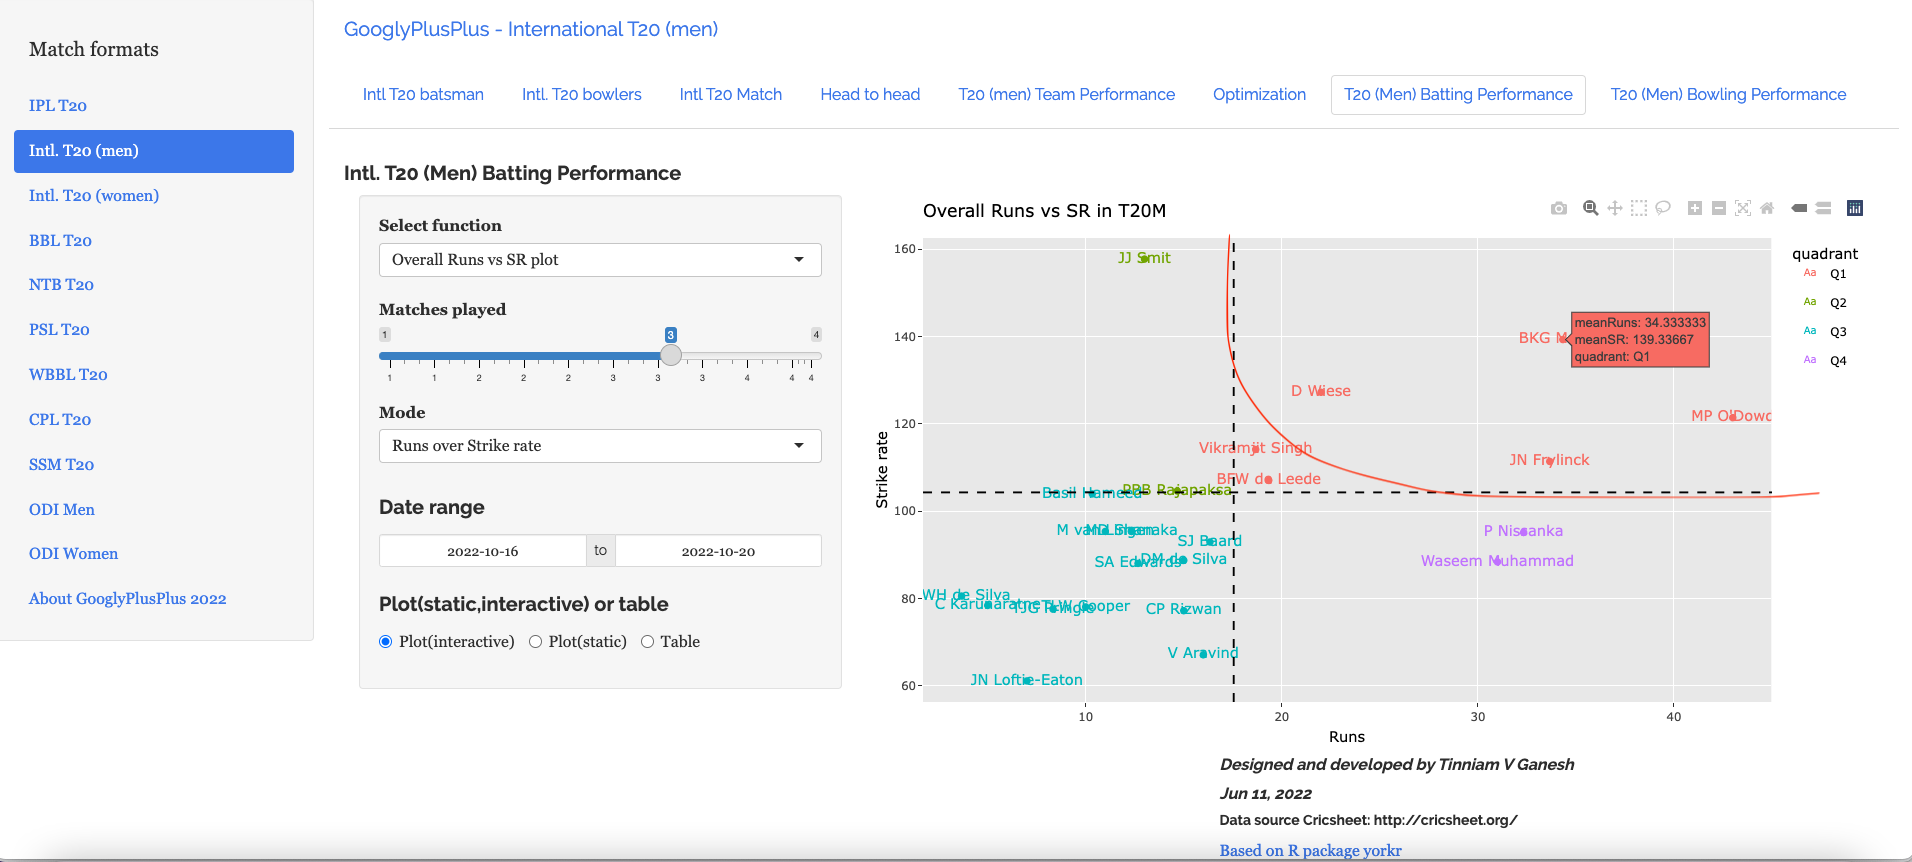
7. Overall Runs vs SR in T20 World Cup 2022

It is too early to rank the players, nevertheless in the current T20 World Cup, MP O’Dowd (Netherlands), BKG Mendis (Sri Lanka) and JN Frylinck(Namibia) are the top 3 batsmen with good runs and Strike Rate

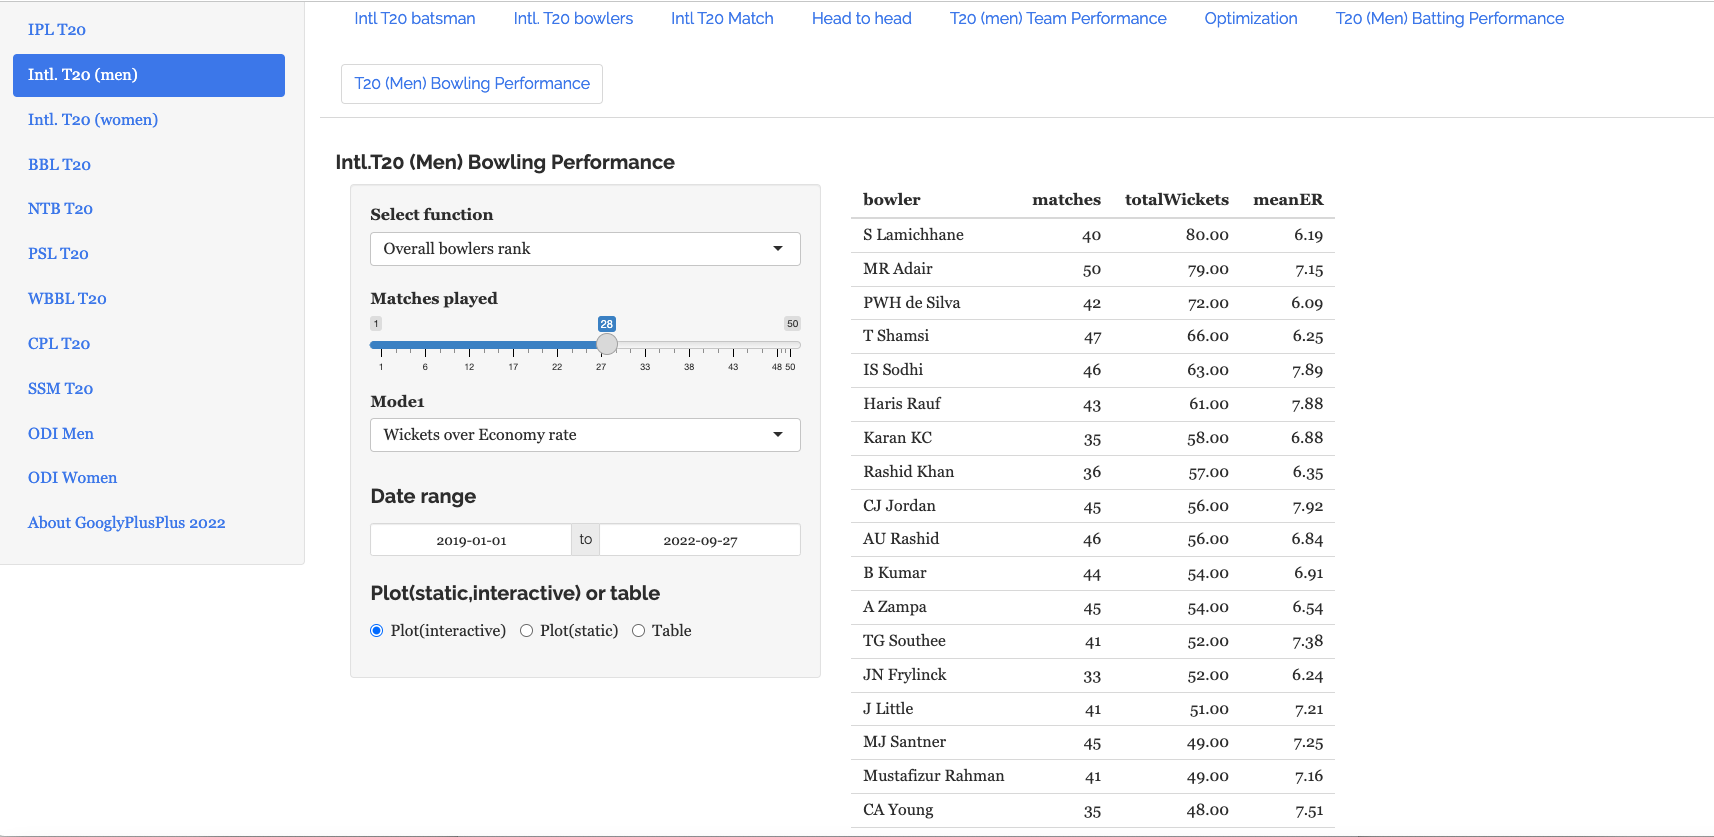
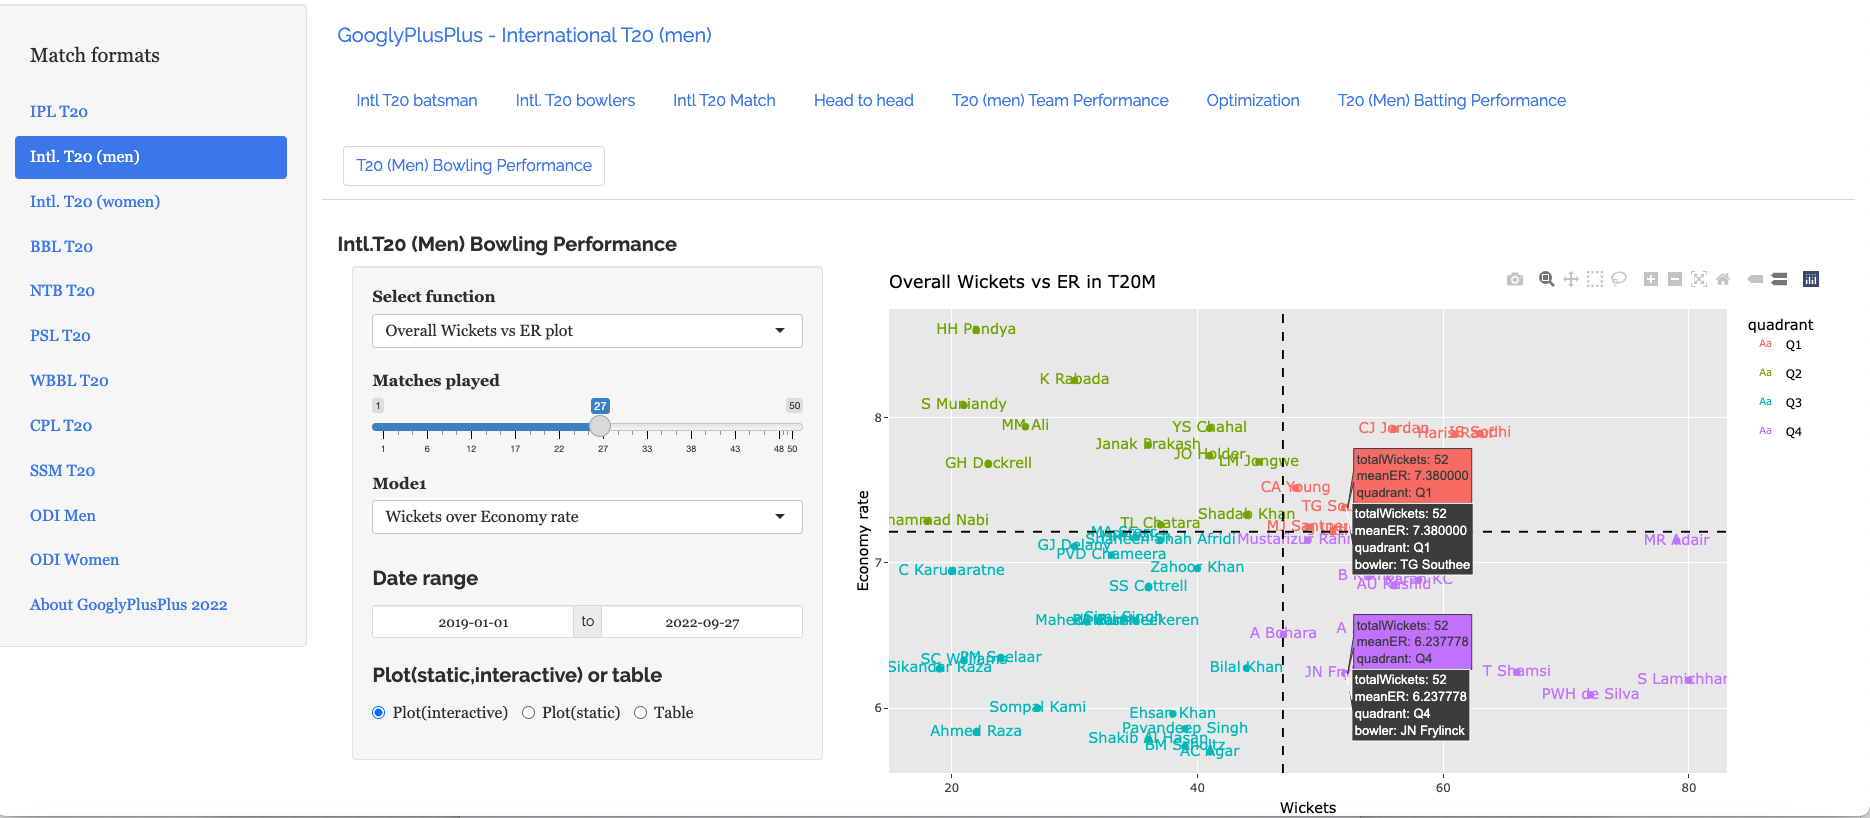
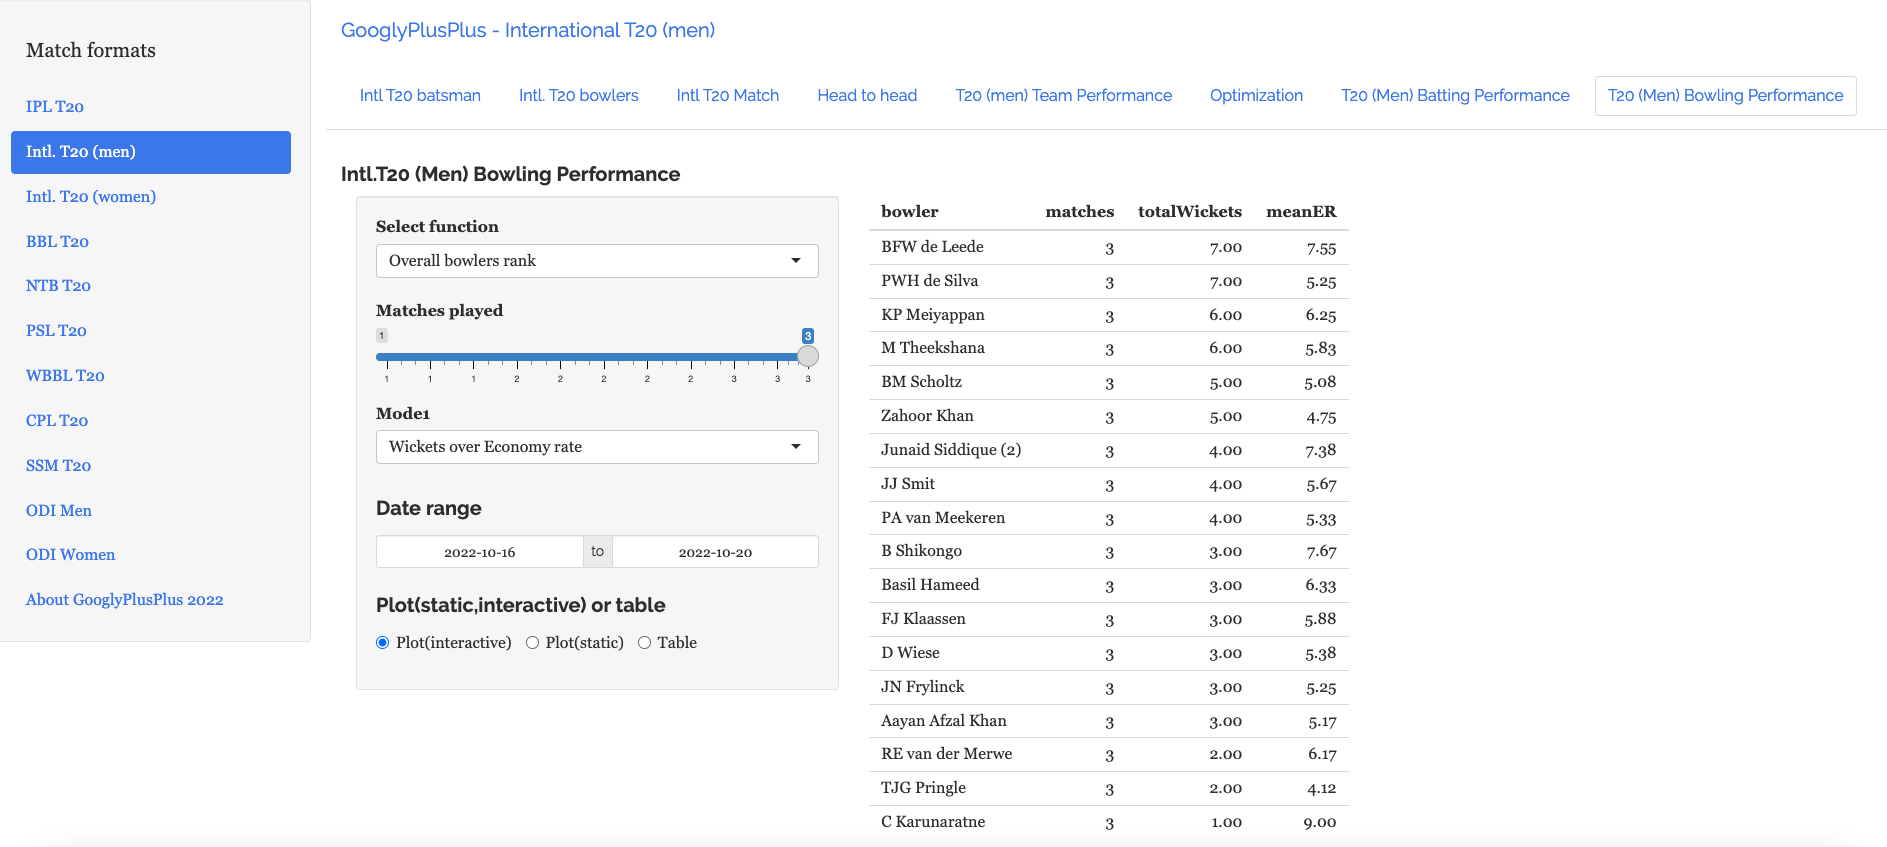
8. Overall Wickets over ER in T20 World Cup 2022

The top 3 bowlers so far in T20 World Cup 2022 are a) BFW de Leede (Netherlands) b) PWH De Silva (Sri Lanka) c) KP Meiyappan (UAE) with a total of 7,7, and 6 wickets respectively

Note: Besides the match analysis GooglyPlusPlus also provides detailed analysis of batsmen, bowlers, matches as above, team-vs-team, team-vs-all teams, ranking of batsmen & bowlers etc. For more details see my post GooglyPlusPlus gets ready for ICC Men’s T20 World Cup

Do visit GooglyPlusPlus everyday to check out the cricketing actions of matches gone by. You can also follow me on twitter @tvganesh_85 for daily highlights.

You may also like

  1. Introducing QCSimulator: A 5-qubit quantum computing simulator in R
  2. De-blurring revisited with Wiener filter using OpenCV
  3. Using Reinforcement Learning to solve Gridworld
  4. Deep Learning from first principles in Python, R and Octave – Part 3
  5. Getting started with Tensorflow, Keras in Python and R
  6. Big Data-4: Webserver log analysis with RDDs, Pyspark, SparkR and SparklyR
  7. Practical Machine Learning with R and Python – Part 5
  8. Cricpy takes a swing at the ODIs
  9. Video presentation on Machine Learning, Data Science, NLP and Big Data – Part 1

To see all posts click Index of posts

GooglyPlusPlus gets ready for ICC Men’s T20 World Cup

It is time!! So last weekend, I turned the wheels, moved the levers and listened to the hiss of steam, as I cranked up my Shiny app GooglyPlusPlus. The ICC Men’s T20 World Cup is just around the corner, and it was time to prepare for this event. This latest GooglyPlusPlus is current with the latest Intl. men’s T20 match data, give or take a few. GooglyPlusPlus can analyze batsmen, bowlers, matches, team-vs-team, team-vs-all teams, besides also ranking batsmen, bowlers and plot performances in Powerplay, middle and death overs.

In this post, I include a quick refresher of some of features of my app GooglyPlusPlus. Note: This is a random sampling of the functions available. There are more than 120+ features available in the app.

Check out your favourite players and your country’s team with GooglyPlusPlus

Note 1: All charts are interactive

Note 2: You can choose a date range for your analysis

Note 3: The data for this app is taken from Cricsheet

  1. T20 Batsman tab

This tab includes functions pertaining to individual batsmen. Functions include Runs vs Deliveries, moving average runs, cumulative average run, cumulative average strike rate, runs against opposition, runs at venue etc.

For e.g.

a) Suryakumar Yadav’s (India) cumulative strike rate

b) Mohammed Rizwan’s (Pakistan) performance against opposition

2. T20 Bowler’s Tab

The bowlers tab has functions for computing mean economy rate, moving average wickets, cumulative average wicks, cumulative economy rate, bowlers performance against opposition, bowlers performance in venue, predict wickets and others

A random function is shown below

a) Predict wickets for Wanindu Hasaranga of Sri Lanka

3. T20 Match tab

The match tab has functions that can compute match batting & bowling scorecard, batting partnerships, batsmen performance vs bowlers, bowler’s wicket kind, bowler’s wicket match, match worm graph, match worm wicket graph, team runs across 20 overs, team wickets in 20 overs, teams runs or wickets in powerplay, middle and death overs

Here are a couple of functions from this tab

a) Afghanistan vs Ireland – 2022-08-15

b) Australia vs Sri Lanka – 2019-11-01 – Runs across 20 overs

4. T20 Head-to-head tab

This tab provides the analysis of all combination of T20 teams (countries) in different aspects. This tab can compute the overall batting, bowling scorecard in all matches between 2 countries, batsmen partnerships, performances against bowlers, bowlers vs batsmen, runs, strike rate, wickets, economy rate across 20 overs, runs vs SR plot and wicket vs ER plot in all matches between team and so on. Here are a couple of examples from this tab

a) Bangladesh vs West Indies – Batting scorecard from 2019-01-01 to 2022-07-07

b) Wickets vs ER plot – England vs New Zealand – 2019-01-01 to 2021-11-10

5. T20 Team performance overall tab

This tab provides detailed analysis of the team’s performance against all other teams. As in the previous tab there are functions to compute the overall batting, bowling scorecard of a team against all other teams for any specific interval of time. This can help in picking out the most consistent batsmen, bowlers. Besides there are functions to compute overall batting partnerships, bowler vs batsmen, runs, wickets across 20 overs, run vs SR and wickets vs ER etc.

a) Batsmen vs Bowlers (Rank 1- V Kohli 2019-01-01 to 2022-09-25)

b) team Runs vs SR in Death overs (India) (2019-01-01 to 2022-09-25)

6) Optimisation tab

In the optimisation tab we can check the performance of a specific batsmen against specific bowlers or bowlers against batsmen

a) Batsmen vs Bowlers

b) Bowlers vs batsmen

7) T20 Batting Performance tab

This tab performs various analytics like ranking batsmen based on Run over SR and SR over Runs. Also you can plot overall Runs vs SR, and more specifically Runs vs SR in Powerplay, Middle and Death overs. All of this can be done for a specific date range. Here are some examples. The data includes all of T20 (all countries all matches)

a) Rank batsmen (Runs over SR, minimum matches played=33, date range=2019-01-01 to 2022-09-27)

The top 3 batsmen are Mohamen Rizwan, V Kohli and Babar Azam

b) Overall runs vs SR plot (2019-01-01 to 2022-09-27)

c) Overall Runs vs SR in Powerplay (all teams- 2019-01-01-2022-09-27)

This plot will be crowded. However, we can zoom into an area of interest. The controls for interacting with the plot are in the top of the plot as shown

Zooming in and panning to the area we can see the best performers in powerplay are as below

8) T20 Bowling Performance tab

This tab computes and ranks bowlers on Wickets over Economy and Economy rate over wickets. We can also compute and plot the Wickets vs ER in all matches , besides the Wickets vs ER in powerplay, middle and death overs with data from all countries

a) Rank Bowlers (Wickets over ER, minimum matches=28, 2019-01-01 to 2022-09-27)

b) Wickets vs ER plot

S Lamichhane (NEP), Hasaranga (SL) and Shamsi (SA) are excellent bowlers with high wickets and low ER as seen in the plot below

c) Wickets vs ER in death overs (2019-01-01 to 2022-09-27, min matches=24)

Zooming in and panning we see the best performers in death overs are MR Adair (IRE), Haris Rauf(PAK) and Chris Jordan (ENG)

With the excitement building up, it is time you checked out how your country will perform and the players who will do well.

Go ahead give GooglyPlusPlus a spin !!!

Also see

  1. Deep Learning from first principles in Python, R and Octave – Part 5
  2. Big Data-5: kNiFi-ing through cricket data with yorkpy
  3. Understanding Neural Style Transfer with Tensorflow and Keras
  4. De-blurring revisited with Wiener filter using OpenCV
  5. Re-introducing cricketr! : An R package to analyze performances of cricketers
  6. Modeling a Car in Android
  7. Presentation on “Intelligent Networks, CAMEL protocol, services & applications”
  8. Practical Machine Learning with R and Python – Part 2
  9. Cricpy adds team analytics to its arsenal!!
  10. Benford’s law meets IPL, Intl. T20 and ODI cricket

To see all posts click Index of posts