Understanding Neural Style Transfer with Tensorflow and Keras

Neural Style Transfer (NST)  is a fascinating area of Deep Learning and Convolutional Neural Networks. NST is an interesting technique, in which the style from an image, known as the ‘style image’ is transferred to another image ‘content image’ and we get a third a image which is a generated image which has the content of the original image and the style of another image.

NST can be used to reimagine how famous painters like Van Gogh, Claude Monet or a Picasso would have visualised a scenery or architecture. NST uses Convolutional Neural Networks (CNNs) to achieve this artistic style transfer from one image to another. NST was originally implemented by Gati et al., in their paper Neural Algorithm of Artistic Style. Convolutional Neural Networks have been very successful in image classification image recognition et cetera. CNN networks have also been have also generated very interesting pictures using Neural Style Transfer which will be shown in this post. An interesting aspect of CNN’s is that the first couple of layers in the CNN capture basic features of the image like edges and  pixel values. But as we go deeper into the CNN, the network captures higher level features of the input image.

To get started with Neural Style transfer  we will be using the VGG19 pre-trained network. The VGG19 CNN is a compact pre-trained your network which can be used for performing the NST. However, we could have also used Resnet or InceptionV3 networks for this purpose but these are very large networks. The idea of using a network trained on a different task and applying it to a new task is called transfer learning.

What needs to be done to transfer the style from one of the image to another image. This brings us to the question – What is ‘style’? What is it that distinguishes Van Gogh’s painting or Picasso’s cubist art. Convolutional Neural Networks capture basic features in the lower layers and much more complex features in the deeper layers.  Style can be computed by taking the correlation of the feature maps in a layer L. This is my interpretation of how style is captured.  Since style  is intrinsic to  the image, it  implies that the style feature would exist across all the filters in a layer. Hence, to pick up this style we would need to get the correlation of the filters across channels of a lawyer. This is computed mathematically, using the Gram matrix which calculates the correlation of the activation of a the filter by the style image and generated image

To transfer the style from one image to the content image we need to do two parallel operations while doing forward propagation
– Compute the content loss between the source image and the generated image
– Compute the style loss between the style image and the generated image
– Finally we need to compute the total loss

In order to get transfer the style from the ‘style’ image to the ‘content ‘image resulting in a  ‘generated’  image  the total loss has to be minimised. Therefore backward propagation with gradient descent  is done to minimise the total loss comprising of the content and style loss.

Initially we make the Generated Image ‘G’ the same as the source image ‘S’

The content loss at layer ‘l’

L_{content} = 1/2 \sum_{i}^{j} ( F^{l}_{i,j} - P^{l}_{i,j})^{2}

where F^{l}_{i,j} and P^{l}_{i,j} represent the activations at layer ‘l’ in a filter i, at position ‘j’. The intuition is that the activations will be same for similar source and generated image. We need to minimise the content loss so that the generated stylized image is as close to the original image as possible. An intermediate layer of VGG19 block5_conv2 is used

The Style layers that are are used are

style_layers = [‘block1_conv1’,
‘block2_conv1’,
‘block3_conv1’,
‘block4_conv1’,
‘block5_conv1’]
To compute the Style Loss the Gram matrix needs to be computed. The Gram Matrix is computed by unrolling the filters as shown below (source: Convolutional Neural Networks by Prof Andrew Ng, Coursera). The result is a matrix of size n_{c} x n_{c} where n_{c} is the number of channels
The above diagram shows the filters of height n_{H} and width n_{W} with n_{C} channels
The contribution of layer ‘l’ to style loss is given by
L^{'}_{style} = \frac{\sum_{i}^{j} (G^{2}_{i,j} - A^l{i,j})^2}{4N^{2}_{l}M^{2}_{l}}
where G_{i,j}  and A_{i,j} are the Gram matrices of the style and generated images respectively. By minimising the distance in the gram matrices of the style and generated image we can ensure that generated image is a stylized version of the original image similar to the style image
The total loss is given by
L_{total} = \alpha L_{content} + \beta L_{style}
Back propagation with gradient descent works to minimise the content loss between the source and generated image, while the style loss tries to minimise the discrepancies in the style of the style image and generated image. Running through forward and backpropagation through several epochs successfully transfers the style from the style image to the source image.
You can check the Notebook at Neural Style Transfer

Note: The code in this notebook is largely based on the Neural Style Transfer tutorial from Tensorflow, though I may have taken some changes from other blogs. I also made a few changes to the code in this tutorial, like removing the scaling factor, or the class definition (Personally, I belong to the old school (C language) and am not much in love with the ‘self.”..All references are included below

Note: Here is a interesting thought. Could we do a Neural Style Transfer in music? Imagine Carlos Santana playing ‘Hotel California’ or Brian May style in ‘Another brick in the wall’. While our first reaction would be that it may not sound good as we are used to style of these songs, we may be surprised by a possible style transfer. This is definitely music to the ears!


Here are few runs from this

A) Run 1

1. Neural Style Transfer – a) Content Image – My portrait.  b) Style Image – Wassily Kadinsky Oil on canvas, 1913, Vassily Kadinsky’s composition


2. Result of Neural Style Transfer


2) Run 2

a) Content Image – Portrait of my parents b) Style Image –  Vincent Van Gogh’s ,Starry Night Oil on canvas 1889


2. Result of Neural Style Transfer


Run 3

1.  Content Image – Caesar 2 (Masai Mara- 20 Jun 2018).  Style Image – The Great Wave at Kanagawa – Katsushika Hokosai, 1826-1833


Screenshot 2020-04-12 at 12.40.44 PM

2. Result of Neural Style Transfer

lkg


Run 4

1.   Content Image – Junagarh Fort , Rajasthan   Sep 2016              b) Style Image – Le Pont Japonais by Claude Monet, Oil on canvas, 1920


2. Result of Neural Style Transfer


Neural Style Transfer is a very ingenious idea which shows that we can segregate the style of a painting and transfer to another image.

References

1. A Neural Algorithm of Artistic Style, Leon A. Gatys, Alexander S. Ecker, Matthias Bethge
2. Neural style transfer
3. Neural Style Transfer: Creating Art with Deep Learning using tf.keras and eager execution
4. Convolutional Neural Network, DeepLearning.AI Specialization, Prof Andrew Ng
5. Intuitive Guide to Neural Style Transfer

See also

1. Big Data-5: kNiFi-ing through cricket data with yorkpy
2. Cricketr adds team analytics to its repertoire
3. Cricpy performs granular analysis of players
4. My book ‘Deep Learning from first principles:Second Edition’ now on Amazon
5. Programming Zen and now – Some essential tips-2
6. The Anomaly
7. Practical Machine Learning with R and Python – Part 5
8. Literacy in India – A deepR dive
9. “Is it an animal? Is it an insect?” in Android

To see all posts click Index of posts

Take 4+: Presentations on ‘Elements of Neural Networks and Deep Learning’ – Parts 1-8

“Lights, camera and … action – Take 4+!”

This post includes  a rework of all presentation of ‘Elements of Neural Networks and Deep  Learning Parts 1-8 ‘ since my earlier presentations had some missing parts, omissions and some occasional errors. So I have re-recorded all the presentations.
This series of presentation will do a deep-dive  into Deep Learning networks starting from the fundamentals. The equations required for performing learning in a L-layer Deep Learning network  are derived in detail, starting from the basics. Further, the presentations also discuss multi-class classification, regularization techniques, and gradient descent optimization methods in deep networks methods. Finally the presentations also touch on how  Deep Learning Networks can be tuned.

The corresponding implementations are available in vectorized R, Python and Octave are available in my book ‘Deep Learning from first principles:Second edition- In vectorized Python, R and Octave

1. Elements of Neural Networks and Deep Learning – Part 1
This presentation introduces Neural Networks and Deep Learning. A look at history of Neural Networks, Perceptrons and why Deep Learning networks are required and concluding with a simple toy examples of a Neural Network and how they compute. This part also includes a small digression on the basics of Machine Learning and how the algorithm learns from a data set

2. Elements of Neural Networks and Deep Learning – Part 2
This presentation takes logistic regression as an example and creates an equivalent 2 layer Neural network. The presentation also takes a look at forward & backward propagation and how the cost is minimized using gradient descent


The implementation of the discussed 2 layer Neural Network in vectorized R, Python and Octave are available in my post ‘Deep Learning from first principles in Python, R and Octave – Part 1‘

3. Elements of Neural Networks and Deep Learning – Part 3
This 3rd part, discusses a primitive neural network with an input layer, output layer and a hidden layer. The neural network uses tanh activation in the hidden layer and a sigmoid activation in the output layer. The equations for forward and backward propagation are derived.


To see the implementations for the above discussed video see my post ‘Deep Learning from first principles in Python, R and Octave – Part 2

4. Elements of Neural Network and Deep Learning – Part 4
This presentation is a continuation of my 3rd presentation in which I derived the equations for a simple 3 layer Neural Network with 1 hidden layer. In this video presentation, I discuss step-by-step the derivations for a L-Layer, multi-unit Deep Learning Network, with any activation function g(z)


The implementations of L-Layer, multi-unit Deep Learning Network in vectorized R, Python and Octave are available in my post Deep Learning from first principles in Python, R and Octave – Part 3

5. Elements of Neural Network and Deep Learning – Part 5
This presentation discusses multi-class classification using the Softmax function. The detailed derivation for the Jacobian of the Softmax is discussed, and subsequently the derivative of cross-entropy loss is also discussed in detail. Finally the final set of equations for a Neural Network with multi-class classification is derived.


The corresponding implementations in vectorized R, Python and Octave are available in the following posts
a. Deep Learning from first principles in Python, R and Octave – Part 4
b. Deep Learning from first principles in Python, R and Octave – Part 5

6. Elements of Neural Networks and Deep Learning – Part 6
This part discusses initialization methods specifically like He and Xavier. The presentation also focuses on how to prevent over-fitting using regularization. Lastly the dropout method of regularization is also discussed


The corresponding implementations in vectorized R, Python and Octave of the above discussed methods are available in my post Deep Learning from first principles in Python, R and Octave – Part 6

7. Elements of Neural Networks and Deep Learning – Part 7
This presentation introduces exponentially weighted moving average and shows how this is used in different approaches to gradient descent optimization. The key techniques discussed are learning rate decay, momentum method, rmsprop and adam.

The equivalent implementations of the gradient descent optimization techniques in R, Python and Octave can be seen in my post Deep Learning from first principles in Python, R and Octave – Part 7

8. Elements of Neural Networks and Deep Learning – Part 8
This last part touches on the method to adopt while tuning hyper-parameters in Deep Learning networks

Checkout my book ‘Deep Learning from first principles: Second Edition – In vectorized Python, R and Octave’. My book starts with the implementation of a simple 2-layer Neural Network and works its way to a generic L-Layer Deep Learning Network, with all the bells and whistles. The derivations have been discussed in detail. The code has been extensively commented and included in its entirety in the Appendix sections. My book is available on Amazon as paperback ($18.99) and in kindle version($9.99/Rs449).

This concludes this series of presentations on “Elements of Neural Networks and Deep Learning’

Also
1. My book ‘Practical Machine Learning in R and Python: Third edition’ on Amazon
2. Introducing cricpy:A python package to analyze performances of cricketers
3. Natural language processing: What would Shakespeare say?
4. Big Data-2: Move into the big league:Graduate from R to SparkR
5. Presentation on Wireless Technologies – Part 1
6. Introducing cricketr! : An R package to analyze performances of cricketers

To see all posts click Index of posts

My book ‘Deep Learning from first principles:Second Edition’ now on Amazon

The second edition of my book ‘Deep Learning from first principles:Second Edition- In vectorized Python, R and Octave’, is now available on Amazon, in both paperback ($18.99)  and kindle ($9.99/Rs449/-)  versions. Since this book is almost 70% code, all functions, and code snippets have been formatted to use the fixed-width font ‘Lucida Console’. In addition line numbers have been added to all code snippets. This makes the code more organized and much more readable. I have also fixed typos in the book

Untitled

You can download the PDF version of this book from Github at https://github.com/tvganesh/DeepLearningBook-2ndEd

The book includes the following chapters

Table of Contents
Preface 4
Introduction 6
1. Logistic Regression as a Neural Network 8
2. Implementing a simple Neural Network 23
3. Building a L- Layer Deep Learning Network 48
4. Deep Learning network with the Softmax 85
5. MNIST classification with Softmax 103
6. Initialization, regularization in Deep Learning 121
7. Gradient Descent Optimization techniques 167
8. Gradient Check in Deep Learning 197
1. Appendix A 214
2. Appendix 1 – Logistic Regression as a Neural Network 220
3. Appendix 2 - Implementing a simple Neural Network 227
4. Appendix 3 - Building a L- Layer Deep Learning Network 240
5. Appendix 4 - Deep Learning network with the Softmax 259
6. Appendix 5 - MNIST classification with Softmax 269
7. Appendix 6 - Initialization, regularization in Deep Learning 302
8. Appendix 7 - Gradient Descent Optimization techniques 344
9. Appendix 8 – Gradient Check 405
References 475

Also see
1. My book ‘Practical Machine Learning in R and Python: Second edition’ on Amazon
2. The 3rd paperback & kindle editions of my books on Cricket, now on Amazon
3. De-blurring revisited with Wiener filter using OpenCV
4. TWS-4: Gossip protocol: Epidemics and rumors to the rescue
5. A Cloud medley with IBM Bluemix, Cloudant DB and Node.js
6. Practical Machine Learning with R and Python – Part 6
7. GooglyPlus: yorkr analyzes IPL players, teams, matches with plots and tables
8. Fun simulation of a Chain in Android

To see posts click Index of Posts

Deep Learning from first principles in Python, R and Octave – Part 2

“What does the world outside your head really ‘look’ like? Not only is there no color, there’s also no sound: the compression and expansion of air is picked up by the ears, and turned into electrical signals. The brain then presents these signals to us as mellifluous tones and swishes and clatters and jangles. Reality is also odorless: there’s no such thing as smell outside our brains. Molecules floating through the air bind to receptors in our nose and are interpreted as different smells by our brain. The real world is not full of rich sensory events; instead, our brains light up the world with their own sensuality.”
The Brain: The Story of You” by David Eagleman

The world is Maya, illusory. The ultimate reality, the Brahman, is all-pervading and all-permeating, which is colourless, odourless, tasteless, nameless and formless
Bhagavad Gita

1. Introduction

This post is a follow-up post to my earlier post Deep Learning from first principles in Python, R and Octave-Part 1. In the first part, I implemented Logistic Regression, in vectorized Python,R and Octave, with a wannabe Neural Network (a Neural Network with no hidden layers). In this second part, I implement a regular, but somewhat primitive Neural Network (a Neural Network with just 1 hidden layer). The 2nd part implements classification of manually created datasets, where the different clusters of the 2 classes are not linearly separable.

Neural Network perform really well in learning all sorts of non-linear boundaries between classes. Initially logistic regression is used perform the classification and the decision boundary is plotted. Vanilla logistic regression performs quite poorly. Using SVMs with a radial basis kernel would have performed much better in creating non-linear boundaries. To see R and Python implementations of SVMs take a look at my post Practical Machine Learning with R and Python – Part 4.

Checkout my book ‘Deep Learning from first principles: Second Edition – In vectorized Python, R and Octave’. My book starts with the implementation of a simple 2-layer Neural Network and works its way to a generic L-Layer Deep Learning Network, with all the bells and whistles. The derivations have been discussed in detail. The code has been extensively commented and included in its entirety in the Appendix sections. My book is available on Amazon as paperback ($18.99) and in kindle version($9.99/Rs449).

You can download the PDF version of this book from Github at https://github.com/tvganesh/DeepLearningBook-2ndEd

You may also like my companion book “Practical Machine Learning with R and Python:Second Edition- Machine Learning in stereo” available in Amazon in paperback($10.99) and Kindle($7.99/Rs449) versions. This book is ideal for a quick reference of the various ML functions and associated measurements in both R and Python which are essential to delve deep into Deep Learning.

Take a look at my video presentation which discusses the below derivation step-by- step Elements of Neural Networks and Deep Learning – Part 3

You can clone and fork this R Markdown file along with the vectorized implementations of the 3 layer Neural Network for Python, R and Octave from Github DeepLearning-Part2

2. The 3 layer Neural Network

A simple representation of a 3 layer Neural Network (NN) with 1 hidden layer is shown below.
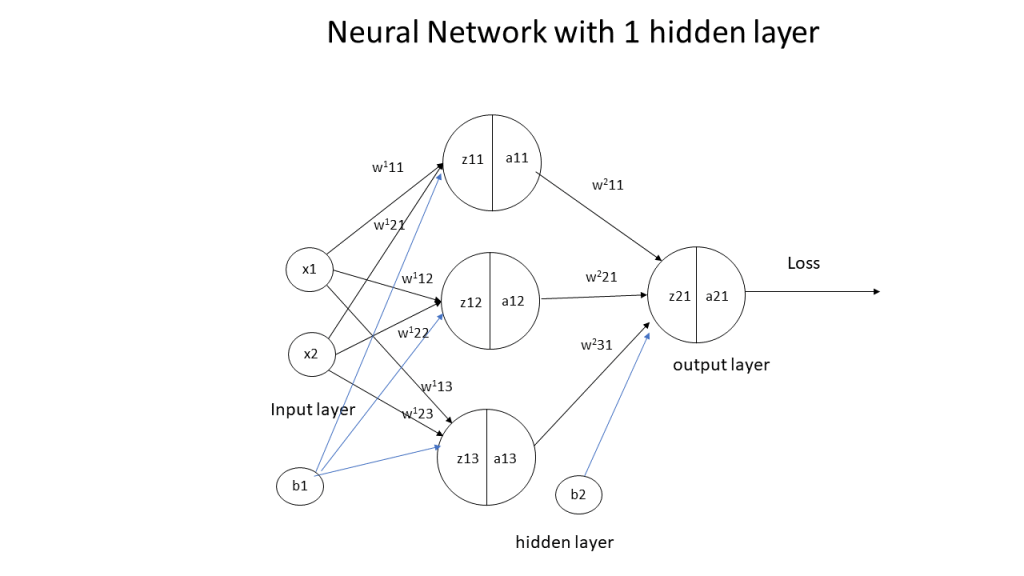
In the above Neural Network, there are 2 input features at the input layer, 3 hidden units at the hidden layer and 1 output layer as it deals with binary classification. The activation unit at the hidden layer can be a tanh, sigmoid, relu etc. At the output layer the activation is a sigmoid to handle binary classification

# Superscript indicates layer 1
z_{11} = w_{11}^{1}x_{1} + w_{21}^{1}x_{2} + b_{1}
z_{12} = w_{12}^{1}x_{1} + w_{22}^{1}x_{2} + b_{1}
z_{13} = w_{13}^{1}x_{1} + w_{23}^{1}x_{2} + b_{1}

Also a_{11} = tanh(z_{11})
a_{12} = tanh(z_{12})
a_{13} = tanh(z_{13})

# Superscript indicates layer 2
z_{21} = w_{11}^{2}a_{11} + w_{21}^{2}a_{12} + w_{31}^{2}a_{13} + b_{2}
a_{21} = sigmoid(z21)

Hence
Z1= \begin{pmatrix} z11\\ z12\\ z13 \end{pmatrix} =\begin{pmatrix} w_{11}^{1} & w_{21}^{1} \\ w_{12}^{1} & w_{22}^{1} \\ w_{13}^{1} & w_{23}^{1} \end{pmatrix} * \begin{pmatrix} x1\\ x2 \end{pmatrix} + b_{1}
And
A1= \begin{pmatrix} a11\\ a12\\ a13 \end{pmatrix} = \begin{pmatrix} tanh(z11)\\ tanh(z12)\\ tanh(z13) \end{pmatrix}

Similarly
Z2= z_{21} = \begin{pmatrix} w_{11}^{2} & w_{21}^{2} & w_{31}^{2} \end{pmatrix} *\begin{pmatrix} z_{11}\\ z_{12}\\ z_{13} \end{pmatrix} +b_{2}
and A2 = a_{21} = sigmoid(z_{21})

These equations can be written as
Z1 = W1 * X + b1
A1 = tanh(Z1)
Z2 = W2 * A1 + b2
A2 = sigmoid(Z2)

I) Some important results (a memory refresher!)
d/dx(e^{x}) = e^{x} and d/dx(e^{-x}) = -e^{-x} -(a) and
sinhx = (e^{x} - e^{-x})/2 and coshx = (e^{x} + e^{-x})/2
Using (a) we can shown that d/dx(sinhx) = coshx and d/dx(coshx) = sinhx (b)
Now d/dx(f(x)/g(x)) = (g(x)*d/dx(f(x)) - f(x)*d/dx(g(x)))/g(x)^{2} -(c)

Since tanhx =z= sinhx/coshx and using (b) we get
tanhx = (coshx*d/dx(sinhx) - sinhx*d/dx(coshx))/(cosh^{2})
Using the values of the derivatives of sinhx and coshx from (b) above we get
d/dx(tanhx) = (coshx^{2} - sinhx{2})/coshx{2} = 1 - tanhx^{2}
Since tanhx =z
d/dx(tanhx) = 1 - tanhx^{2}= 1 - z^{2} -(d)

II) Derivatives
L=-(Ylog(A2) + (1-Y)log(1-A2))
dL/dA2 = -(Y/A2 + (1-Y)/(1-A2))
Since A2 = sigmoid(Z2) therefore dA2/dZ2 = A2(1-A2) see Part1
Z2 = W2A1 +b2
dZ2/dW2 = A1
dZ2/db2 = 1
A1 = tanh(Z1) and dA1/dZ1 = 1 - A1^{2}
Z1 = W1X + b1
dZ1/dW1 = X
dZ1/db1 = 1

III) Back propagation
Using the derivatives from II) we can derive the following results using Chain Rule
\partial L/\partial Z2 = \partial L/\partial A2 * \partial A2/\partial Z2
= -(Y/A2 + (1-Y)/(1-A2)) * A2(1-A2) = A2 - Y
\partial L/\partial W2 = \partial L/\partial A2 * \partial A2/\partial Z2 * \partial Z2/\partial W2
= (A2-Y) *A1 -(A)
\partial L/\partial b2 = \partial L/\partial A2 * \partial A2/\partial Z2 * \partial Z2/\partial b2 = (A2-Y) -(B)

\partial L/\partial Z1 = \partial L/\partial A2 * \partial A2/\partial Z2 * \partial Z2/\partial A1 *\partial A1/\partial Z1 = (A2-Y) * W2 * (1-A1^{2})
\partial L/\partial W1 = \partial L/\partial A2 * \partial A2/\partial Z2 * \partial Z2/\partial A1 *\partial A1/\partial Z1 *\partial Z1/\partial W1
=(A2-Y) * W2 * (1-A1^{2}) * X -(C)
\partial L/\partial b1 = \partial L/\partial A2 * \partial A2/\partial Z2 * \partial Z2/\partial A1 *dA1/dZ1 *dZ1/db1
= (A2-Y) * W2 * (1-A1^{2}) -(D)

IV) Gradient Descent
The key computations in the backward cycle are
W1 = W1-learningRate * \partial L/\partial W1 – From (C)
b1 = b1-learningRate * \partial L/\partial b1 – From (D)
W2 = W2-learningRate * \partial L/\partial W2 – From (A)
b2 = b2-learningRate * \partial L/\partial b2 – From (B)

The weights and biases (W1,b1,W2,b2) are updated for each iteration thus minimizing the loss/cost.

These derivations can be represented pictorially using the computation graph (from the book Deep Learning by Ian Goodfellow, Joshua Bengio and Aaron Courville)

3. Manually create a data set that is not lineary separable

Initially I create a dataset with 2 classes which has around 9 clusters that cannot be separated by linear boundaries. Note: This data set is saved as data.csv and is used for the R and Octave Neural networks to see how they perform on the same dataset.

import numpy as np
import matplotlib.pyplot as plt
import matplotlib.colors
import sklearn.linear_model

from sklearn.model_selection import train_test_split
from sklearn.datasets import make_classification, make_blobs
from matplotlib.colors import ListedColormap
import sklearn
import sklearn.datasets


colors=['black','gold']
cmap = matplotlib.colors.ListedColormap(colors)
X, y = make_blobs(n_samples = 400, n_features = 2, centers = 7,
                       cluster_std = 1.3, random_state = 4)
#Create 2 classes
y=y.reshape(400,1)
y = y % 2
#Plot the figure
plt.figure()
plt.title('Non-linearly separable classes')
plt.scatter(X[:,0], X[:,1], c=y,
           marker= 'o', s=50,cmap=cmap)
plt.savefig('fig1.png', bbox_inches='tight')

4. Logistic Regression

On the above created dataset, classification with logistic regression is performed, and the decision boundary is plotted. It can be seen that logistic regression performs quite poorly

import numpy as np
import matplotlib.pyplot as plt
import matplotlib.colors
import sklearn.linear_model

from sklearn.model_selection import train_test_split
from sklearn.datasets import make_classification, make_blobs
from matplotlib.colors import ListedColormap
import sklearn
import sklearn.datasets

#from DLfunctions import plot_decision_boundary
execfile("./DLfunctions.py") # Since import does not work in Rmd!!!

colors=['black','gold']
cmap = matplotlib.colors.ListedColormap(colors)
X, y = make_blobs(n_samples = 400, n_features = 2, centers = 7,
                       cluster_std = 1.3, random_state = 4)
#Create 2 classes
y=y.reshape(400,1)
y = y % 2

# Train the logistic regression classifier
clf = sklearn.linear_model.LogisticRegressionCV();
clf.fit(X, y);

# Plot the decision boundary for logistic regression
plot_decision_boundary_n(lambda x: clf.predict(x), X.T, y.T,"fig2.png")

5. The 3 layer Neural Network in Python (vectorized)

The vectorized implementation is included below. Note that in the case of Python a learning rate of 0.5 and 3 hidden units performs very well.

## Random data set with 9 clusters
import numpy as np
import matplotlib
import matplotlib.pyplot as plt
import sklearn.linear_model
import pandas as pd

from sklearn.datasets import make_classification, make_blobs
execfile("./DLfunctions.py") # Since import does not work in Rmd!!!

X1, Y1 = make_blobs(n_samples = 400, n_features = 2, centers = 9,
                       cluster_std = 1.3, random_state = 4)
#Create 2 classes
Y1=Y1.reshape(400,1)
Y1 = Y1 % 2
X2=X1.T
Y2=Y1.T

#Perform gradient descent
parameters,costs = computeNN(X2, Y2, numHidden = 4, learningRate=0.5, numIterations = 10000)
plot_decision_boundary(lambda x: predict(parameters, x.T), X2, Y2,str(4),str(0.5),"fig3.png")
## Cost after iteration 0: 0.692669
## Cost after iteration 1000: 0.246650
## Cost after iteration 2000: 0.227801
## Cost after iteration 3000: 0.226809
## Cost after iteration 4000: 0.226518
## Cost after iteration 5000: 0.226331
## Cost after iteration 6000: 0.226194
## Cost after iteration 7000: 0.226085
## Cost after iteration 8000: 0.225994
## Cost after iteration 9000: 0.225915


6. The 3 layer Neural Network in R (vectorized)

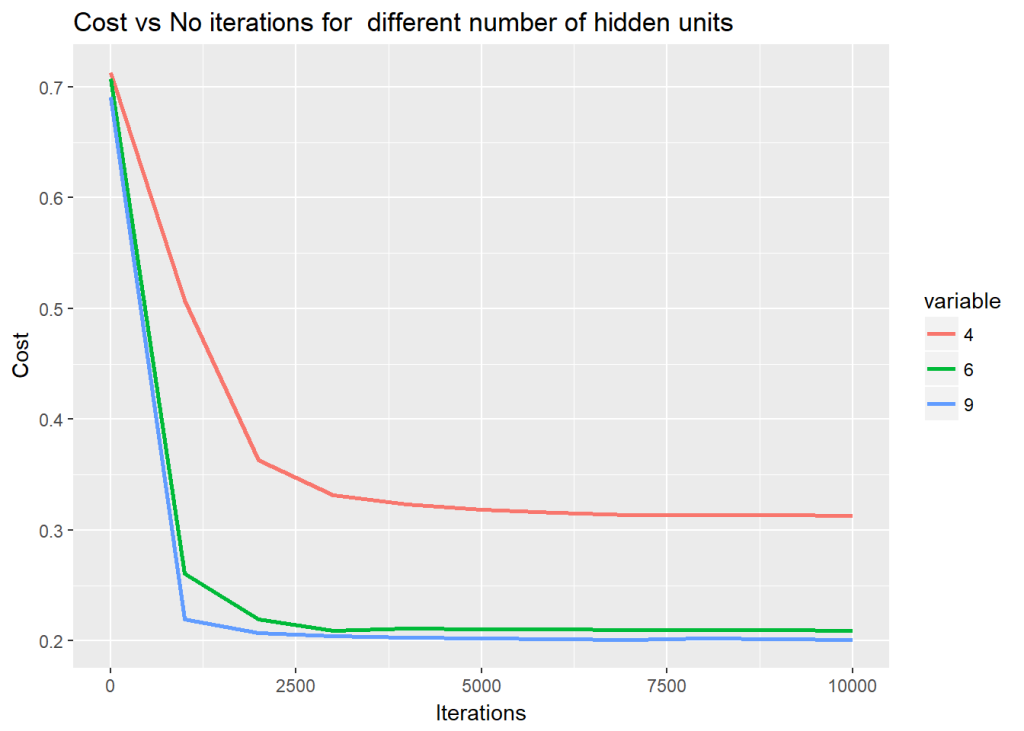
For this the dataset created by Python is saved  to see how R performs on the same dataset. The vectorized implementation of a Neural Network was just a little more interesting as R does not have a similar package like ‘numpy’. While numpy handles broadcasting implicitly, in R I had to use the ‘sweep’ command to broadcast. The implementaion is included below. Note that since the initialization with random weights is slightly different, R performs best with a learning rate of 0.1 and with 6 hidden units

source("DLfunctions2_1.R")
z <- as.matrix(read.csv("data.csv",header=FALSE)) # 
x <- z[,1:2]
y <- z[,3]
x1 <- t(x)
y1 <- t(y)
#Perform gradient descent
nn <-computeNN(x1, y1, 6, learningRate=0.1,numIterations=10000) # Good
## [1] 0.7075341
## [1] 0.2606695
## [1] 0.2198039
## [1] 0.2091238
## [1] 0.211146
## [1] 0.2108461
## [1] 0.2105351
## [1] 0.210211
## [1] 0.2099104
## [1] 0.2096437
## [1] 0.209409
plotDecisionBoundary(z,nn,6,0.1)


 7.  The 3 layer Neural Network in Octave (vectorized)

This uses the same dataset that was generated using Python code.
source("DL-function2.m")
data=csvread("data.csv");
X=data(:,1:2);
Y=data(:,3);
# Make sure that the model parameters are correct. Take the transpose of X & Y

#Perform gradient descent
[W1,b1,W2,b2,costs]= computeNN(X', Y',4, learningRate=0.5, numIterations = 10000);

8a. Performance  for different learning rates (Python)

import numpy as np
import matplotlib
import matplotlib.pyplot as plt
import sklearn.linear_model
import pandas as pd

from sklearn.datasets import make_classification, make_blobs
execfile("./DLfunctions.py") # Since import does not work in Rmd!!!
# Create data
X1, Y1 = make_blobs(n_samples = 400, n_features = 2, centers = 9,
                       cluster_std = 1.3, random_state = 4)
#Create 2 classes
Y1=Y1.reshape(400,1)
Y1 = Y1 % 2
X2=X1.T
Y2=Y1.T
# Create a list of learning rates
learningRate=[0.5,1.2,3.0]
df=pd.DataFrame()
#Compute costs for each learning rate
for lr in learningRate:
   parameters,costs = computeNN(X2, Y2, numHidden = 4, learningRate=lr, numIterations = 10000)
   print(costs)
   df1=pd.DataFrame(costs)
   df=pd.concat([df,df1],axis=1)
#Set the iterations
iterations=[0,1000,2000,3000,4000,5000,6000,7000,8000,9000]   
#Create data frame
#Set index
df1=df.set_index([iterations])
df1.columns=[0.5,1.2,3.0]
fig=df1.plot()
fig=plt.title("Cost vs No of Iterations for different learning rates")
plt.savefig('fig4.png', bbox_inches='tight')

8b. Performance  for different hidden units (Python)

import numpy as np
import matplotlib
import matplotlib.pyplot as plt
import sklearn.linear_model
import pandas as pd

from sklearn.datasets import make_classification, make_blobs
execfile("./DLfunctions.py") # Since import does not work in Rmd!!!
#Create data set
X1, Y1 = make_blobs(n_samples = 400, n_features = 2, centers = 9,
                       cluster_std = 1.3, random_state = 4)
#Create 2 classes
Y1=Y1.reshape(400,1)
Y1 = Y1 % 2
X2=X1.T
Y2=Y1.T
# Make a list of hidden unis
numHidden=[3,5,7]
df=pd.DataFrame()
#Compute costs for different hidden units
for numHid in numHidden:
   parameters,costs = computeNN(X2, Y2, numHidden = numHid, learningRate=1.2, numIterations = 10000)
   print(costs)
   df1=pd.DataFrame(costs)
   df=pd.concat([df,df1],axis=1)
#Set the iterations
iterations=[0,1000,2000,3000,4000,5000,6000,7000,8000,9000]   
#Set index
df1=df.set_index([iterations])
df1.columns=[3,5,7]
#Plot
fig=df1.plot()
fig=plt.title("Cost vs No of Iterations for different no of hidden units")
plt.savefig('fig5.png', bbox_inches='tight')

9a. Performance  for different learning rates (R)

source("DLfunctions2_1.R")
# Read data
z <- as.matrix(read.csv("data.csv",header=FALSE)) # 
x <- z[,1:2]
y <- z[,3]
x1 <- t(x)
y1 <- t(y)
#Loop through learning rates and compute costs
learningRate <-c(0.1,1.2,3.0)
df <- NULL
for(i in seq_along(learningRate)){
   nn <-  computeNN(x1, y1, 6, learningRate=learningRate[i],numIterations=10000) 
   cost <- nn$costs
   df <- cbind(df,cost)
  
}      

#Create dataframe
df <- data.frame(df) 
iterations=seq(0,10000,by=1000)
df <- cbind(iterations,df)
names(df) <- c("iterations","0.5","1.2","3.0")
library(reshape2)
df1 <- melt(df,id="iterations")  # Melt the data
#Plot  
ggplot(df1) + geom_line(aes(x=iterations,y=value,colour=variable),size=1)  + 
    xlab("Iterations") +
    ylab('Cost') + ggtitle("Cost vs No iterations for  different learning rates")

9b. Performance  for different hidden units (R)

source("DLfunctions2_1.R")
# Loop through Num hidden units
numHidden <-c(4,6,9)
df <- NULL
for(i in seq_along(numHidden)){
    nn <-  computeNN(x1, y1, numHidden[i], learningRate=0.1,numIterations=10000) 
    cost <- nn$costs
    df <- cbind(df,cost)
    
}      
df <- data.frame(df) 
iterations=seq(0,10000,by=1000)
df <- cbind(iterations,df)
names(df) <- c("iterations","4","6","9")
library(reshape2)
# Melt
df1 <- melt(df,id="iterations") 
# Plot   
ggplot(df1) + geom_line(aes(x=iterations,y=value,colour=variable),size=1)  + 
    xlab("Iterations") +
    ylab('Cost') + ggtitle("Cost vs No iterations for  different number of hidden units")

10a. Performance of the Neural Network for different learning rates (Octave)

source("DL-function2.m")
plotLRCostVsIterations()
print -djph figa.jpg

10b. Performance of the Neural Network for different number of hidden units (Octave)

source("DL-function2.m")
plotHiddenCostVsIterations()
print -djph figa.jpg

11. Turning the heat on the Neural Network

In this 2nd part I create a a central region of positives and and the outside region as negatives. The points are generated using the equation of a circle (x – a)^{2} + (y -b) ^{2} = R^{2} . How does the 3 layer Neural Network perform on this?  Here’s a look! Note: The same dataset is also used for R and Octave Neural Network constructions

12. Manually creating a circular central region

import numpy as np
import matplotlib.pyplot as plt
import matplotlib.colors
import sklearn.linear_model

from sklearn.model_selection import train_test_split
from sklearn.datasets import make_classification, make_blobs
from matplotlib.colors import ListedColormap
import sklearn
import sklearn.datasets

colors=['black','gold']
cmap = matplotlib.colors.ListedColormap(colors)
x1=np.random.uniform(0,10,800).reshape(800,1)
x2=np.random.uniform(0,10,800).reshape(800,1)
X=np.append(x1,x2,axis=1)
X.shape
# Create (x-a)^2 + (y-b)^2 = R^2
# Create a subset of values where squared is <0,4. Perform ravel() to flatten this vector
a=(np.power(X[:,0]-5,2) + np.power(X[:,1]-5,2) <= 6).ravel()
Y=a.reshape(800,1)

cmap = matplotlib.colors.ListedColormap(colors)

plt.figure()
plt.title('Non-linearly separable classes')
plt.scatter(X[:,0], X[:,1], c=Y,
           marker= 'o', s=15,cmap=cmap)
plt.savefig('fig6.png', bbox_inches='tight')

13a. Decision boundary with hidden units=4 and learning rate = 2.2 (Python)

With the above hyper parameters the decision boundary is triangular

import numpy as np
import matplotlib.pyplot as plt
import matplotlib.colors
import sklearn.linear_model
execfile("./DLfunctions.py")
x1=np.random.uniform(0,10,800).reshape(800,1)
x2=np.random.uniform(0,10,800).reshape(800,1)
X=np.append(x1,x2,axis=1)
X.shape

# Create a subset of values where squared is <0,4. Perform ravel() to flatten this vector
a=(np.power(X[:,0]-5,2) + np.power(X[:,1]-5,2) <= 6).ravel()
Y=a.reshape(800,1)

X2=X.T
Y2=Y.T

parameters,costs = computeNN(X2, Y2, numHidden = 4, learningRate=2.2, numIterations = 10000)
plot_decision_boundary(lambda x: predict(parameters, x.T), X2, Y2,str(4),str(2.2),"fig7.png")
## Cost after iteration 0: 0.692836
## Cost after iteration 1000: 0.331052
## Cost after iteration 2000: 0.326428
## Cost after iteration 3000: 0.474887
## Cost after iteration 4000: 0.247989
## Cost after iteration 5000: 0.218009
## Cost after iteration 6000: 0.201034
## Cost after iteration 7000: 0.197030
## Cost after iteration 8000: 0.193507
## Cost after iteration 9000: 0.191949

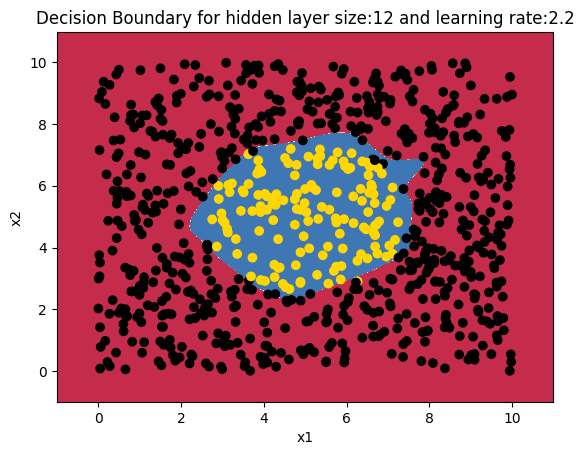
13b. Decision boundary with hidden units=12 and learning rate = 2.2 (Python)

With the above hyper parameters the decision boundary is triangular

import numpy as np
import matplotlib.pyplot as plt
import matplotlib.colors
import sklearn.linear_model
execfile("./DLfunctions.py")
x1=np.random.uniform(0,10,800).reshape(800,1)
x2=np.random.uniform(0,10,800).reshape(800,1)
X=np.append(x1,x2,axis=1)
X.shape

# Create a subset of values where squared is <0,4. Perform ravel() to flatten this vector
a=(np.power(X[:,0]-5,2) + np.power(X[:,1]-5,2) <= 6).ravel()
Y=a.reshape(800,1)

X2=X.T
Y2=Y.T

parameters,costs = computeNN(X2, Y2, numHidden = 12, learningRate=2.2, numIterations = 10000)
plot_decision_boundary(lambda x: predict(parameters, x.T), X2, Y2,str(12),str(2.2),"fig8.png")
## Cost after iteration 0: 0.693291
## Cost after iteration 1000: 0.383318
## Cost after iteration 2000: 0.298807
## Cost after iteration 3000: 0.251735
## Cost after iteration 4000: 0.177843
## Cost after iteration 5000: 0.130414
## Cost after iteration 6000: 0.152400
## Cost after iteration 7000: 0.065359
## Cost after iteration 8000: 0.050921
## Cost after iteration 9000: 0.039719
14a. Decision boundary with hidden units=9 and learning rate = 0.5 (R)

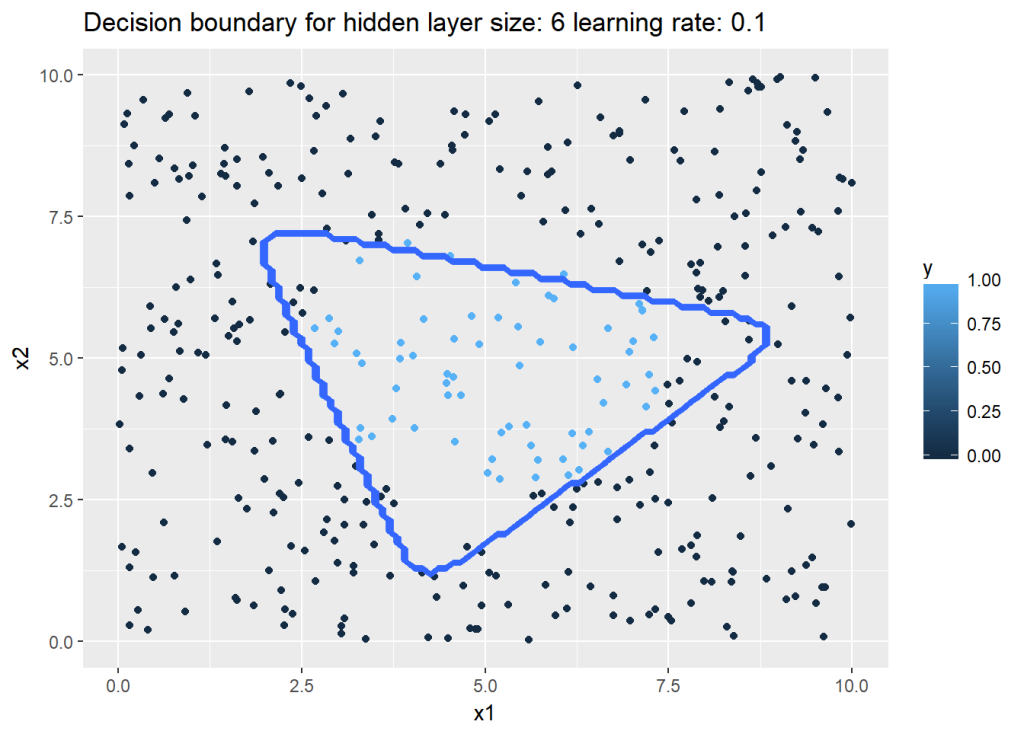
When the number of hidden units is 6 and the learning rate is 0,1, is also a triangular shape in R

source("DLfunctions2_1.R")
z <- as.matrix(read.csv("data1.csv",header=FALSE)) # N
x <- z[,1:2]
y <- z[,3]
x1 <- t(x)
y1 <- t(y)
nn <-computeNN(x1, y1, 9, learningRate=0.5,numIterations=10000) # Triangular
## [1] 0.8398838
## [1] 0.3303621
## [1] 0.3127731
## [1] 0.3012791
## [1] 0.3305543
## [1] 0.3303964
## [1] 0.2334615
## [1] 0.1920771
## [1] 0.2341225
## [1] 0.2188118
## [1] 0.2082687
plotDecisionBoundary(z,nn,6,0.1)

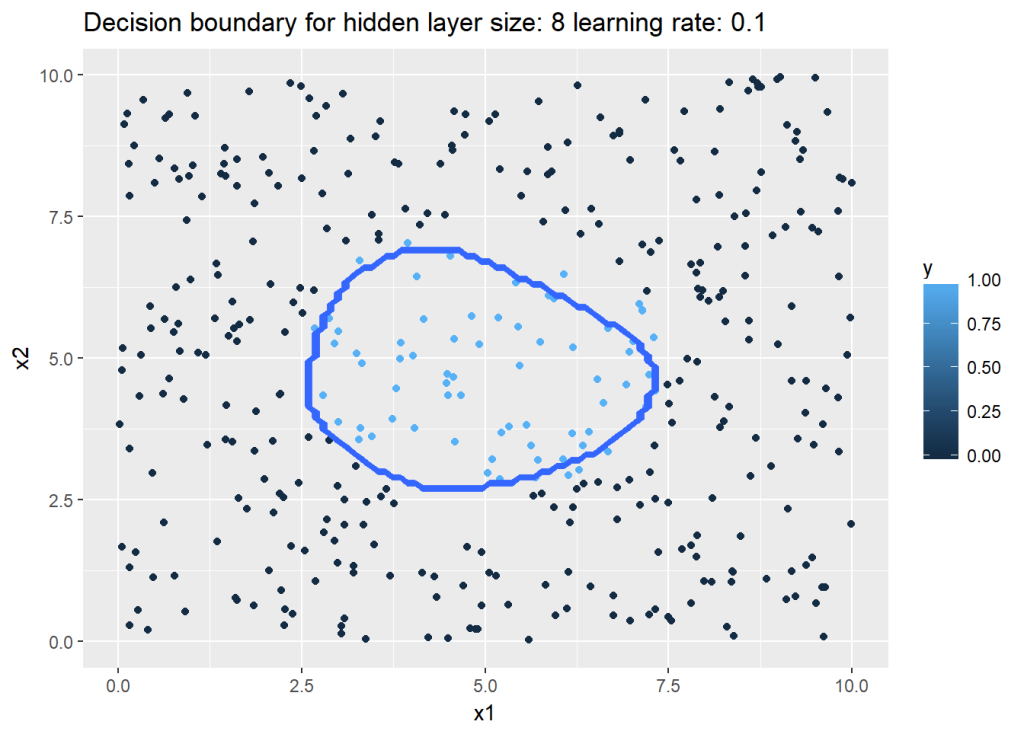
14b. Decision boundary with hidden units=8 and learning rate = 0.1 (R)

source("DLfunctions2_1.R")
z <- as.matrix(read.csv("data1.csv",header=FALSE)) # N
x <- z[,1:2]
y <- z[,3]
x1 <- t(x)
y1 <- t(y)
nn <-computeNN(x1, y1, 8, learningRate=0.1,numIterations=10000) # Hemisphere
## [1] 0.7273279
## [1] 0.3169335
## [1] 0.2378464
## [1] 0.1688635
## [1] 0.1368466
## [1] 0.120664
## [1] 0.111211
## [1] 0.1043362
## [1] 0.09800573
## [1] 0.09126161
## [1] 0.0840379
plotDecisionBoundary(z,nn,8,0.1)
15a. Decision boundary with hidden units=12 and learning rate = 1.5 (Octave)

source("DL-function2.m")
data=csvread("data1.csv");
X=data(:,1:2);
Y=data(:,3);
# Make sure that the model parameters are correct. Take the transpose of X & Y
[W1,b1,W2,b2,costs]= computeNN(X', Y',12, learningRate=1.5, numIterations = 10000);
plotDecisionBoundary(data, W1,b1,W2,b2)
print -djpg fige.jpg
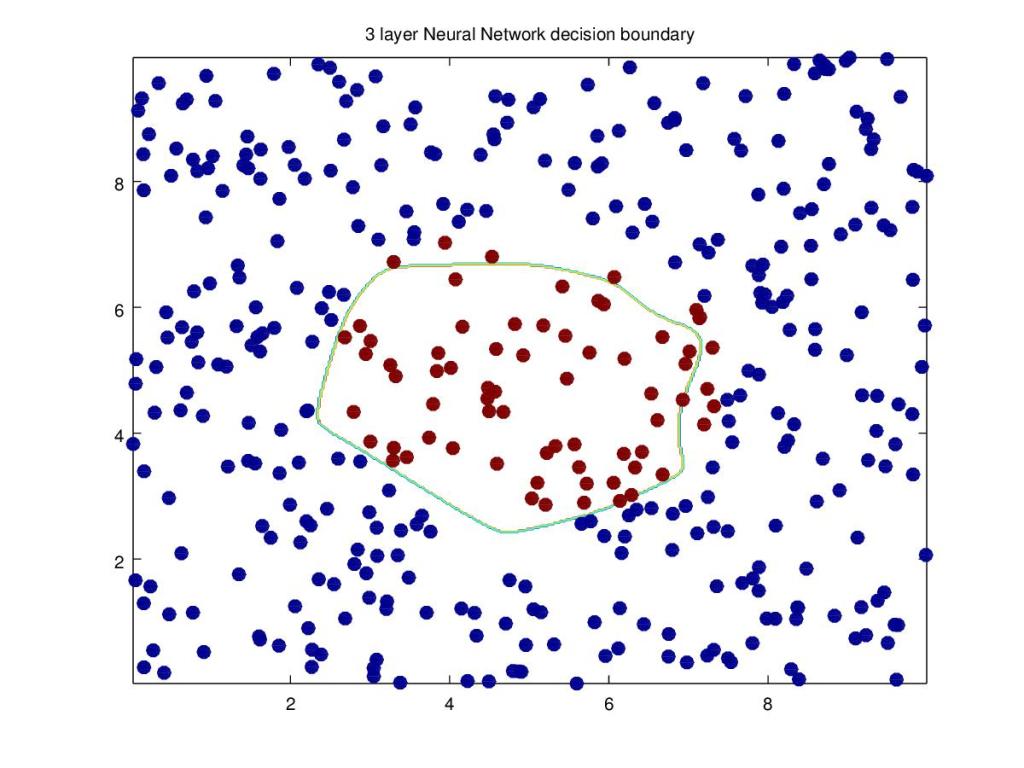
Conclusion: This post implemented a 3 layer Neural Network to create non-linear boundaries while performing classification. Clearly the Neural Network performs very well when the number of hidden units and learning rate are varied.

To be continued…
Watch this space!!

References
1. Deep Learning Specialization
2. Neural Networks for Machine Learning
3. Deep Learning, Ian Goodfellow, Yoshua Bengio and Aaron Courville
4. Neural Networks: The mechanics of backpropagation
5. Machine Learning

Also see
1. My book ‘Practical Machine Learning with R and Python’ on Amazon
2. GooglyPlus: yorkr analyzes IPL players, teams, matches with plots and tables
3. The 3rd paperback & kindle editions of my books on Cricket, now on Amazon
4. Exploring Quantum Gate operations with QCSimulator
5. Simulating a Web Joint in Android
6. My travels through the realms of Data Science, Machine Learning, Deep Learning and (AI)
7. Presentation on Wireless Technologies – Part 1

To see all posts check Index of posts

Neural Networks: The mechanics of backpropagation

The initial work in the  ‘Backpropagation Algorithm’  started in the 1980’s and led to an explosion of interest in Neural Networks and  the application of backpropagation

The ‘Backpropagation’ algorithm computes the minimum of an error function with respect to the weights in the Neural Network. It uses the method of gradient descent. The combination of weights in a multi-layered neural network, which minimizes the error/cost function is considered to be a solution of the learning problem.

neuron-1

In the Neural Network above
out_{o1} =\sum_{i} w_{i}*x_{i}
E = 1/2(target - out)^{2}
\partial E/\partial out= 1/2*2*(target - out) *-1 = -(target - out)
\partial E/\partial w_{i} =\partial E/\partial y* \partial y/\partial w_{i}
\partial E/\partial w_{i} = -(target - out) * x_{i}

Checkout my book ‘Deep Learning from first principles: Second Edition – In vectorized Python, R and Octave’. My book starts with the implementation of a simple 2-layer Neural Network and works its way to a generic L-Layer Deep Learning Network, with all the bells and whistles. The derivations have been discussed in detail. The code has been extensively commented and included in its entirety in the Appendix sections. My book is available on Amazon as paperback ($18.99) and in kindle version($9.99/Rs449).

Perceptrons and single layered neural networks can only classify, if the sample space is linearly separable. For non-linear decision boundaries, a multi layered neural network with  backpropagation is required to generate more complex boundaries.The backpropagation algorithm, computes the minimum of the error function in weight space using the method of gradient descent. This computation of the gradient, requires the activation function to be both differentiable and continuous. Hence the sigmoid or logistic function is typically chosen as the activation function at every layer.

This post looks at a 3 layer neural network with 1 input, 1 hidden and 1 output. To a large extent this post is based on Matt Mazur’s detailed “A step by step backpropagation example“, and Prof Hinton’s “Neural Networks for Machine Learning” at Coursera and a few other sources.

While Matt Mazur’s post uses example values, I generate the formulas for the gradient derivatives for each weight in the hidden and input layers. I intend to implement a vector version of backpropagation in Octave, R and Python. So this post is a prequel to that.

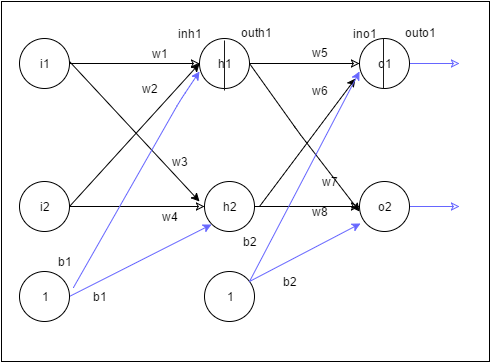
The 3 layer neural network is as below

nn

Some basic derivations which are used in backpropagation

Chain rule of differentiation
Let y=f(u)
and u=g(x) then
\partial y/\partial x = \partial y/\partial u * \partial u/\partial x

An important result
y=1/(1+e^{-z})
Let x= 1 + e^{-z}  then
y = 1/x
\partial y/\partial x = -1/x^{2}
\partial x/\partial z = -e^{-z}

Using the chain rule of differentiation we get
\partial y/\partial z = \partial y/\partial x * \partial x/\partial z
=-1/(1+e^{-z})^{2}* -e^{-z} = e^{-z}/(1+e^{-z})^{2}
Therefore \partial y/\partial z = y(1-y)                                   -(A)

1) Feed forward network
The net output at the 1st hidden layer
in_{h1} = w_{1}i_{1} + w_{2}i_{2} + b_{1}
in_{h2} = w_{3}i_{1} + w_{4}i_{2} + b_{1}

The sigmoid/logistic function function is used to generate the activation outputs for each hidden layer. The sigmoid is chosen because it is continuous and also has a continuous derivative

out_{h1} = 1/1+e^{-in_{h1}}
out_{h2} = 1/1+e^{-in_{h2}}

The net output at the output layer
in_{o1} = w_{5}out_{h_{1}} +  w_{6}out_{h_{2}} + b_{2}
in_{o2} = w_{7}out_{h_{1}} +  w_{8}out_{h_{2}} + b_{2}

Total error
E_{total} = 1/2\sum (target - output)^{2}
E_{total} = E_{o1} + E_{o2}
E_{total} = 1/2(target_{o_{1}} - out_{o_{1}})^{2} + 1/2(target_{o_{2}} - out_{o_{2}})^{2}

2)The backwards pass
In the backward pass we need to compute how the squared error changes with changing weight. i.e we compute \partial E_{total}/\partial w_{i} for each weight w_{i}. This is shown below

A squared error is assumed

Error gradient  with w_{5}

output
 \partial E_{total}/\partial w_{5} = \partial E_{total}/\partial out_{o_{1}} * \partial out_{o_{1}}/\partial in_{o_{1}} * \partial in_{o_{1}}/ \partial w_{5}                -(B)

Since
E_{total} = 1/2\sum (target - output)^{2}
E_{total} = 1/2(target_{o_{1}} - out_{o_{1}})^{2} + 1/2(target_{o_{2}} - out_{o_{2}})^{2}
 \partial E _{total}/\partial out_{o1} = \partial E_{o1}/\partial out_{o1} + \partial E_{o2}/\partial out_{o1}
 \partial E _{total}/\partial out_{o1} = \partial /\partial _{out_{o1}}[1/2(target_{01}-out_{01})^{2}- 1/2(target_{02}-out_{02})^{2}]
 \partial E _{total}/\partial out_{o1} = 2 * 1/2*(target_{01} - out_{01}) *-1 + 0

Now considering the 2nd term in (B)
\partial out_{o1}/\partial in_{o1} = \partial/\partial in_{o1} [1/(1+e^{-in_{o1}})]

Using result (A)
 \partial out_{o1}/\partial in_{o1} = \partial/\partial in_{o1} [1/(1+e^{-in_{o1}})] = out_{o1}(1-out_{o1})

The 3rd term in (B)
 \partial in_{o1}/\partial w_{5} = \partial/\partial w_{5} [w_{5}*out_{h1} + w_{6}*out_{h2}] = out_{h1}
 \partial E_{total}/\partial w_{5}=-(target_{o1} - out_{o1}) * out_{o1} *(1-out_{o1}) * out_{h1}

Having computed \partial E_{total}/\partial w_{5}, we now perform gradient descent, by computing a new weight, assuming a learning rate \alpha
 w_{5}^{+} = w_{5} - \alpha * \partial E_{total}/\partial w_{5}

If we do this for  \partial E_{total}/\partial w_{6} we would get
 \partial E_{total}/\partial w_{6}=-(target_{02} - out_{02}) * out_{02} *(1-out_{02}) * out_{h2}

3)Hidden layer

hidden
We now compute how the total error changes for a change in weight w_{1}
 \partial E_{total}/\partial w_{1}= \partial E_{total}/\partial out_{h1}* \partial out_{h1}/\partial in_{h1} * \partial in_{h1}/\partial w_{1} – (C)

Using
E_{total} = E_{o1} + E_{o2} we get
 \partial E_{total}/\partial w_{1}= (\partial E_{o1}/\partial out_{h1}+  \partial E_{o2}/\partial out_{h1}) * \partial out_{h1}/\partial in_{h1} * \partial in_{h1}/\partial w_{1}
\partial E_{total}/\partial w_{1}=(\partial E_{o1}/\partial out_{h1}+  \partial E_{o2}/\partial out_{h1}) * out_{h1}*(1-out_{h1})*i_{1}     -(D)

Considering the 1st term in (C)
 \partial E_{total}/\partial out_{h1}= \partial E_{o1}/\partial out_{h1}+  \partial E_{o2}/\partial out_{h1}

Now
 \partial E_{o1}/\partial out_{h1} = \partial E_{o1}/\partial out_{o1} *\partial out_{o1}/\partial in_{01} * \partial in_{o1}/\partial out_{h1}
 \partial E_{o2}/\partial out_{h1} = \partial E_{o2}/\partial out_{o2} *\partial out_{o2}/\partial in_{02} * \partial in_{o2}/\partial out_{h1}

which gives the following
 \partial E_{o1}/\partial out_{o1} *\partial out_{o1}/\partial in_{o1} * \partial in_{o1}/\partial out_{h1} =-(target_{o1}-out_{o1}) *out_{o1}(1-out_{o1})*w_{5} – (E)
 \partial E_{o2}/\partial out_{o2} *\partial out_{o2}/\partial in_{02} * \partial in_{o2}/\partial out_{h1} =-(target_{o2}-out_{o2}) *out_{o2}(1-out_{o2})*w_{6} – (F)

Combining (D), (E) & (F) we get
\partial E_{total}/\partial w_{1} = -[(target_{o1}-out_{o1}) *out_{o1}(1-out_{o1})*w_{5} + (target_{o2}-out_{o2}) *out_{o2}(1-out_{o2})*w_{6}]*out_{h1}*(1-out_{h1})*i_{1}

This can be represented as
\partial E_{total}/\partial w_{1} = -\sum_{i}[(target_{oi}-out_{oi}) *out_{oi}(1-out_{oi})*w_{j}]*out_{h1}*(1-out_{h1})*i_{1}

With this derivative a new value of w_{1} is computed
 w_{1}^{+} = w_{1} - \alpha * \partial E_{total}/\partial w_{1}

Hence there are 2 important results
At the output layer we have
a)  \partial E_{total}/\partial w_{j}=-(target_{oi} - out_{oi}) * out_{oi} *(1-out_{oi}) * out_{hi}
At each hidden layer we compute
b) \partial E_{total}/\partial w_{k} = -\sum_{i}[(target_{oi}-out_{oi}) *out_{oi}(1-out_{oi})*w_{j}]*out_{hk}*(1-out_{hk})*i_{k}

Backpropagation, was very successful in the early years,  but the algorithm does have its problems for e.g the issue of the ‘vanishing’ and ‘exploding’ gradient. Yet it is a very key development in Neural Networks, and  the issues with the backprop gradients have been addressed through techniques such as the  momentum method and adaptive learning rate etc.

In this post. I derive the weights at the output layer and the hidden layer. As I already mentioned above, I intend to implement a vector version of the backpropagation algorithm in Octave, R and Python in the days to come.

Watch this space! I’ll be back

P.S. If you find any typos/errors, do let me know!

References
1. Neural Networks for Machine Learning by Prof Geoffrey Hinton
2. A Step by Step Backpropagation Example by Matt Mazur
3. The Backpropagation algorithm by R Rojas
4. Backpropagation Learning Artificial Neural Networks David S Touretzky
5. Artificial Intelligence, Prof Sudeshna Sarkar, NPTEL

Also see my other posts
1. Introducing QCSimulator: A 5-qubit quantum computing simulator in R
2. Design Principles of Scalable, Distributed Systems
3. A method for optimal bandwidth usage by auctioning available bandwidth using the OpenFlow protocol
4. De-blurring revisited with Wiener filter using OpenCV
5. GooglyPlus: yorkr analyzes IPL players, teams, matches with plots and tables
6. Re-introducing cricketr! : An R package to analyze performances of cricketers

To see all my posts go to ‘Index of Posts

Informed choices through Machine Learning – Analyzing Kohli, Tendulkar and Dravid

Having just completed the highly stimulating & inspiring Stanford’s Machine Learning course at Coursera, by the incomparable Professor Andrew Ng I wanted to give my newly acquired knowledge a try. As a start, I decided to try my hand at  analyzing one of India’s fastest growing stars, namely Virat Kohli . For the data on Virat Kohli I used the ‘Statistics database’ at ESPN Cricinfo. To make matters more interesting,  I also pulled data on the iconic  Sachin Tendulkar and the Mr. Dependable,  Rahul Dravid.

If you are passionate about cricket, and love analyzing cricket performances, then check out my 2 racy books on cricket! In my books, I perform detailed yet compact analysis of performances of both batsmen, bowlers besides evaluating team & match performances in Tests , ODIs, T20s & IPL. You can buy my books on cricket from Amazon at $12.99 for the paperback and $4.99/$6.99 respectively for the kindle versions. The books can be accessed at Cricket analytics with cricketr  and Beaten by sheer pace-Cricket analytics with yorkr  A must read for any cricket lover! Check it out!!

1

(Also do check out my R package cricketr  Introducing cricketr! : An R package to analyze performances of cricketers and my interactive Shiny app implementation using my R package cricketr  – Sixer – R package cricketr’s new Shiny avatar )

Based on the data of these batsmen I perform some predictions with the help of machine learning algorithms. That I have a proclivity for prediction, is not surprising, considering the fact that my Dad was an astrologer who had reasonable success at this esoteric art. While he would be concerned with planetary positions, about Rahu in the 7th house being in the malefic etc., I on the other hand focus my  predictions on multivariate regression analysis and K-Means. The first part of my post gives the results of my analysis and some predictions for Kohli, Tendulkar and Dravid.

The second part of the post contains a brief outline of the implementation and not the actual details of implementation. This is ensure that I don’t violate Coursera’s Machine Learning’ Honor Code.

This code, data used and the output obtained  can be accessed at GitHub at ml-cricket-analysis

Analysis and prediction of Kohli, Tendulkar and Dravid with Machine Learning As mentioned above, I pulled the data for the 3 cricketers Virat Kohli, Sachin Tendulkar and Rahul Dravid. The data taken from Cricinfo database for the 3 batsman is based on  the following assumptions

  • Only ‘Minutes at Crease’ and ‘Balls Faced’ were taken as features against the output variable ‘Runs scored’
  • Only test matches were taken. This included both test ‘at home’ and ‘away tests’
  • The data was cleaned to remove any DNB (did not bat) values
  • No extra weightage was given to ‘not out’. So if Kohli made ‘28*’ 28 not out, this was taken to be 28 runs

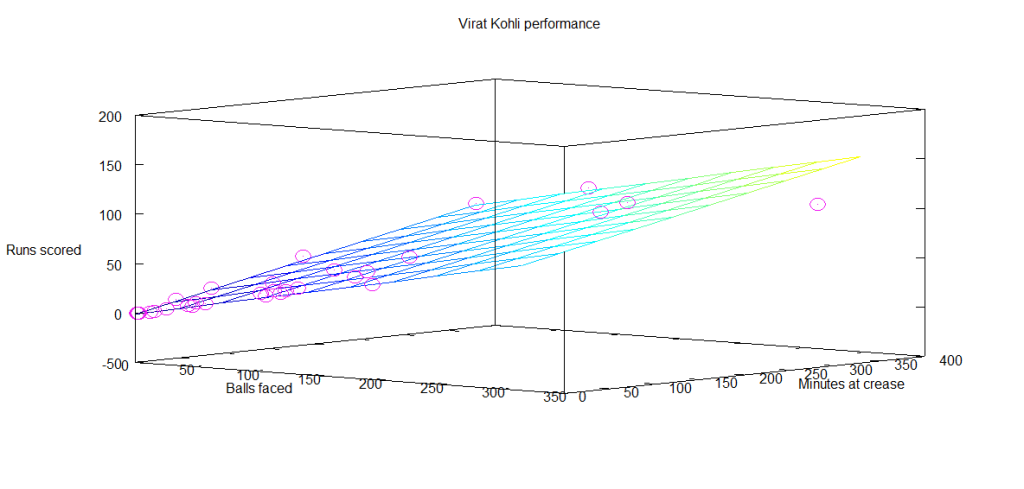
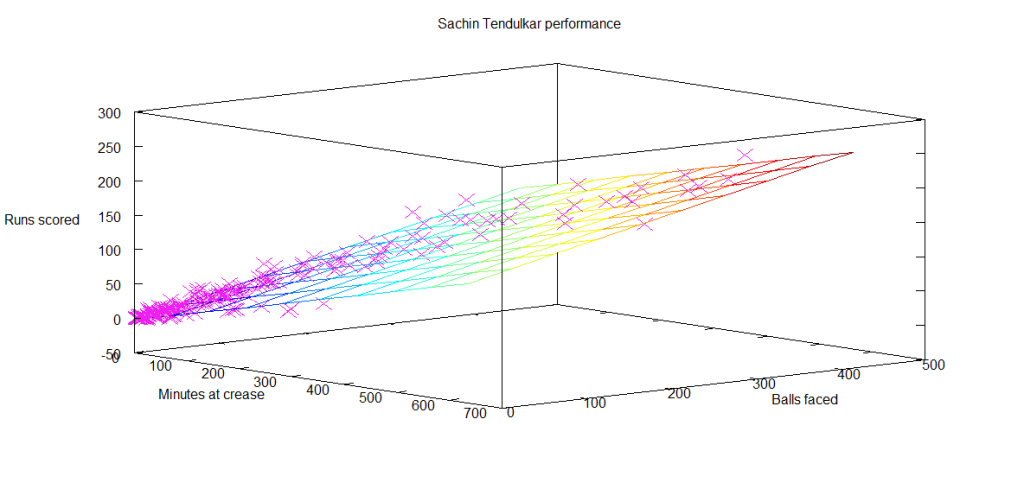
 Regression Analysis for Virat Kohli There are 51 data points for Virat Kohli regarding Tests played. The data for Kohli is displayed as a 3D scatter plot where x-axis is ‘minutes’ and y-axis is ‘balls faced’. The vertical z-axis is the ‘runs scored’. Multivariate regression analysis was performed to find the best fitting plane for the runs scored based on the selected features of ‘minutes’ and ‘balls faced’.

This is based on minimizing the cost function and then performing gradient descent for 400 iterations to check for convergence. This plane is shown as the 3-D plane that provides the best fit for the data points for Kohli. The diagram below shows the prediction plane of  expected runs for a combination of ‘minutes at crease’ and ‘balls faced’. Here are 2 such plots for Virat Kohli. kohliAnother view of the prediction plane kohli-1 Prediction for Kohli I have also computed the predicted runs that will be scored by Kohli for different combinations of ‘minutes at crease’ and ‘balls faced’. As an example, from the table below, we can see that the predicted runs for Kohli   after being in the crease for 110 minutes  and facing 135 balls is 54 runs. kohli-score Regression analysis for Sachin Tendulkar There was a lot more data on Tendulkar and I was able to dump close to 329 data points. As before the ‘minutes at crease’, ‘balls faced’ vs ‘runs scored’ were plotted as a 3D scatter plot. The prediction plane is calculated using gradient descent and is shown as a plane in the diagram below srt Another view of this below srt-1 Predicted runs for Tendulkar The table below gives the predicted runs for Tendulkar for a combination of  time at crease and balls faced.  Hence,  Tendulkar will score 57 runs in 110 minutes after  facing 135 deliveries srt-score Regression Analysis for Rahul Dravid The same was done for ‘the Wall’ Dravid. The prediction plane is below dravid dravid-1 Predicted runs for Dravid The predicted runs for Dravid for combinations of batting time and balls faced is included below.  The predicted runs for Dravid after facing 135 deliveries in 110 minutes is 44. dravid-scoreFurther analysis While the ‘prediction plane’ was useful,  it somehow does not give a clear picture of how effective each batsman is. Clearly the 3D plots show at least 3 clusters for each batsman. For all batsmen, the clustering is densest near the origin, become less dense towards the middle and sparse on the other end. This is an indication during which session during their innings the batsman is most prone to get out. So I decided to perform K-Means clustering on the data for the 3 batsman. This gives the 3 general tendencies  for each batsman. The output is included below

K-Means for Virat The K-Means for Virat Kohli indicate the follow

Centroids found 255.000000 104.478261 19.900000
Centroids found 194.000000 80.000000 15.650000
Centroids found 103.000000 38.739130 7.000000

Analysis of Virat Kohli’s batting tendency
Kohli has a 45.098 percent tendency to bat for 104 minutes,  face 80 balls and score 38 runs
Kohli has a 39.216 percent tendency to bat for 19 minutes, face 15 balls and score 7 runs
Kohli has a 15.686 percent tendency to bat for 255 minutes, face 194 balls and score 103 runs

The computation of this included in the diagram below

kohli-kmeans

K-means for Sachin Tendulkar

The K-Means for Sachin Tendulkar indicate the following

Centroids found 166.132530 353.092593 43.748691
Centroids found 121.421687 250.666667 30.486911
Centroids found 65.180723 138.740741 15.748691

Analysis of Sachin Tendulkar’s performance

Tendulkar has a 58.232 percent tendency to bat for 43 minutes, face 30 balls and score 15 runs
Tendulkar has a 25.305 percent tendency to bat for 166 minutes, face 121 balls and score 65 runs
Tendulkar has a 16.463 percent tendency to bat for 353 minutes, face 250 balls and score 138 runs
srt-kmeans K-Means for Rahul Dravid

Centroids found 191.836364 409.000000 50.506024
Centroids found 137.381818 290.692308 34.493976
Centroids found 56.945455 131.500000 13.445783

Analysis of Rahul Dravid’s performance
Dravid has a 50.610 percent tendency to bat for 50 minutes,  face 34 balls and score 13 runs
Dravid has a 33.537 percent tendency to bat for 191 minutes,  face 137 balls and score 56 runs
Dravid has a 15.854 percent tendency to bat for 409 minutes, face 290 balls and score 131 runs
dravid-kmeans Some implementation details The entire analysis and coding was done with Octave 3.2.4. I have included the outline of the code for performing the multivariate regression. In essence the pseudo code for this

  1. Read the batsman data (Minutes, balls faced versus Runs scored)
  2. Calculate the cost
  3. Perform Gradient descent

The cost was plotted against the number of iterations to ensure convergence while performing gradient descent convergence-kohli Plot the 3-D plane that best fits the data
The outline of this code, data used and the output obtained  can be accessed at GitHub at ml-cricket-analysis

Conclusion: Comparing the results from the K-Means Tendulkar has around 48% to make a score greater than 60
Tendulkar has a 25.305 percent tendency to bat for 166 minutes, face 121 balls and score 65 runs
Tendulkar has a 16.463 percent tendency to bat for 353 minutes, face 250 balls and score 138 runs

And Dravid has a similar 48% tendency to score greater than 56 runs
Dravid has a 33.537 percent tendency to bat for 191 minutes,  face 137 balls and score 56 runs
Dravid has a 15.854 percent tendency to bat for 409 minutes, face 290 balls and score 131 runs

Kohli has around 45% to score greater than 38 runs
Kohli has a 45.098 percent tendency to bat for 104 minutes,  face 80 balls and score 38 runs

Also Kohli has a lesser percentage to score lower runs as against the other two
Kohli has a 39.216 percent tendency to bat for 19 minutes, face 15 balls and score 7 runs

The results must be looked in proper perspective as Kohli is just starting his career while the other 2 are veterans. Kohli has a long way to go and I am certain that he will blaze a trail of glory in the years to come!

Watch this space!

Also see
1. My book ‘Practical Machine Learning with R and Python’ on Amazon
2.Introducing cricketr! : An R package to analyze performances of cricketers
3.Informed choices with Machine Learning 2 – Pitting together Kumble, Kapil and Chandra
4. Analyzing cricket’s batting legends – Through the mirage with R
5. What’s up Watson? Using IBM Watson’s QAAPI with Bluemix, NodeExpress – Part 1
6. Bend it like Bluemix, MongoDB with autoscaling – Part 1