Analytics is by definition, the science (& art) of identifying, discovering and interpreting patterns in data. There are different ways of capturing these patterns through charts (bar, pie, cumulative data, moving average etc.). One such way is the motion or animated chart which captures the changes in data across different time periods. This was made famous by Hans Rosling in his Gapminder charts.
In this post, I use animated charts, based on gganimate(), to display the rise and fall of batsmen and bowlers in IPL and Intl. T20 (men). I only did this for these 2 formats as they have sufficient data over at least 10+ years.
To construct these animated charts, I use a ‘sliding window’ of 3 years, so that we get a clearer view of batsman and bowler consistency. The animated charts show the performance of players for this moving window for e.g. Jan 2008- Dec 2010, Jan 2009-Dec 2011, Jan 2010- Dec 2012 and so on till Jan 2019- Dec 2021. This is done for both batting( total runs) and bowling (total wickets). If you would like to analyse the performance of particular batsmen, bowler during specific periods or for a team vs another team or in the overall T20 format, check out my post GooglyPlusPlus2021: Towards more picturesque analytics!
You clone/fork the code from Github here animation.
Important note: The year which is displayed on the side actually represents the last 3 years, for e.g. 2015 (2013, 2014, 2015) or 2019 (2017, 2018, 2019)
IPL Batting performance
We can see that Kohli stays in the top 3 from 2015-2019
2. IPL Bowling performance
Malinga ruled from 2010- 2015. Bumrah is in top 3 from 2019-2021
3. IPL Batting in Power play
Adam Gilchrist, Tendulkar, Warner, KL Rahul, Shikhar Dhawan have a stay at the top
4. IPL Batting in Middle overs
Rohit Sharma, Kohli, Pant have their stay at the top
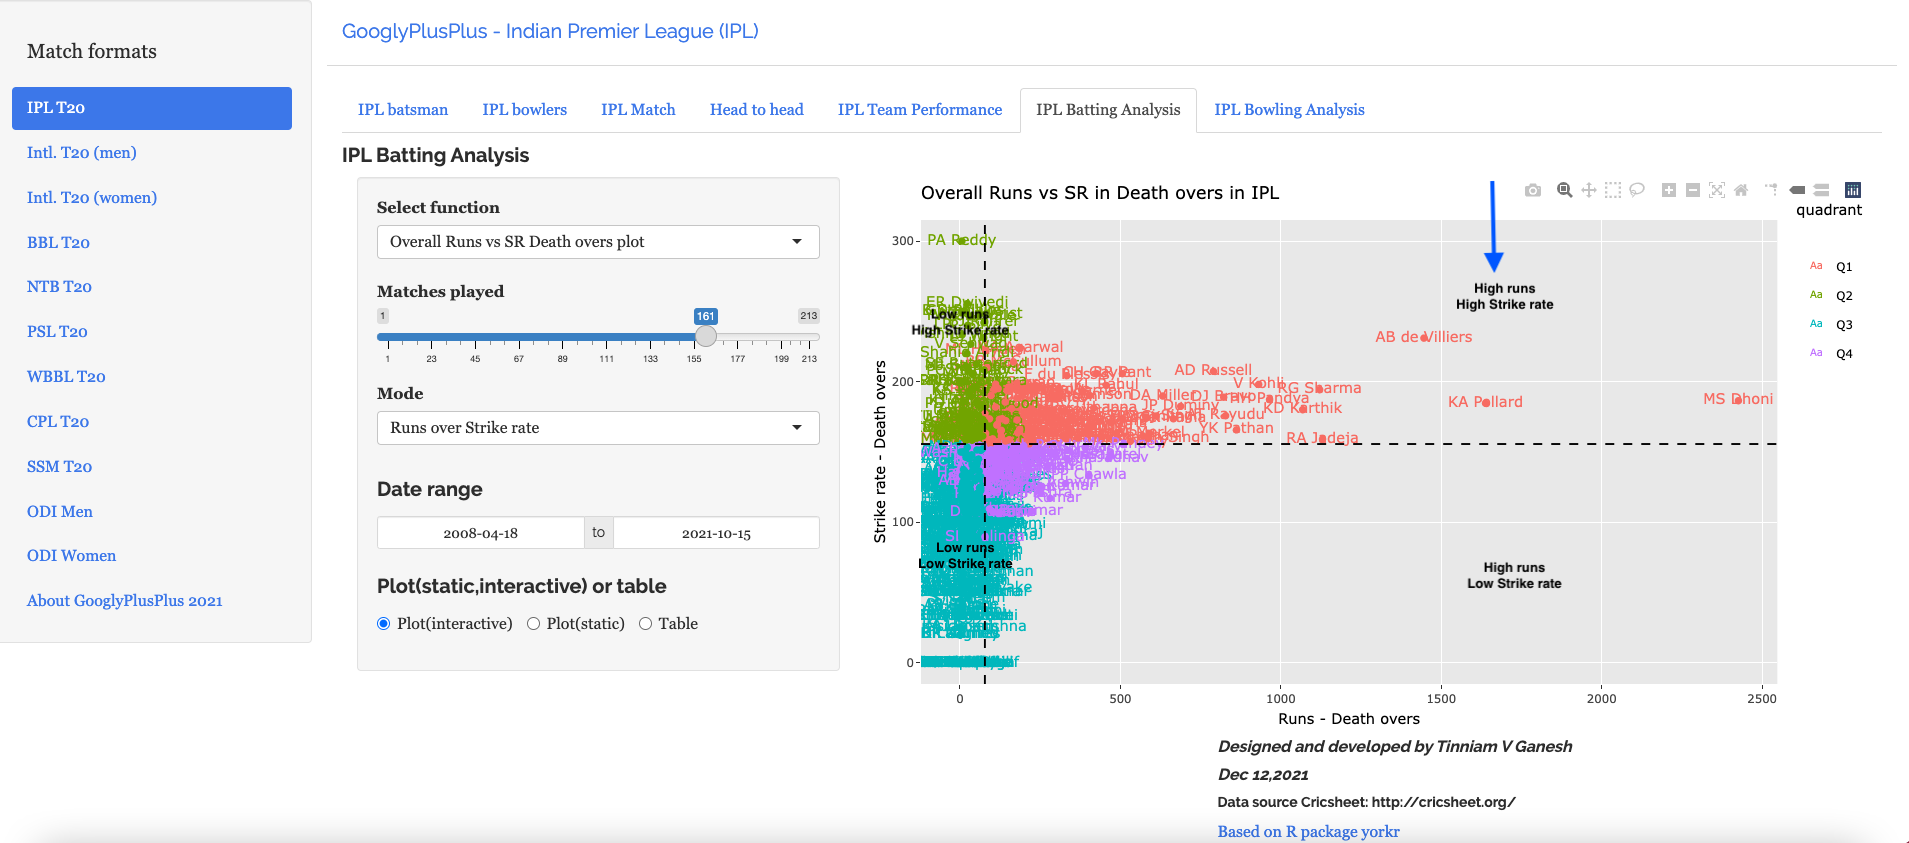
5. IPL Batting Death overs
MS Dhoni is lord and master of the death overs in IPL for a rolling period of 10 years from 2011-2020. No wonder, he is the best finisher of T20 cricket
6. IPL Bowling Power Play
Bhuvanesh Kumar is in top 3 from 2014-2018 and then Deepak Chahar
7. IPL Bowling Middle overs
Toppers Harbhajan Singh, YS Chahal, Rashid Khan
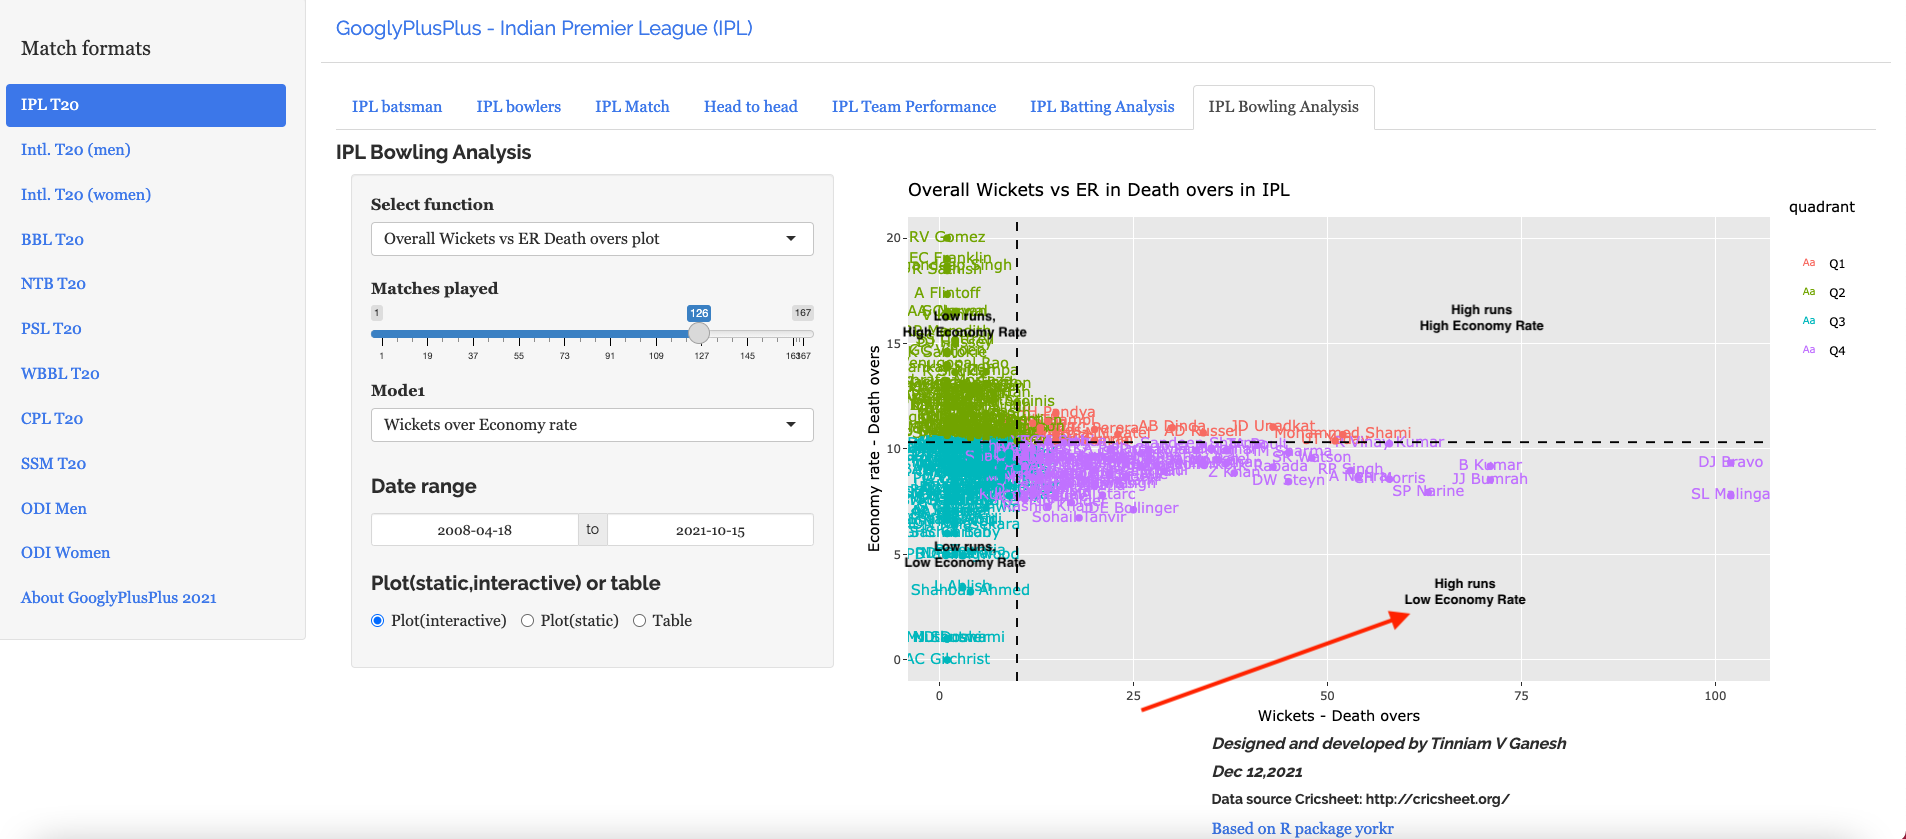
8. IPL Bowling Death overs
SL Malinga, B. Kumar, JJ Bumrah and Rabada top the list across the years
9. T20 (men) Batting performance
Kohli, Babar Azam, P R Stirling are best performers
10. T20 (men) bowling performance
Saaed Ajmal tops from 2010-2014 and Rashid Khan 2018-2020
11. T20 (men) batting Power play
Shahzad, D Warner, Rohit Sharma, PR Stirling best performers
12. T20 (men) batting middle overs
Babar Azam is the best middle overs player from 2018-2021
13. T20(men) batting death overs
MS Dhoni, Shoaib Malik, V Kohli, David Miller are the best death over players
14. T20 (men) bowling Power play
Mohammad Nabi, Mujeeb ur Rahman, TG Southee are the best bowlers in power play
15. T20 (men) bowling middle overs
Imran Tahir from 2015-2017, Shadab Khan from 2018-2020, T Shamsi in 2021 top the tables
16. T20 (men) bowling death overs
Saaed Ajmal, A J Tye, Bumrah, Haris Rauf occupy the top slot in different periods
Analytics for e.g. sports analytics, business analytics or analytics in e-commerce or in other domain has 2 main requirements namely a) What kind of analytics (set of parameters,function) will squeeze out the most intelligence from the data b) How to represent the analytics so that an expert can garner maximum insight?
While it may appear that the former is more important, the latter is also equally, if not, more vital to the problem. Indeed, a picture is worth a thousand words, and often times is more insightful than a large table of numbers. However, in the case of sports analytics, for e.g. in cricket a batting or bowling scorecard captures more information and can never be represented in chart.
So, my Shiny app GooglyPlusPlus includes both charts and tables for different aspects of the analysis. In this post, a newer type of chart, popular among senior management experts, namely the 4 quadrant graph is introduced, which helps in categorising batsmen and bowlers into 4 categories as shown below
a) Batting Performances – Top right quadrant (High runs, High Strike rate)
b) Bowling Performances – Bottom right quadrant( High wickets, Low Economy Rate)
I have added the following 32 functions in this latest version of GooglyPlusPlus
A. Match Tab
All the functions below are at match level
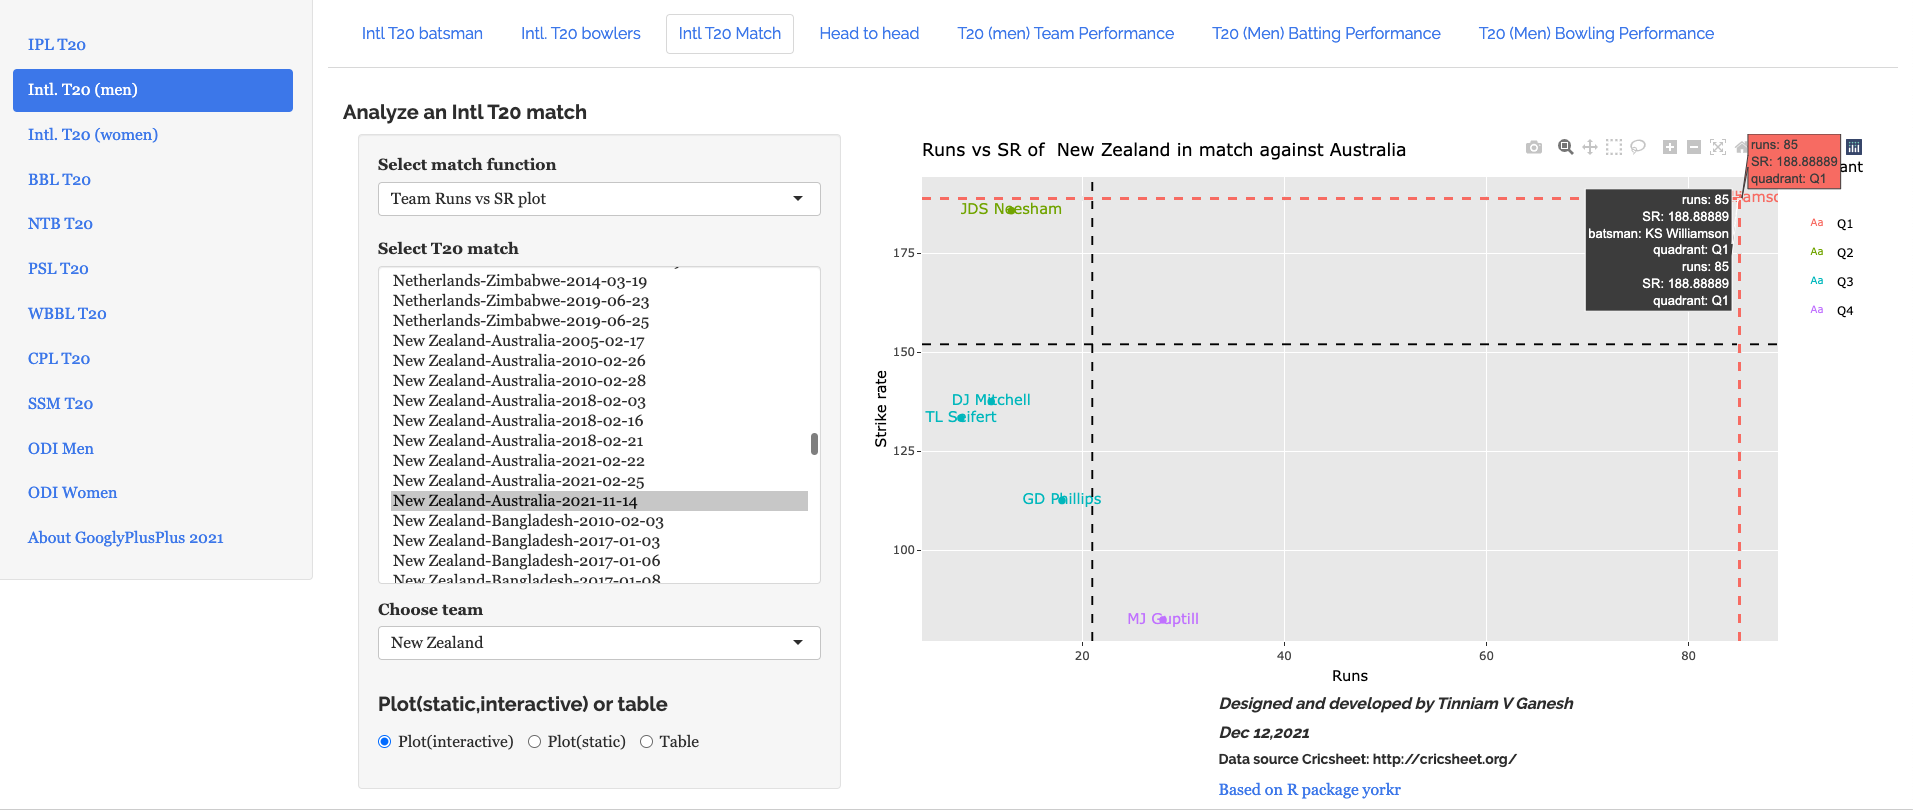
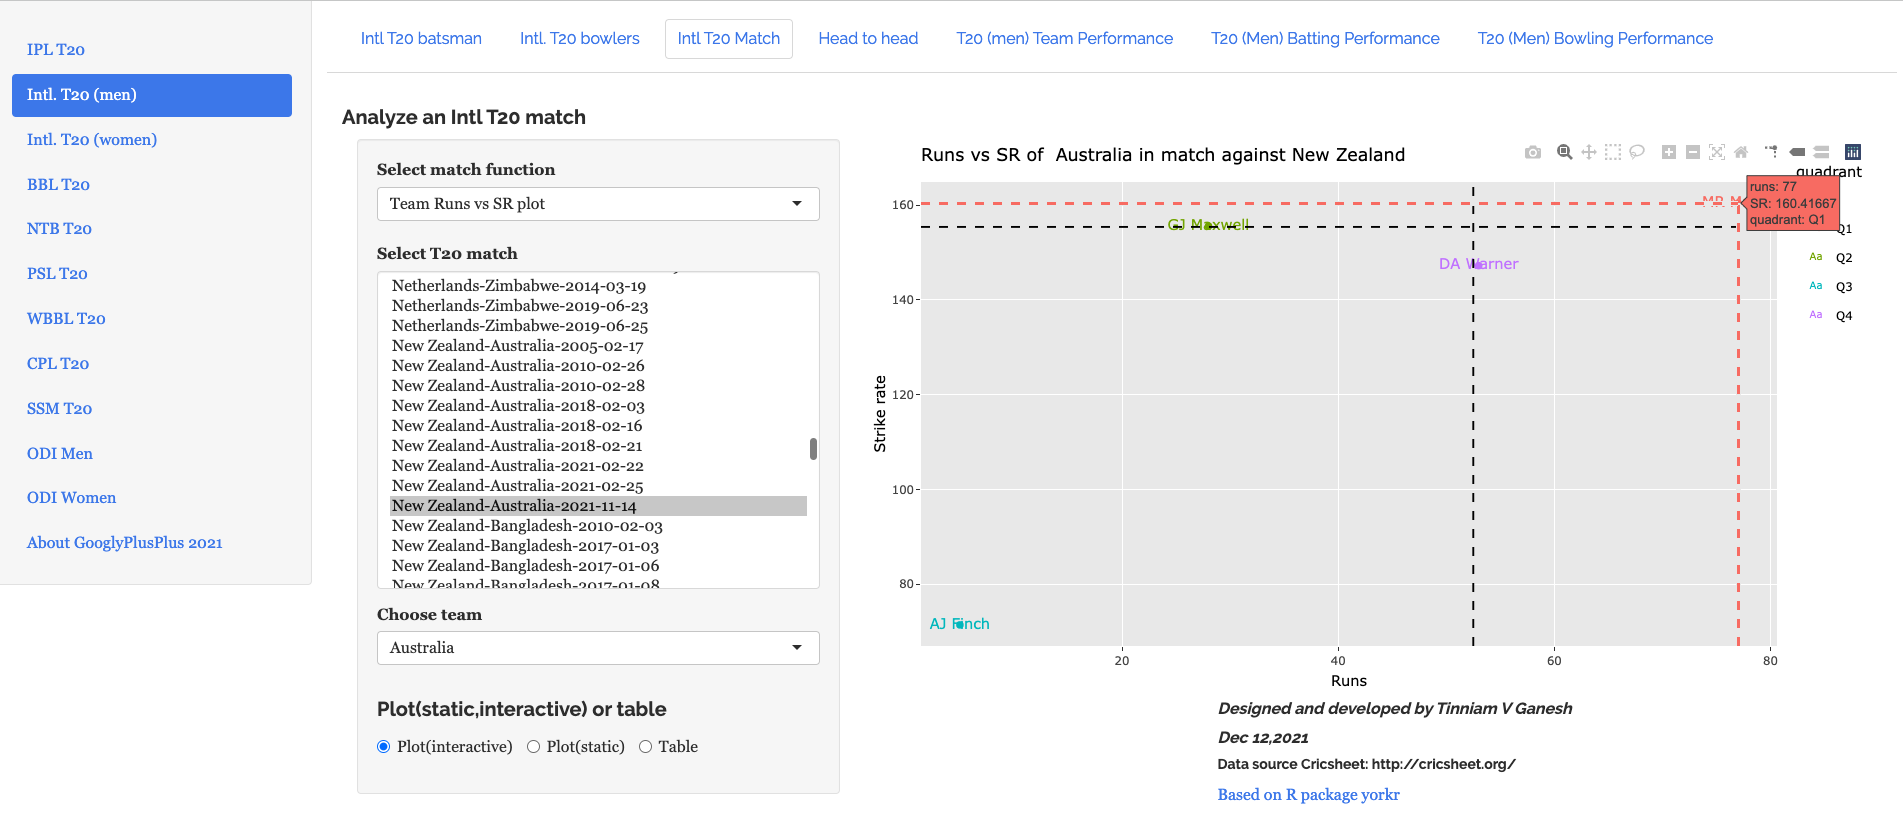
Team Runs vs SR Plot
Team Wickets vs ER Plot
Team Runs vs SR Power play plot
Team Runs vs SR Middle overs plot
Team Runs vs SR Death overs plot
Team Wickets vs ER Power Play
Team Wickets vs ER Middle overs
Team Wickets vs ER Death overs
B. Head-to-head Tab
The below functions are based on all matches between 2 teams’
Team Runs vs SR Plot all Matches
Team Wickets vs ER Plot all Matches
Team Runs vs SR Power play plot all Matches
Team Runs vs SR Middle overs plot all Matches
Team Runs vs SR Death overs plot all Matches
Team Wickets vs ER Power Play plot all Matches
Team Wickets vs ER Middle overs plot all Matches
Team Wickets vs ER Death overs plot all Matches
C. Team Performance tab
The below functions are based on a team’s performance against all other teams
Team Runs vs SR Plot overall
Team Wickets vs ER Plot overall
Team Runs vs SR Power play plot overall
Team Runs vs SR Middle overs plot overall
Team Runs vs SR Death overs plot overall
Team Wickets vs ER Power Play overall
Team Wickets vs ER Middle overs overall
Team Wickets vs ER Death overs overall
D. T20 format Batting Analysis
This analysis is at T20 format level (IPL, Intl. T20(men), Intl. T20 (women), PSL, CPL etc.)
Overall Runs vs SR plot
Overall Runs vs SR Power play plot
Overall Runs vs SR Middle overs plot
Overall Runs vs SR Death overs plot
E. T20 Bowling Analysis
This analysis is at T20 format level (IPL, Intl. T20(men), Intl. T20 (women), PSL, CPL etc.)
Overall Wickets vs ER plot
Team Wickets vs ER Power Play
Team Wickets vs ER Middle overs
Team Wickets vs ER Death overs
These 32 functions have been added to my yorkr package and so all these functions become plug-n-play in my Shiny app GooglyPlusPlus2021 which means that the 32 functions apply across all the nine T20 formats that the app supports i.e. IPL, Intl. T20 (men), Intl. T20 (women), BBL, NTB, PSL, CPL, SSM, WBB.
Hence the multiplicative factor of the new addition is 32 x 9 = 288 additional ways of exploring match, team and player data
You can clone/fork GooglyPlusPlus from Github at gpp2021-10
Check out my app GooglyPlusPlus2021 and analyze batsmen, bowlers, teams, overall performance. The data for all the nine T20 formats have been updated to include the latest data.
Hence, the app is just in time for the IPL mega auction. You should be able to analyse players in IPL, Intl. T20 or in any of the other formats from where they could be drawn and check out their relative standings
I am including some random plots to demonstrate the newly minted functions
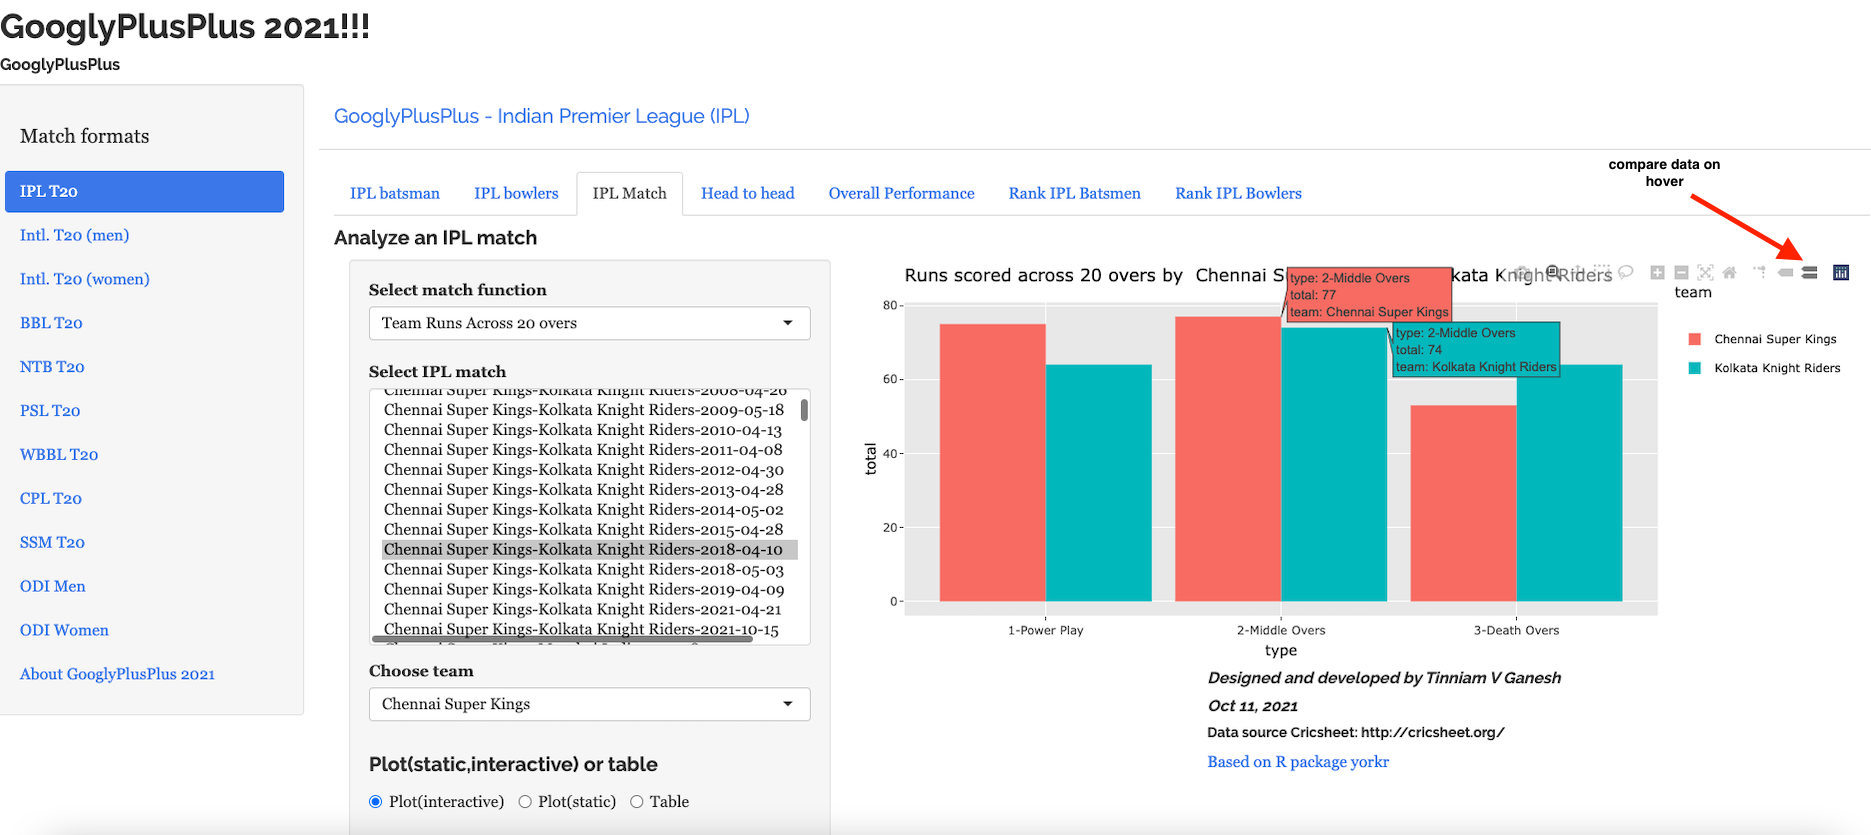
Note 1: All plots are interactive. The controls are on the top right. You can hover over data, zoom-in, zoom-out, compare data etc by choosing the appropriate control. To know more about how to use the interactive charts see GooglyPlusPlus2021 is now fully interactive!!!
New Zealand batting, except K Williamson, the rest did not fire as much
For Australia, Warner, Maxwell and Marsh played good knocks to wrest control
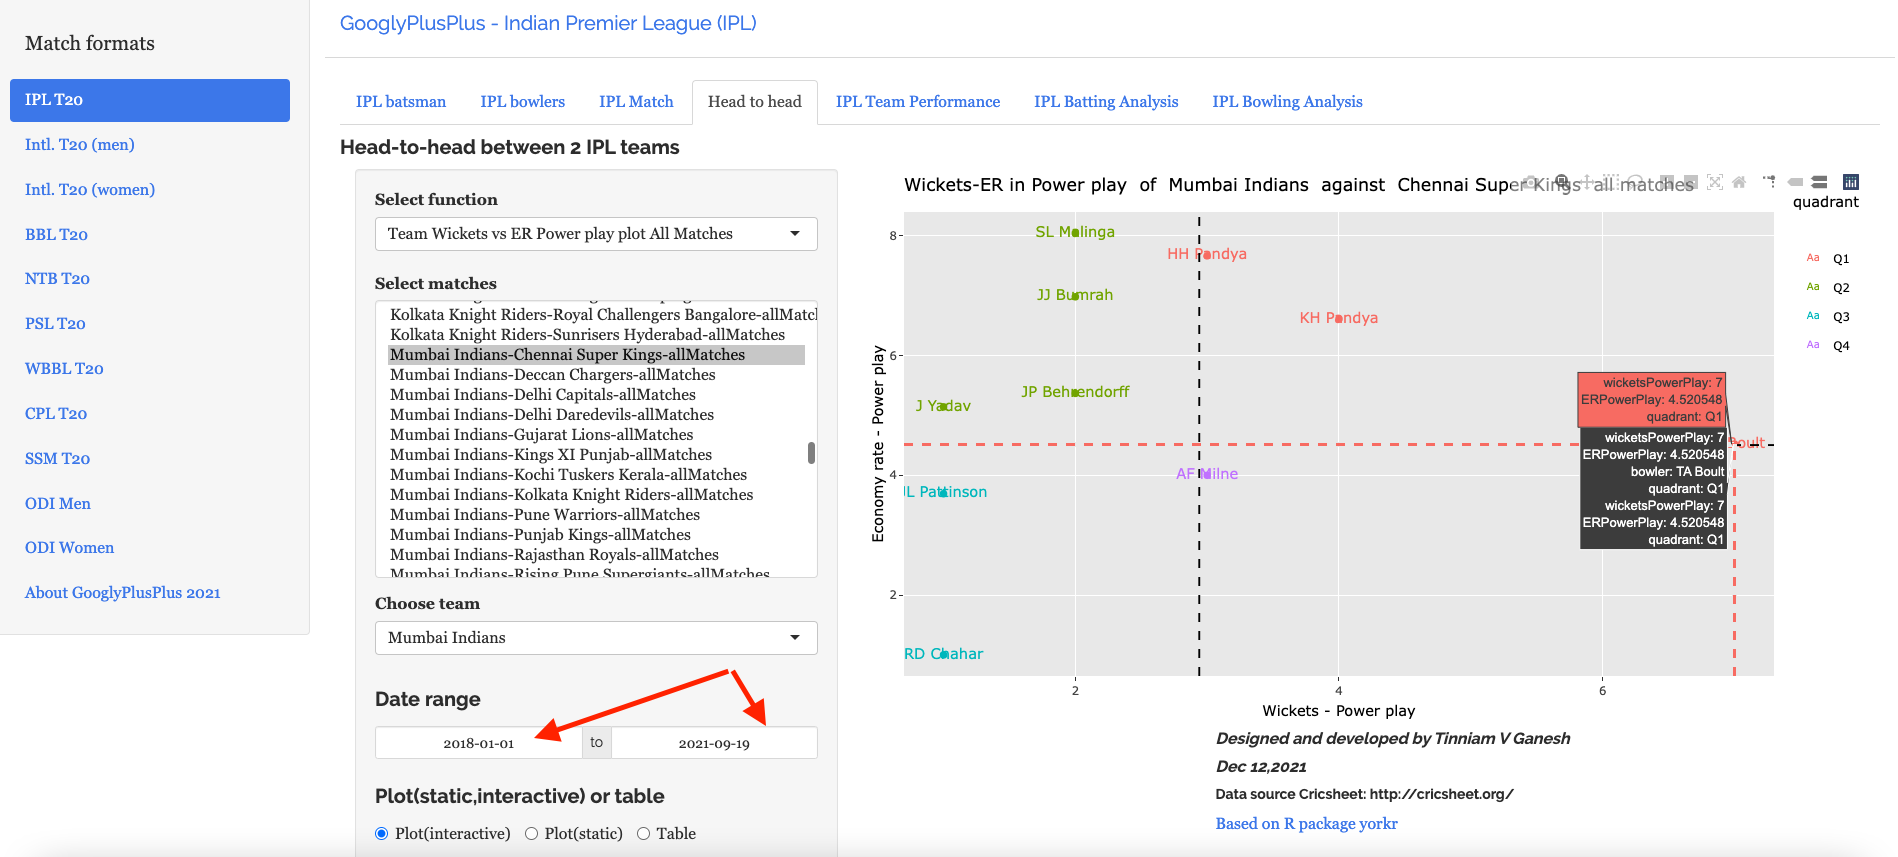
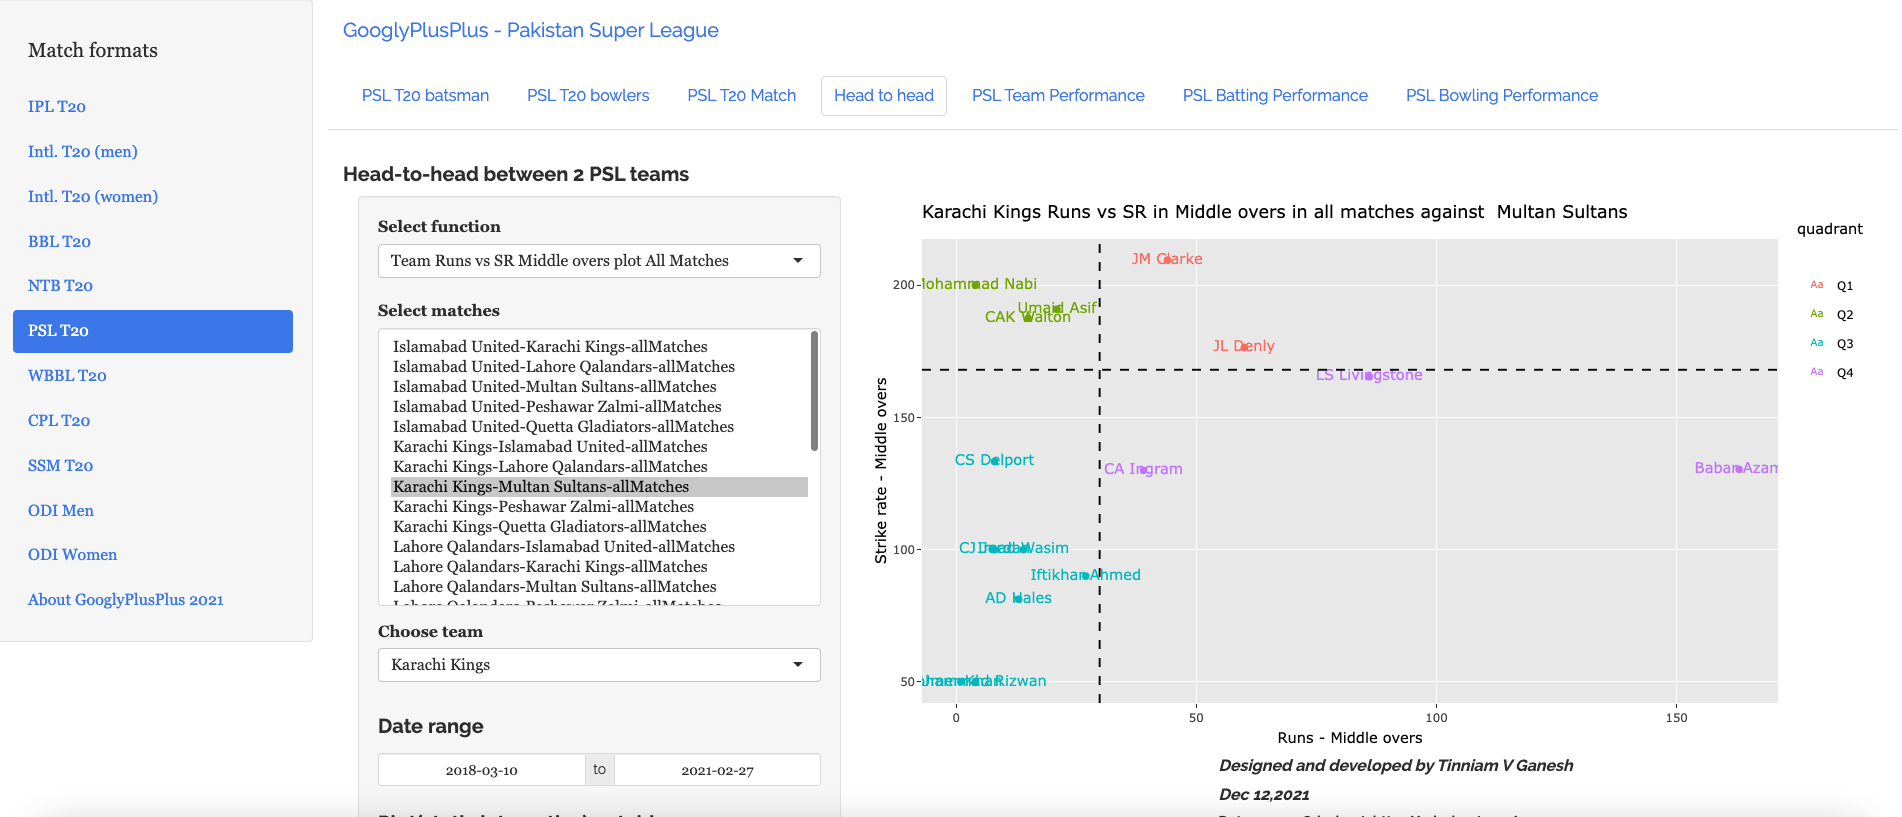
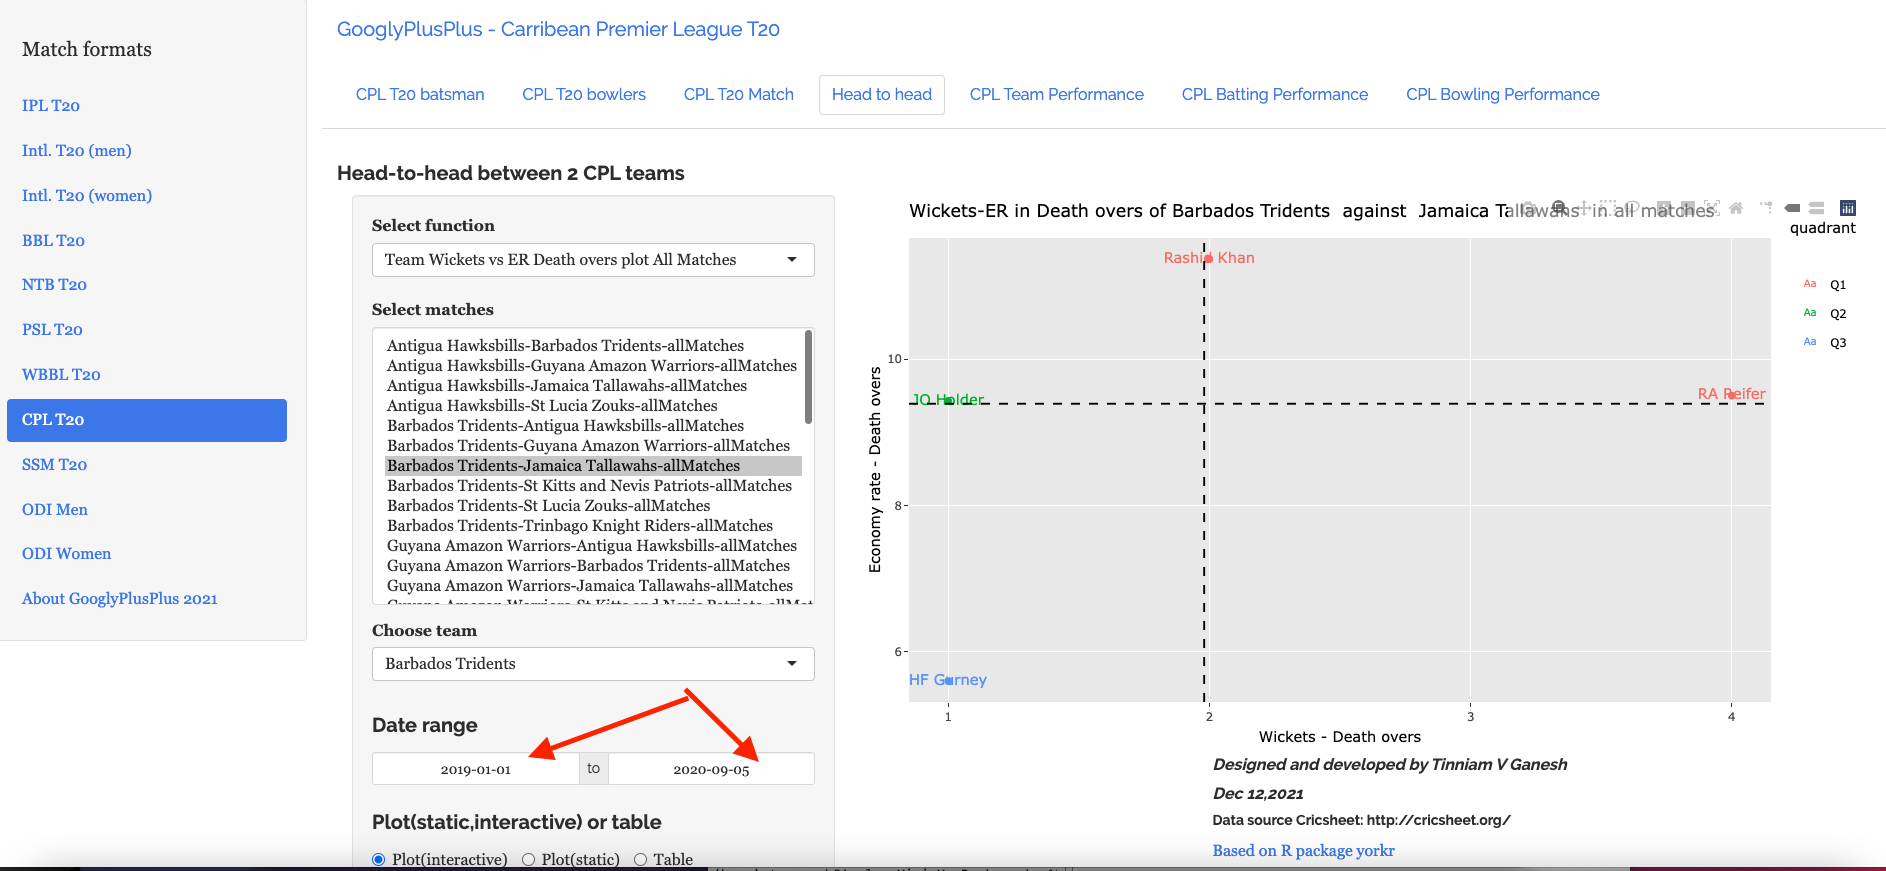
II) Head-to-head
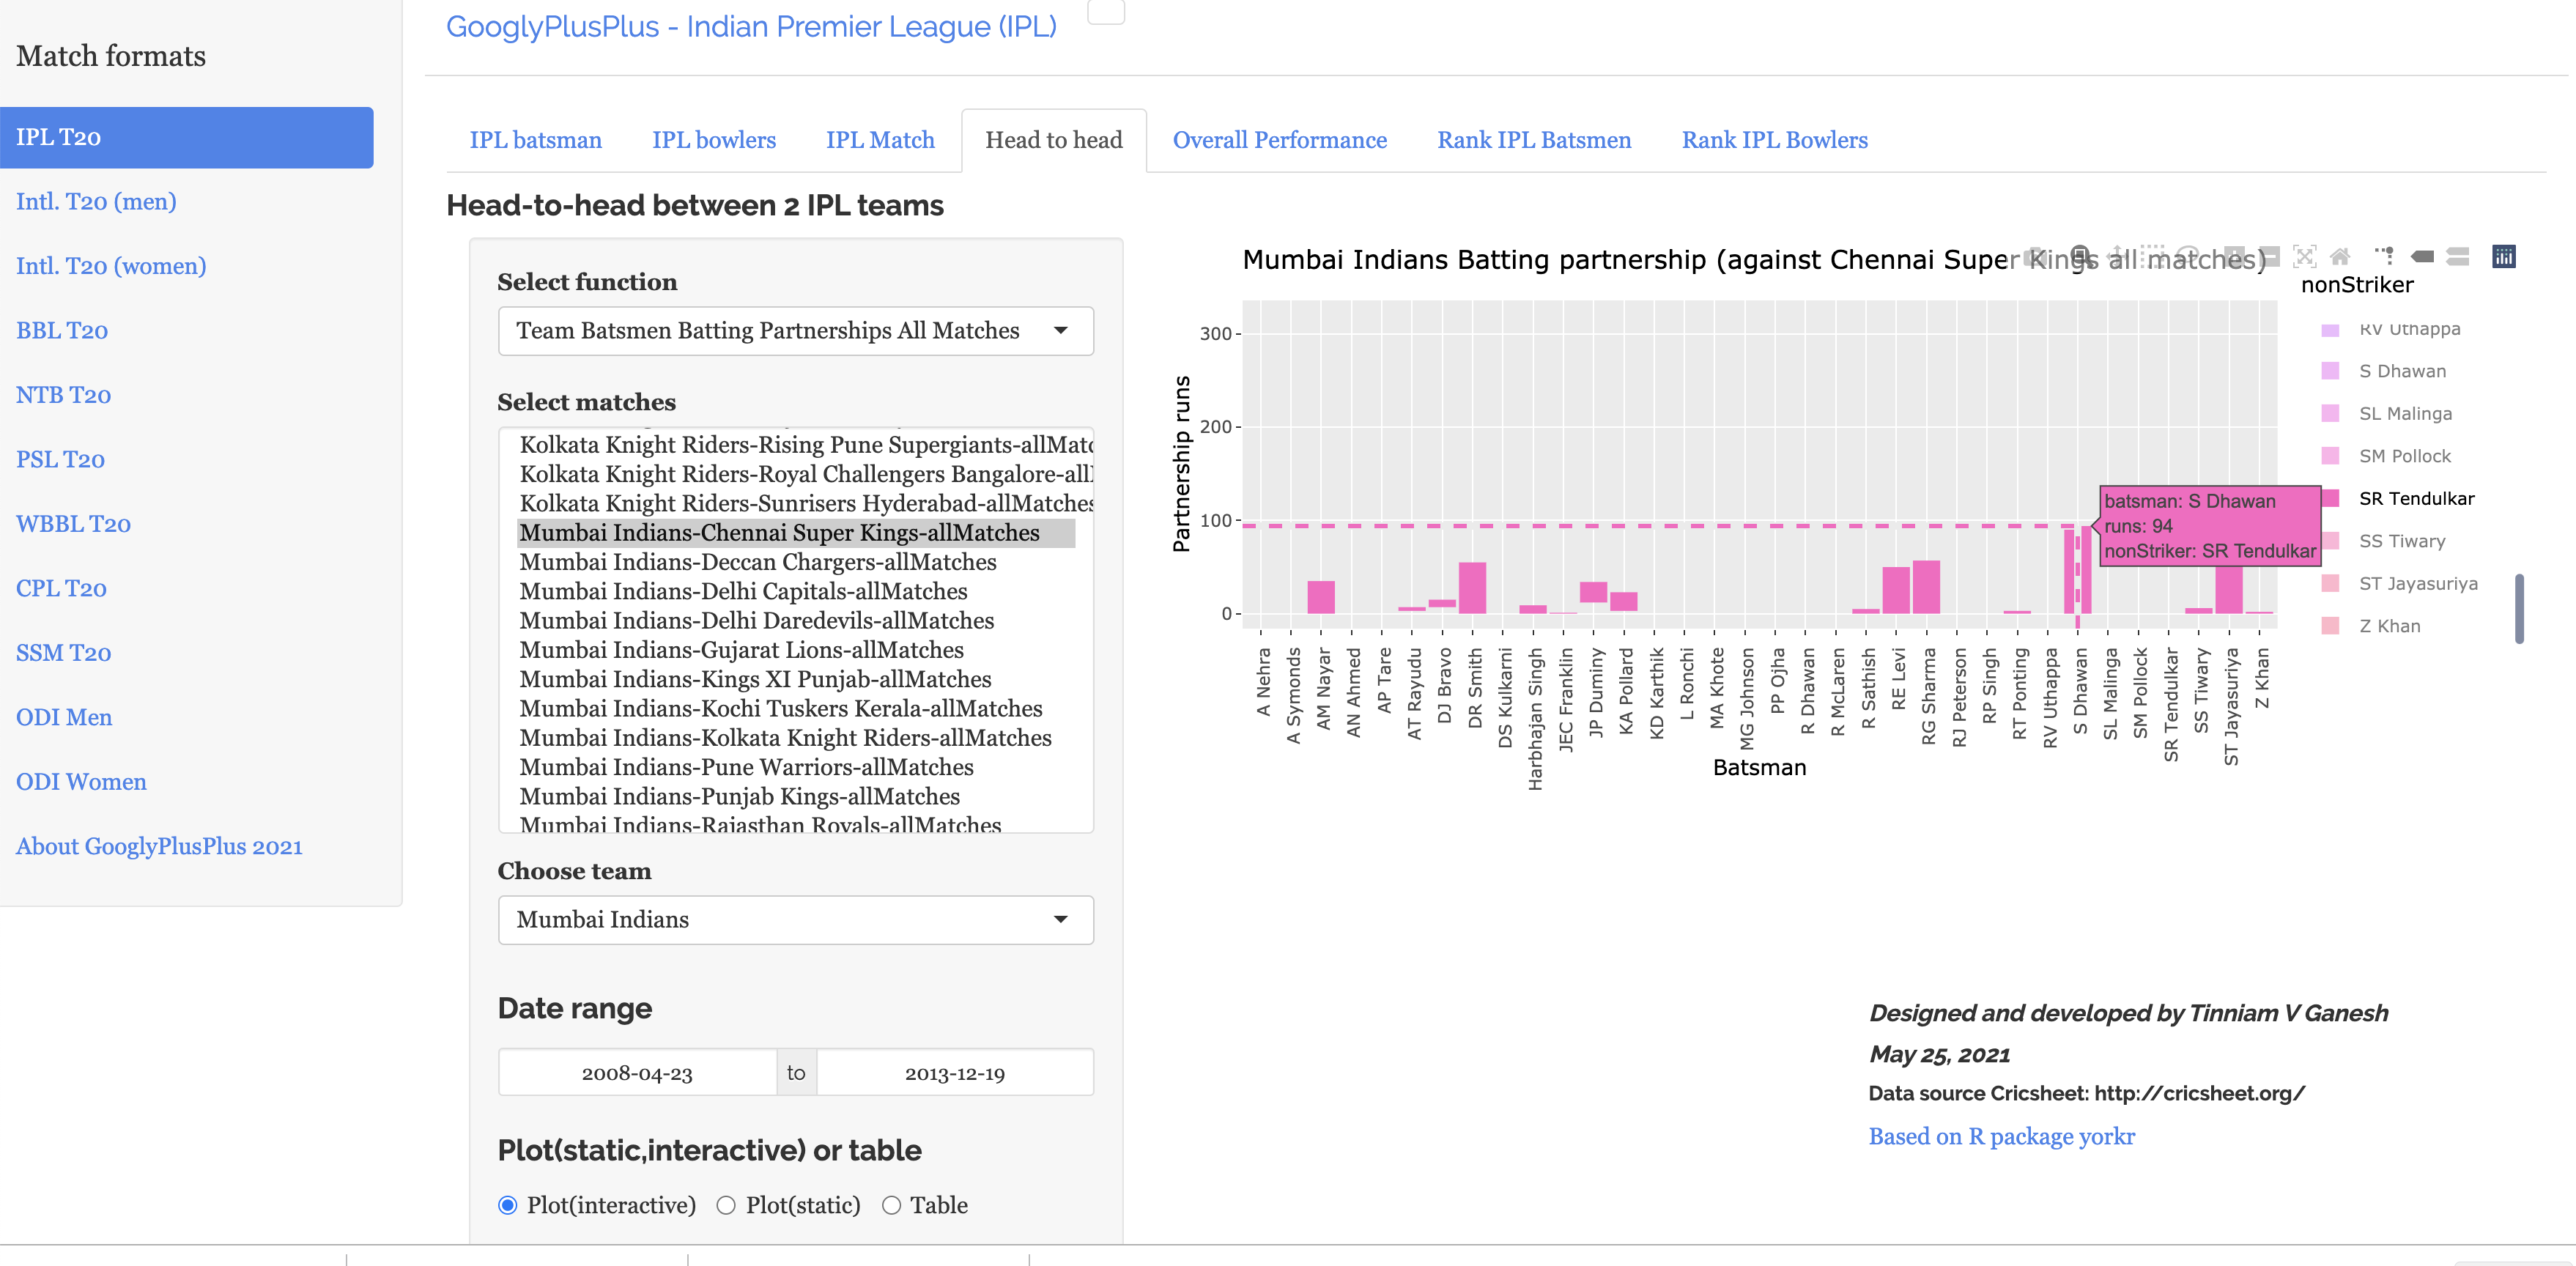
a) Wickets vs ER during Power play of Mumbai Indians in all matches against Chennai Super Kings (IPL)
b) Karachi Kings Runs vs SR during middle overs against Multan Sultans (PSL)
c) Wickets vs ER during death overs of Barbados Tridents in all matches against Jamaica Tallawahs (CPL)
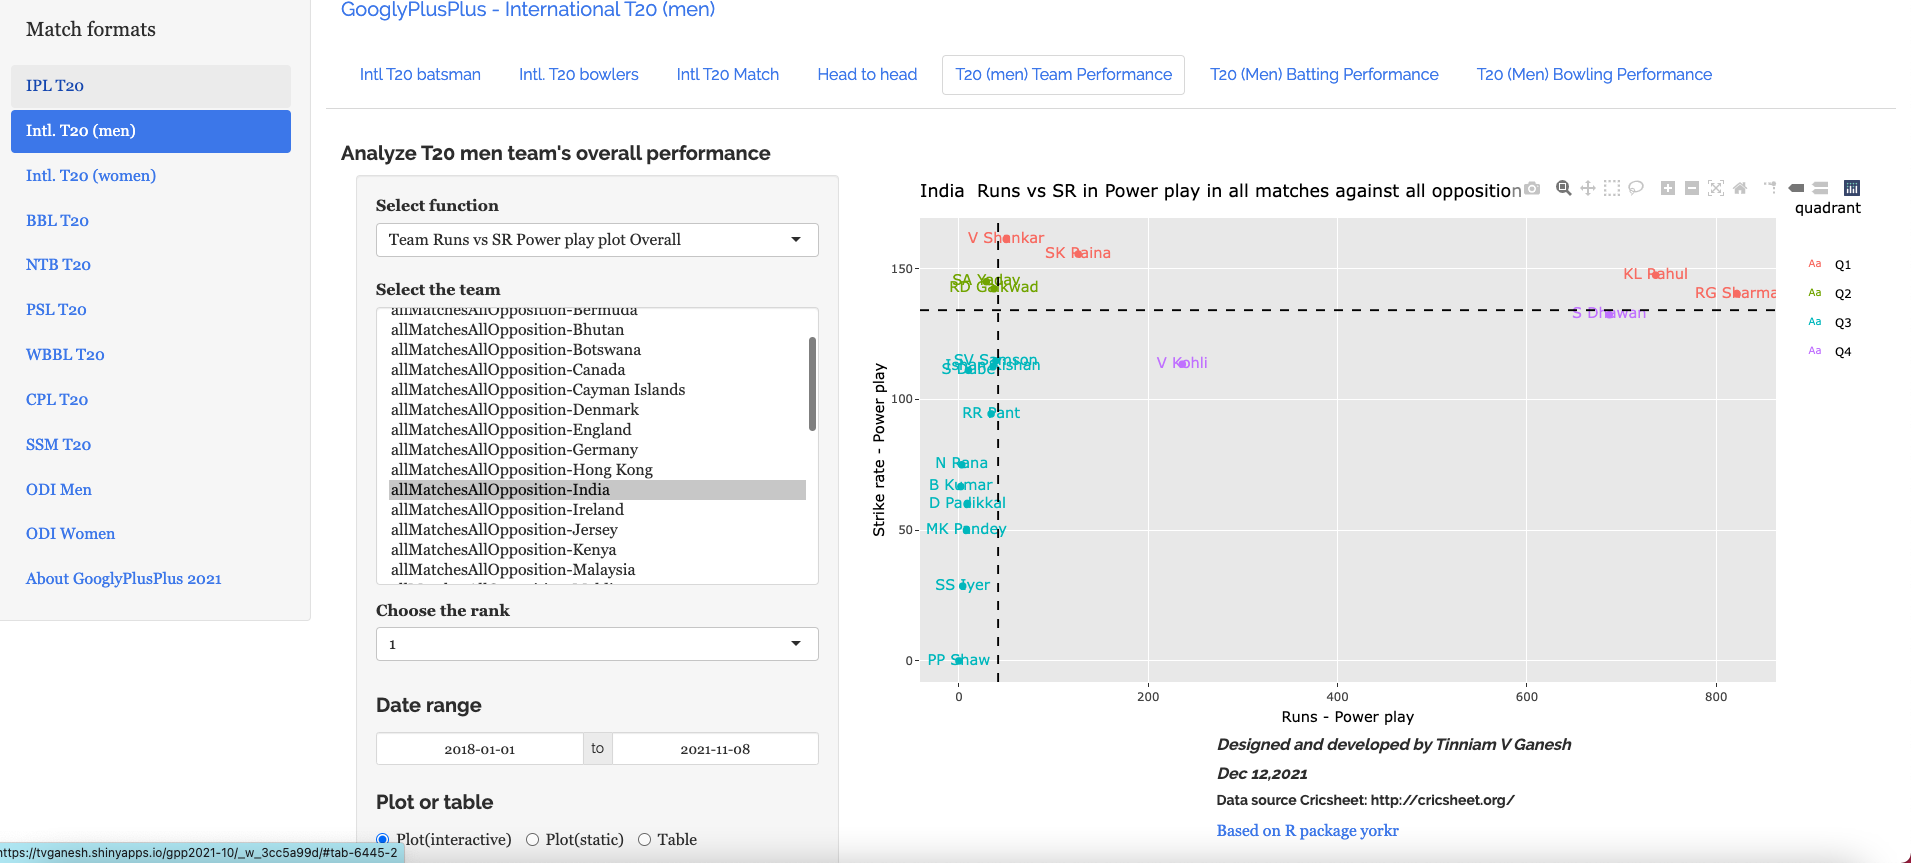
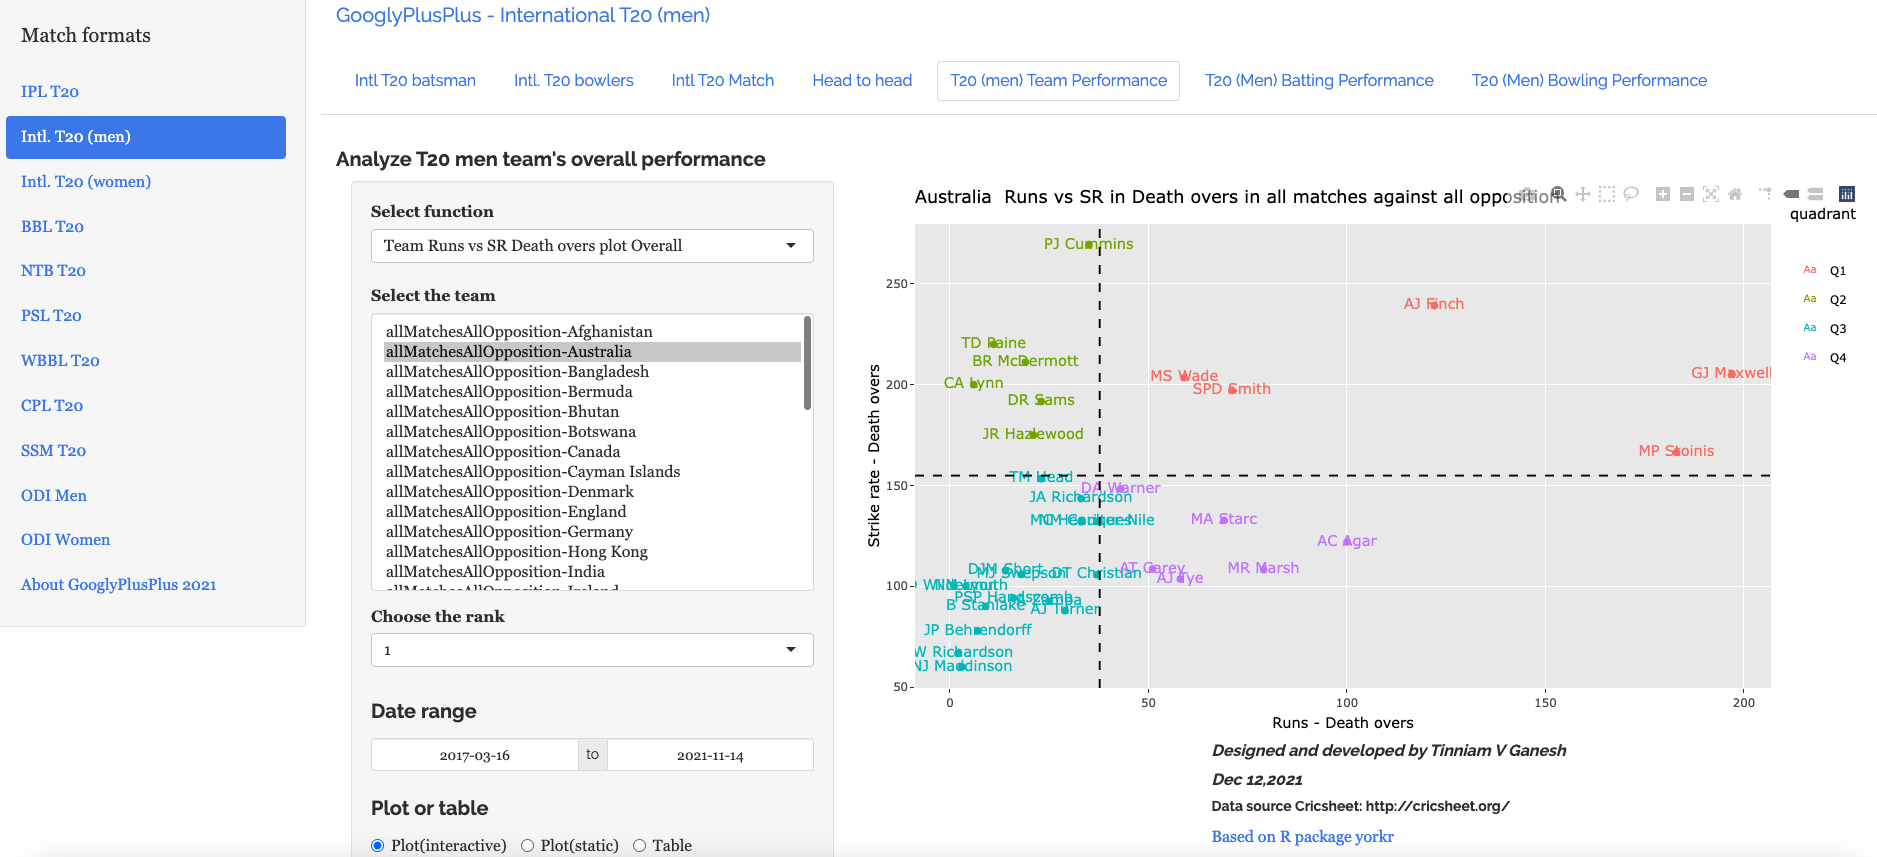
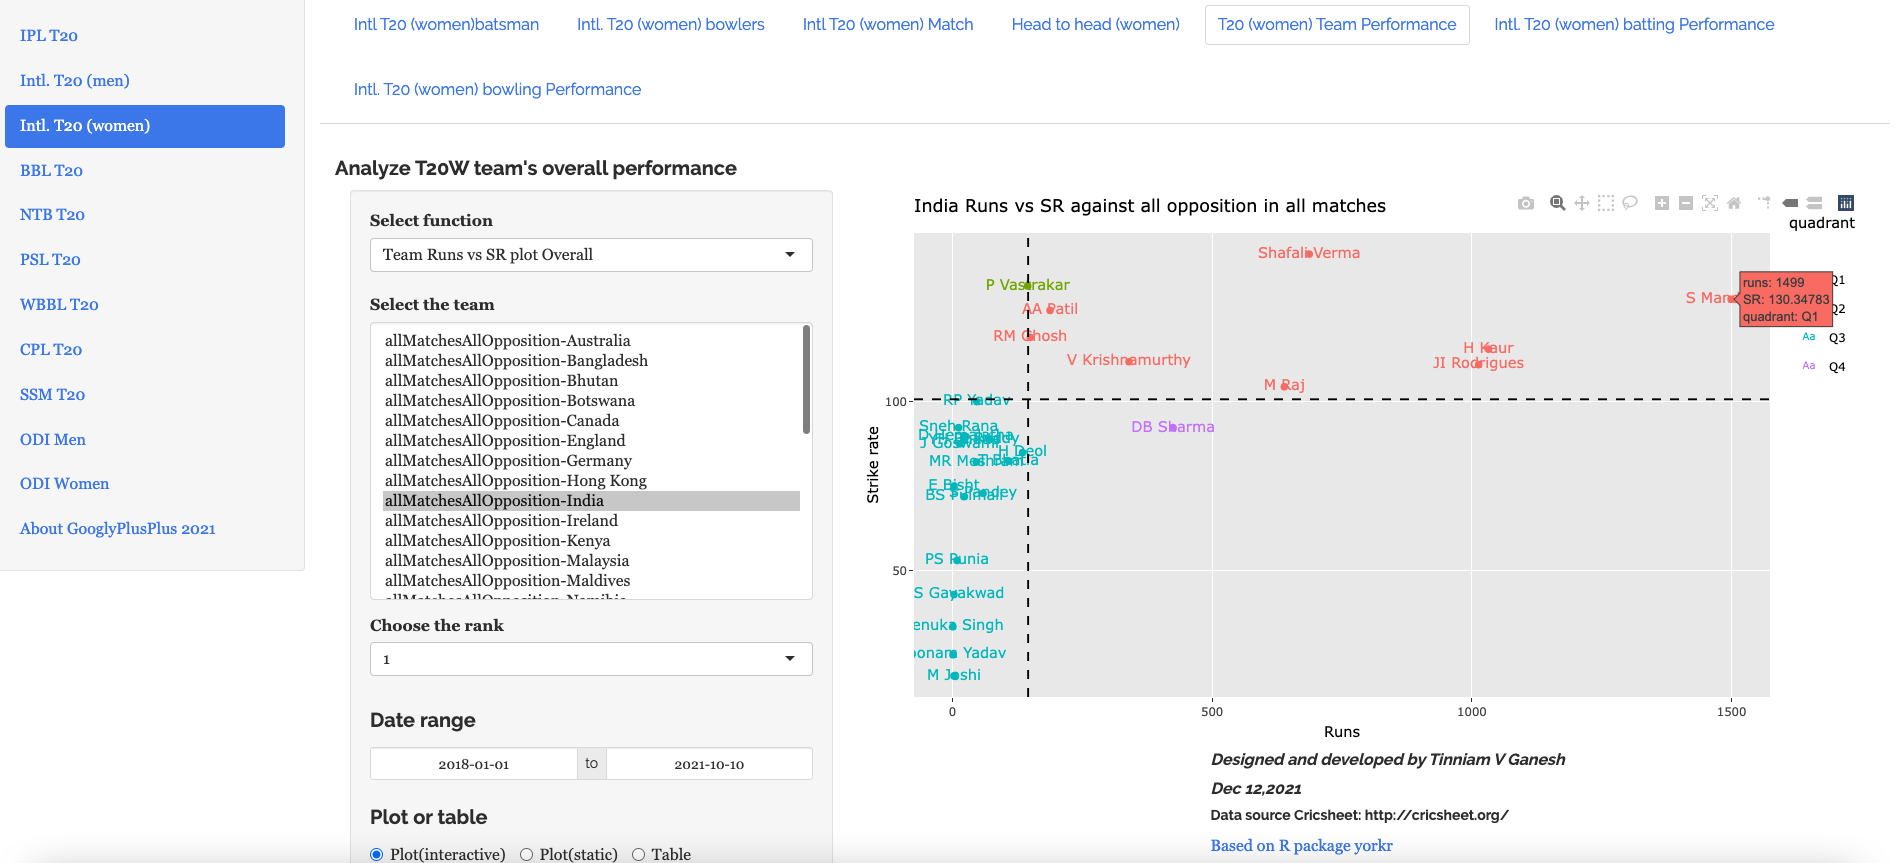
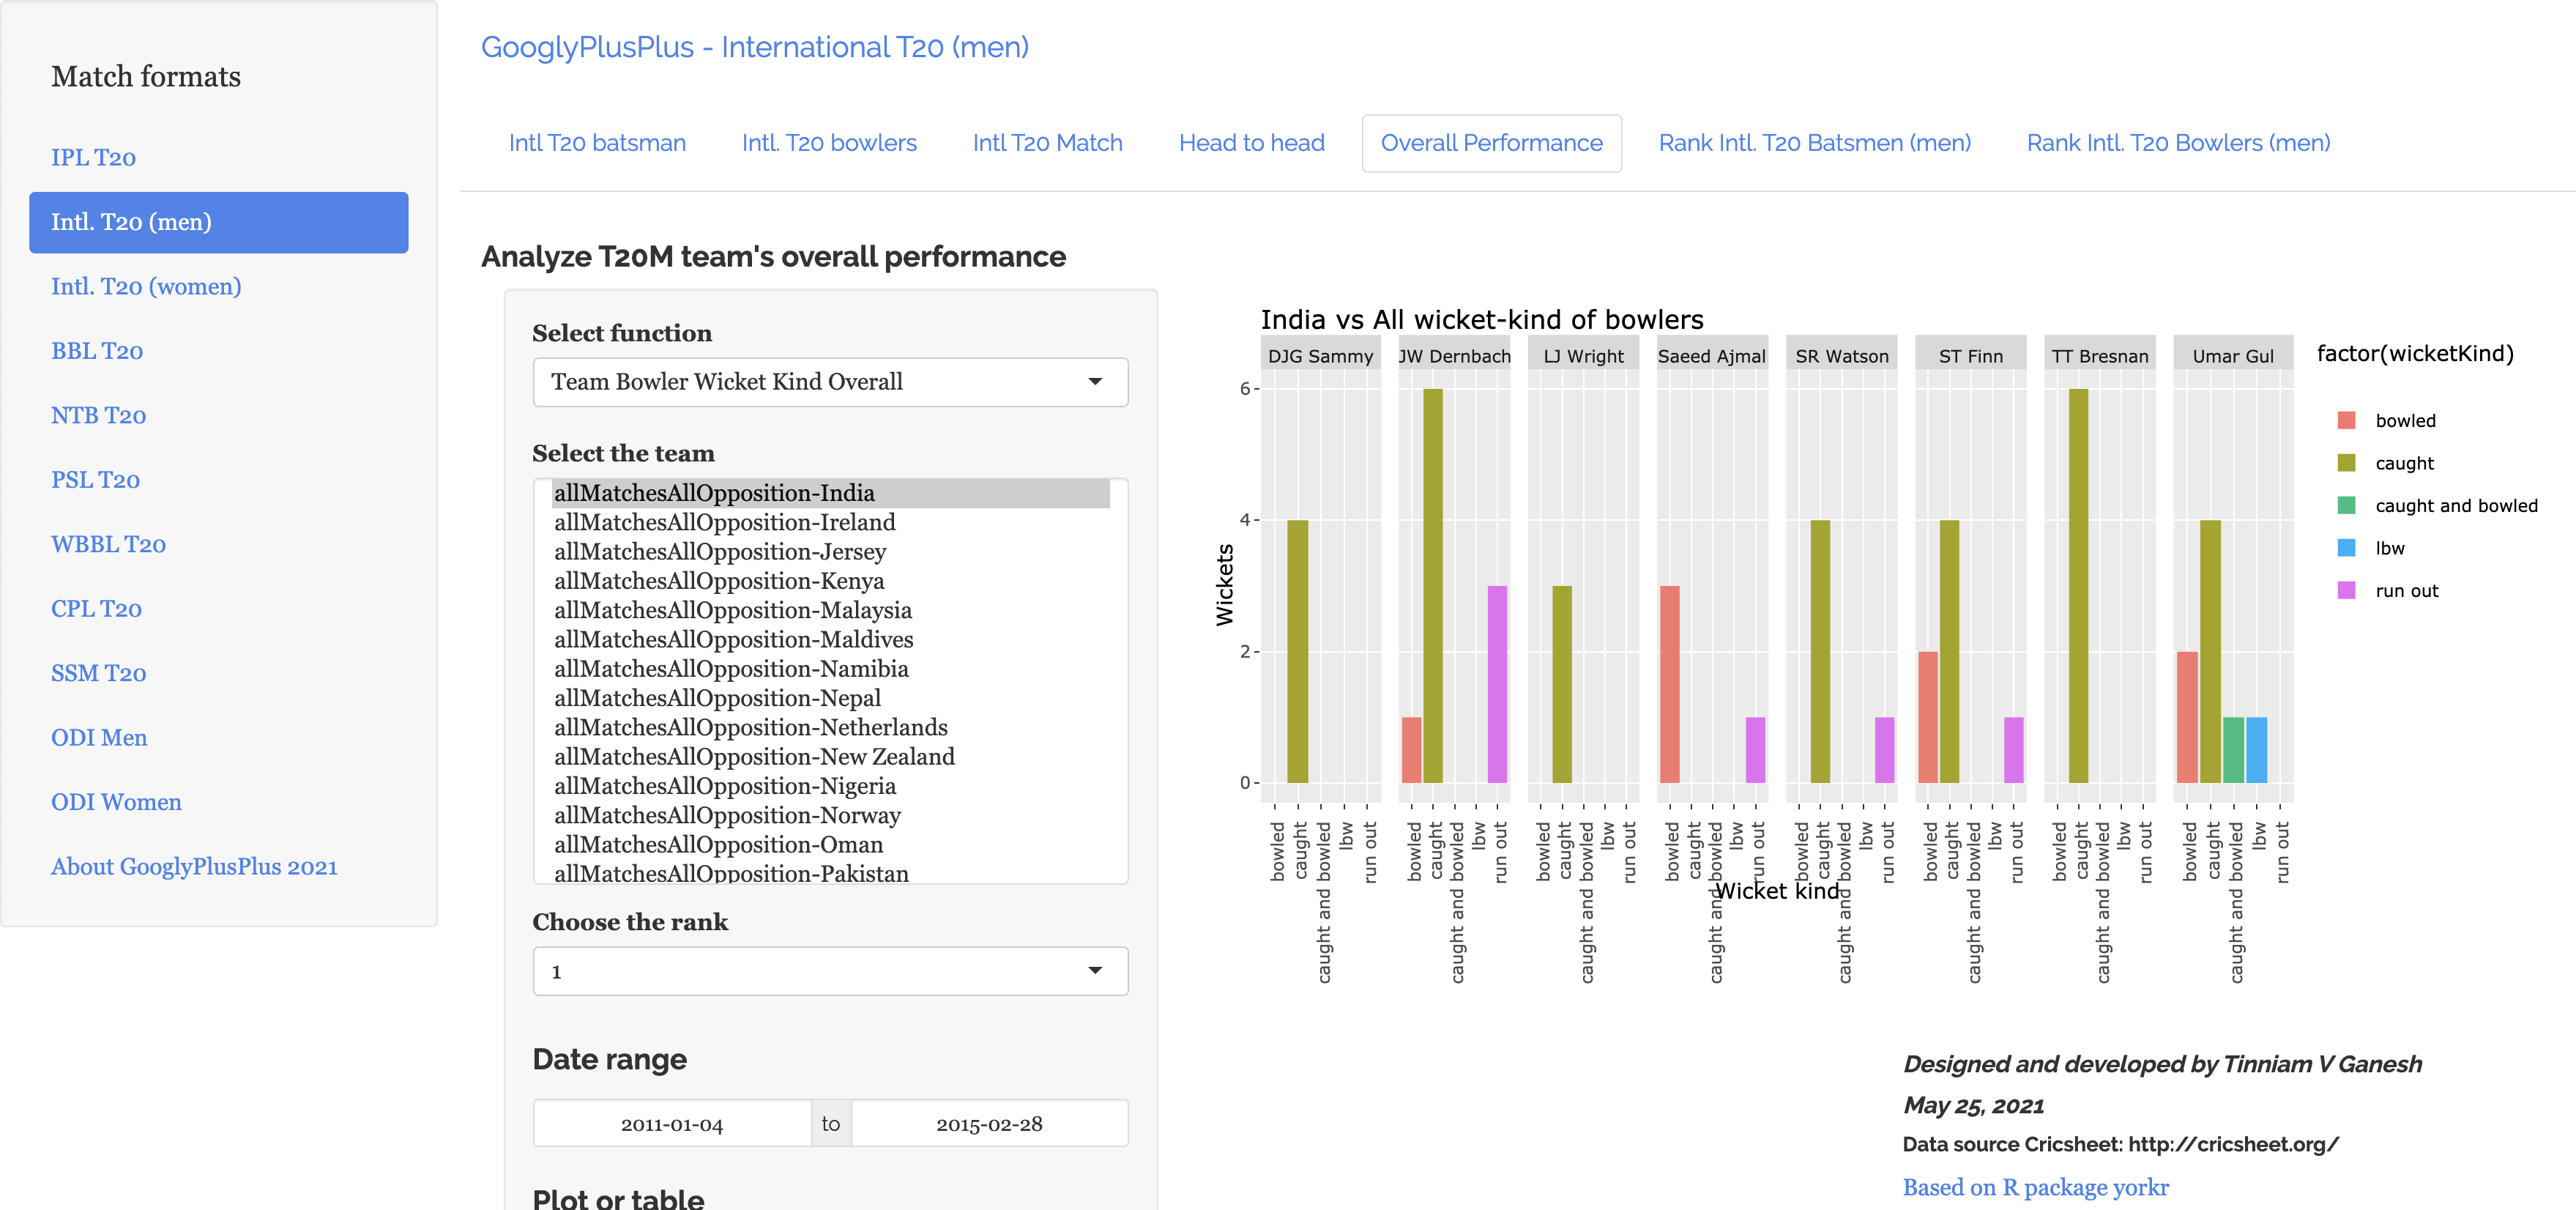
III) Teams overall batting performance
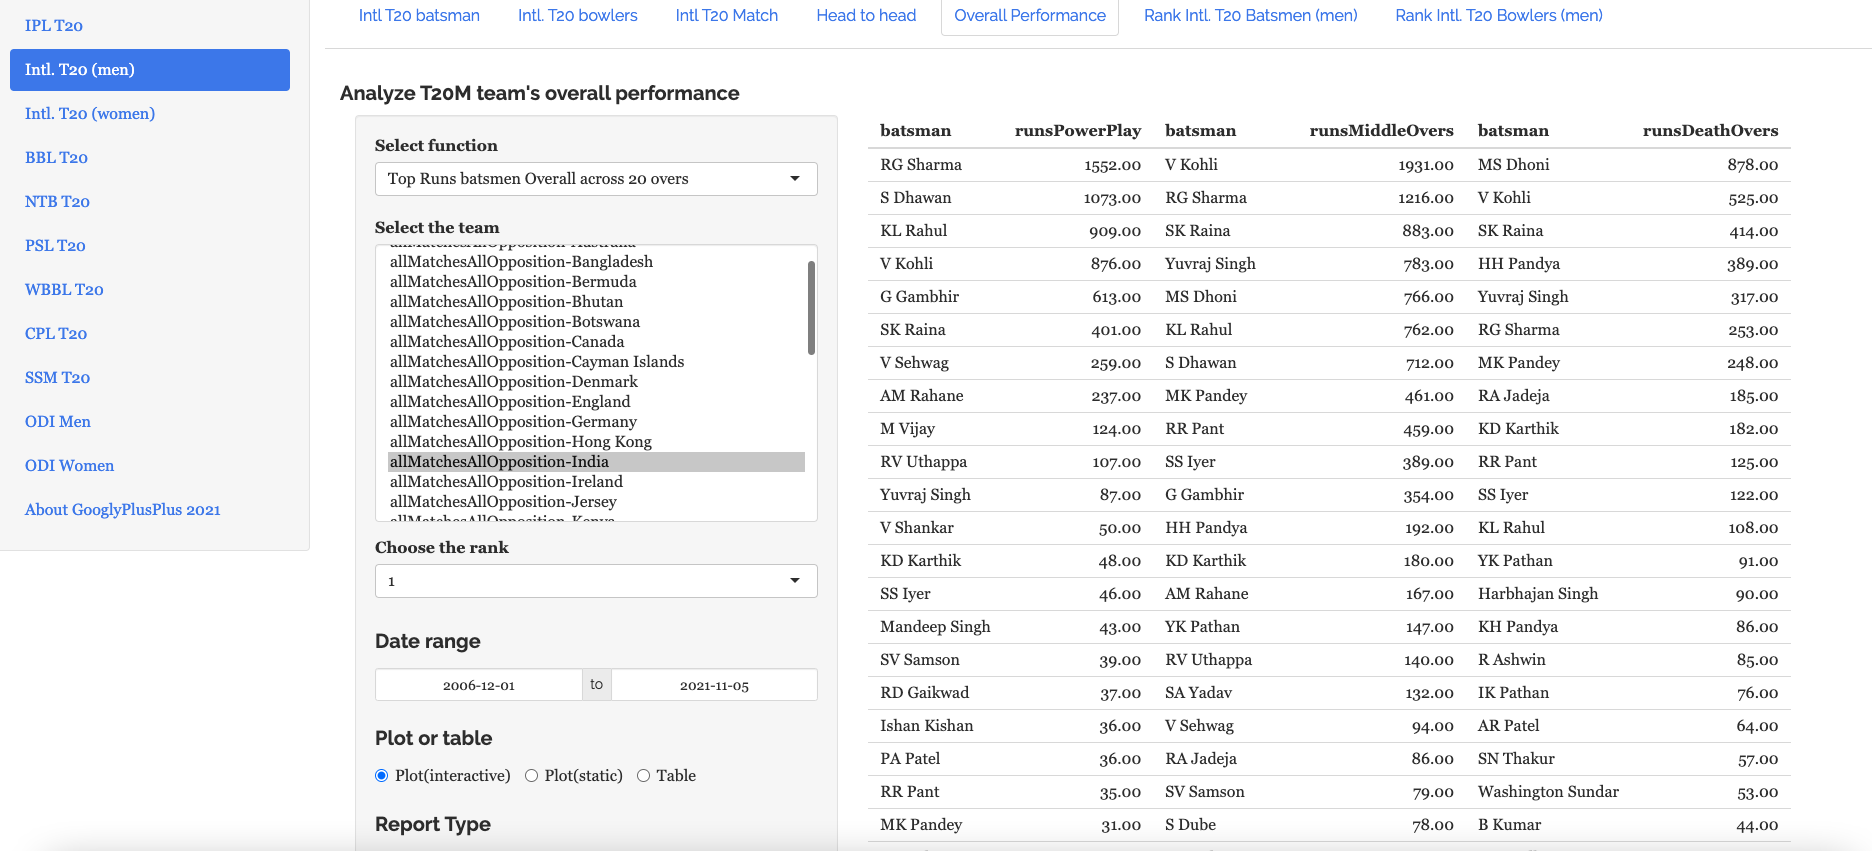
India’s best T20 performers in Power play since 2018 (Intl. T20)
e) Australia’s best performers in Death overs since Mar 2017 (Intl. T20)
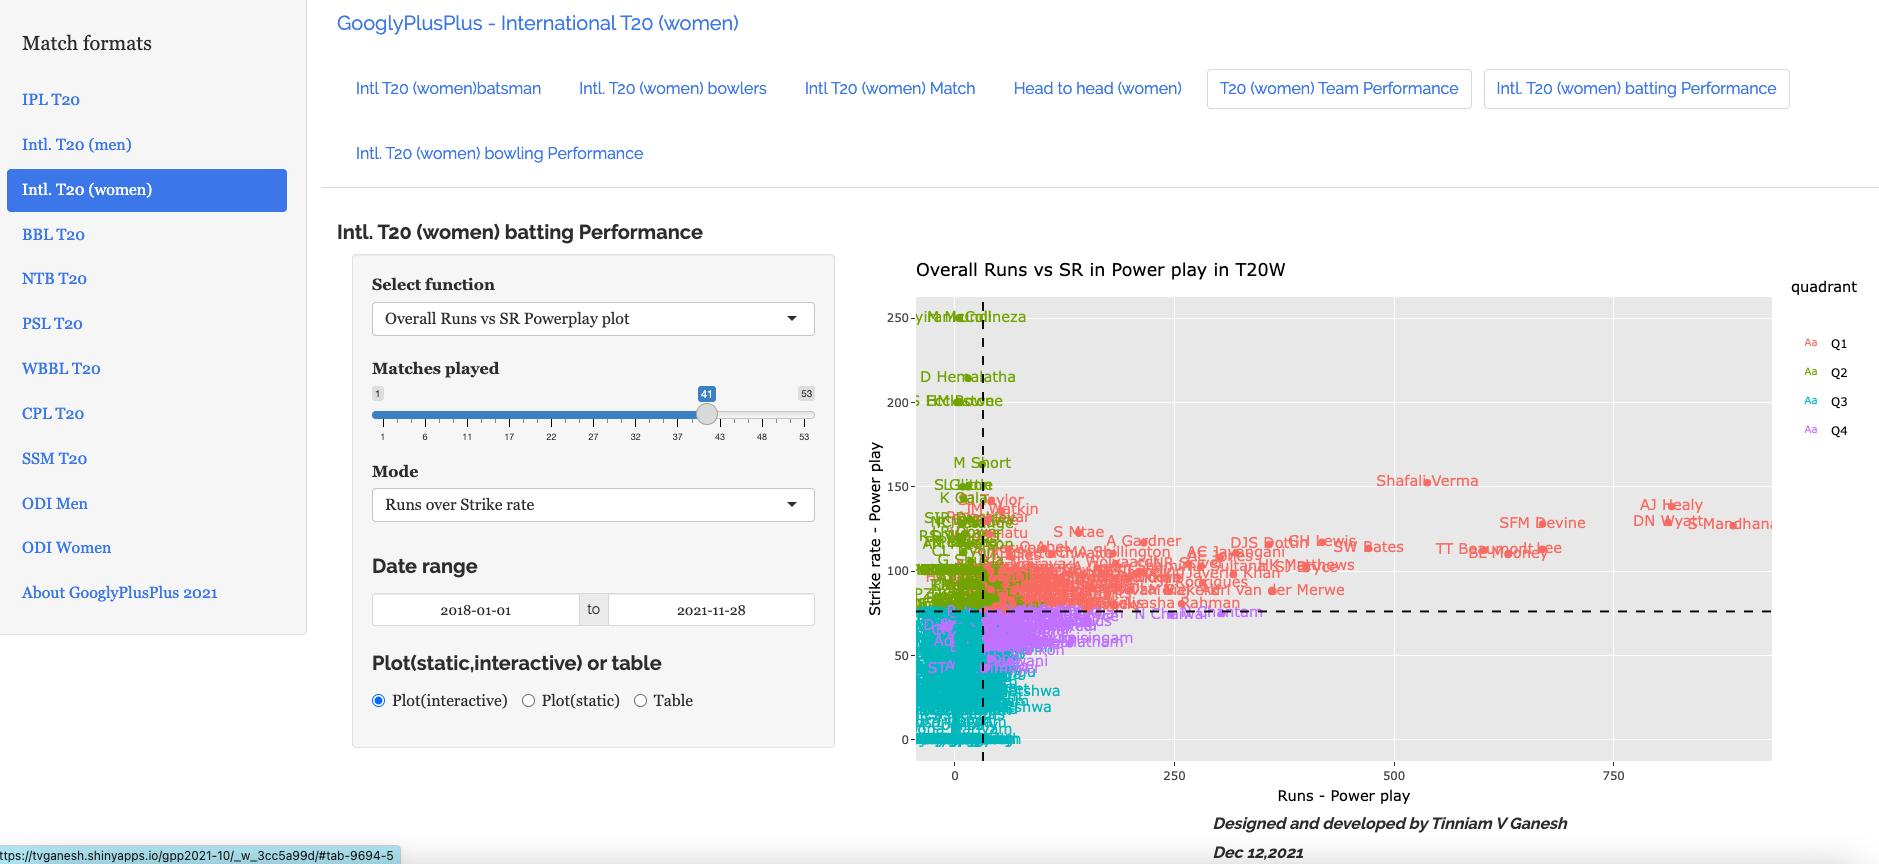
f) India’s Intl. T20 (women) best Runs vs SR since 2018
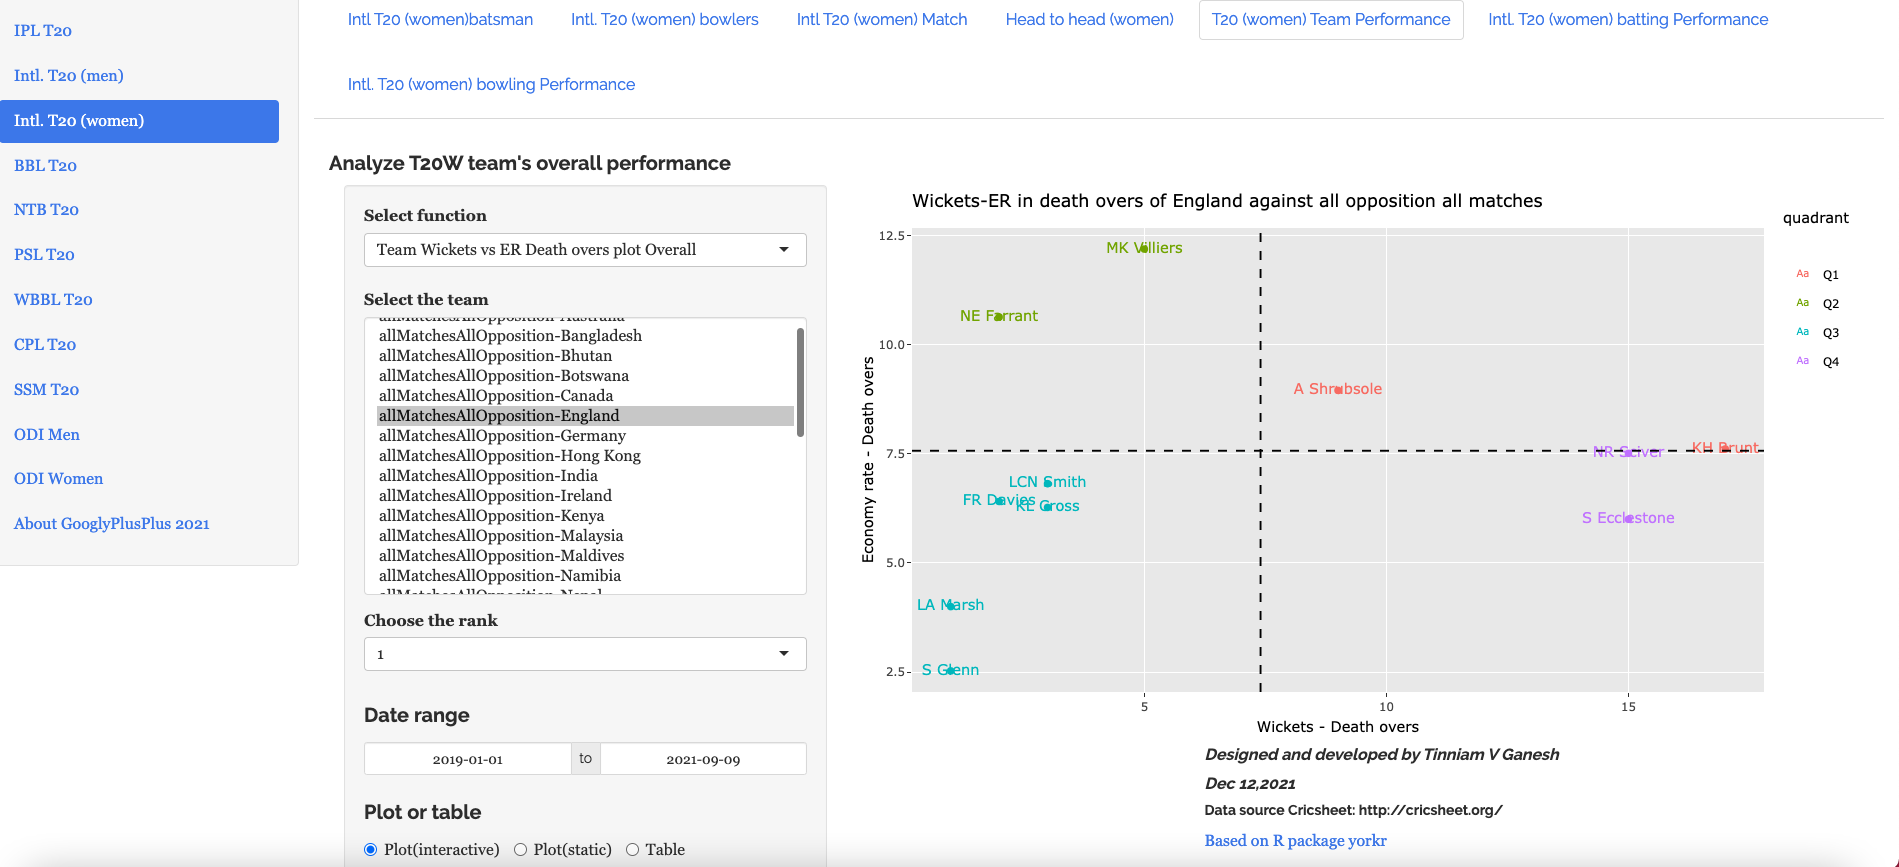
g) England’s Intl. T20 (women) best bowlers in Death overs
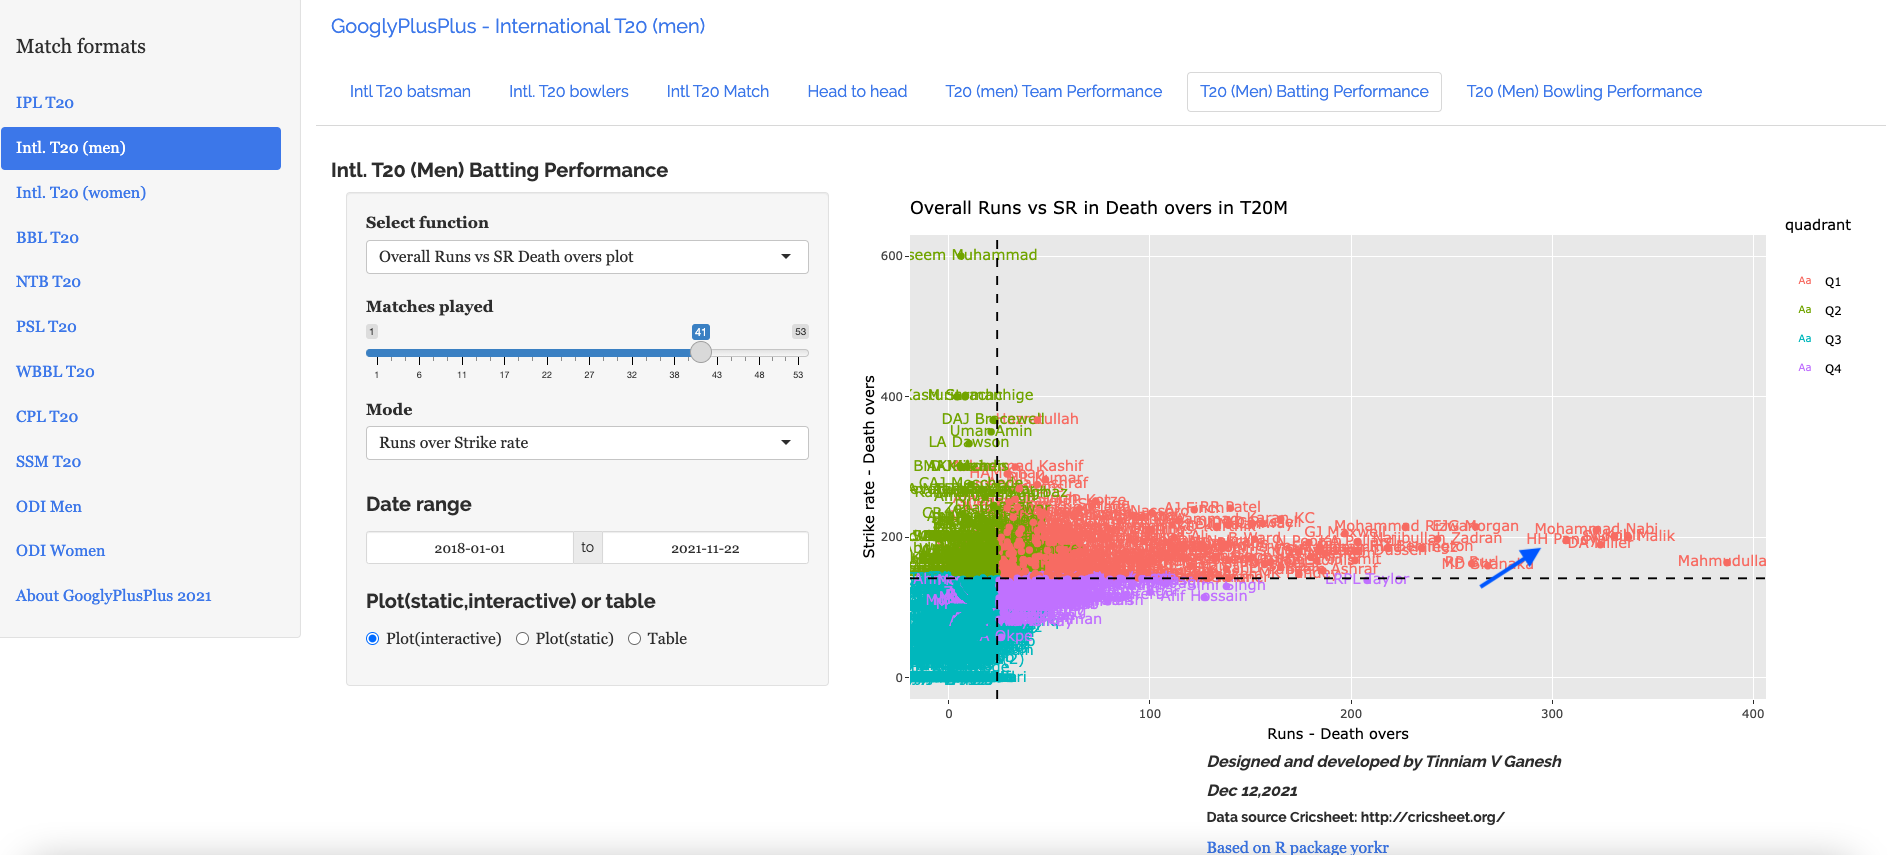
IV) Overall Batting Performanceacross T20
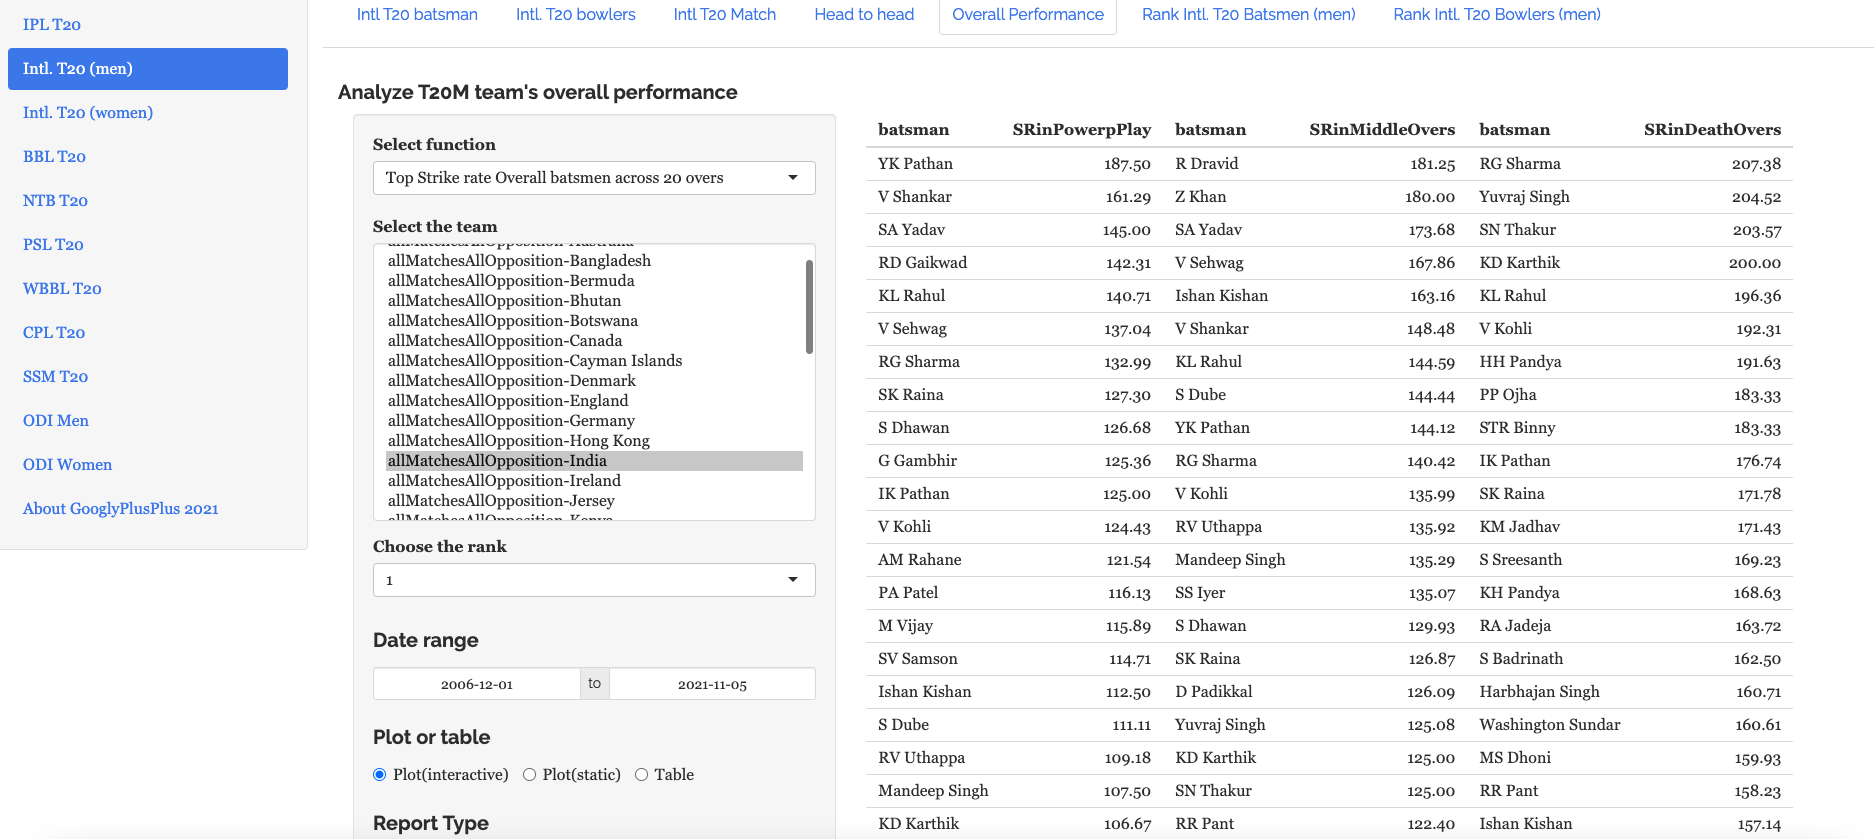
This tab gives the batsmen’s rank and overall batting performance across the T20 format.
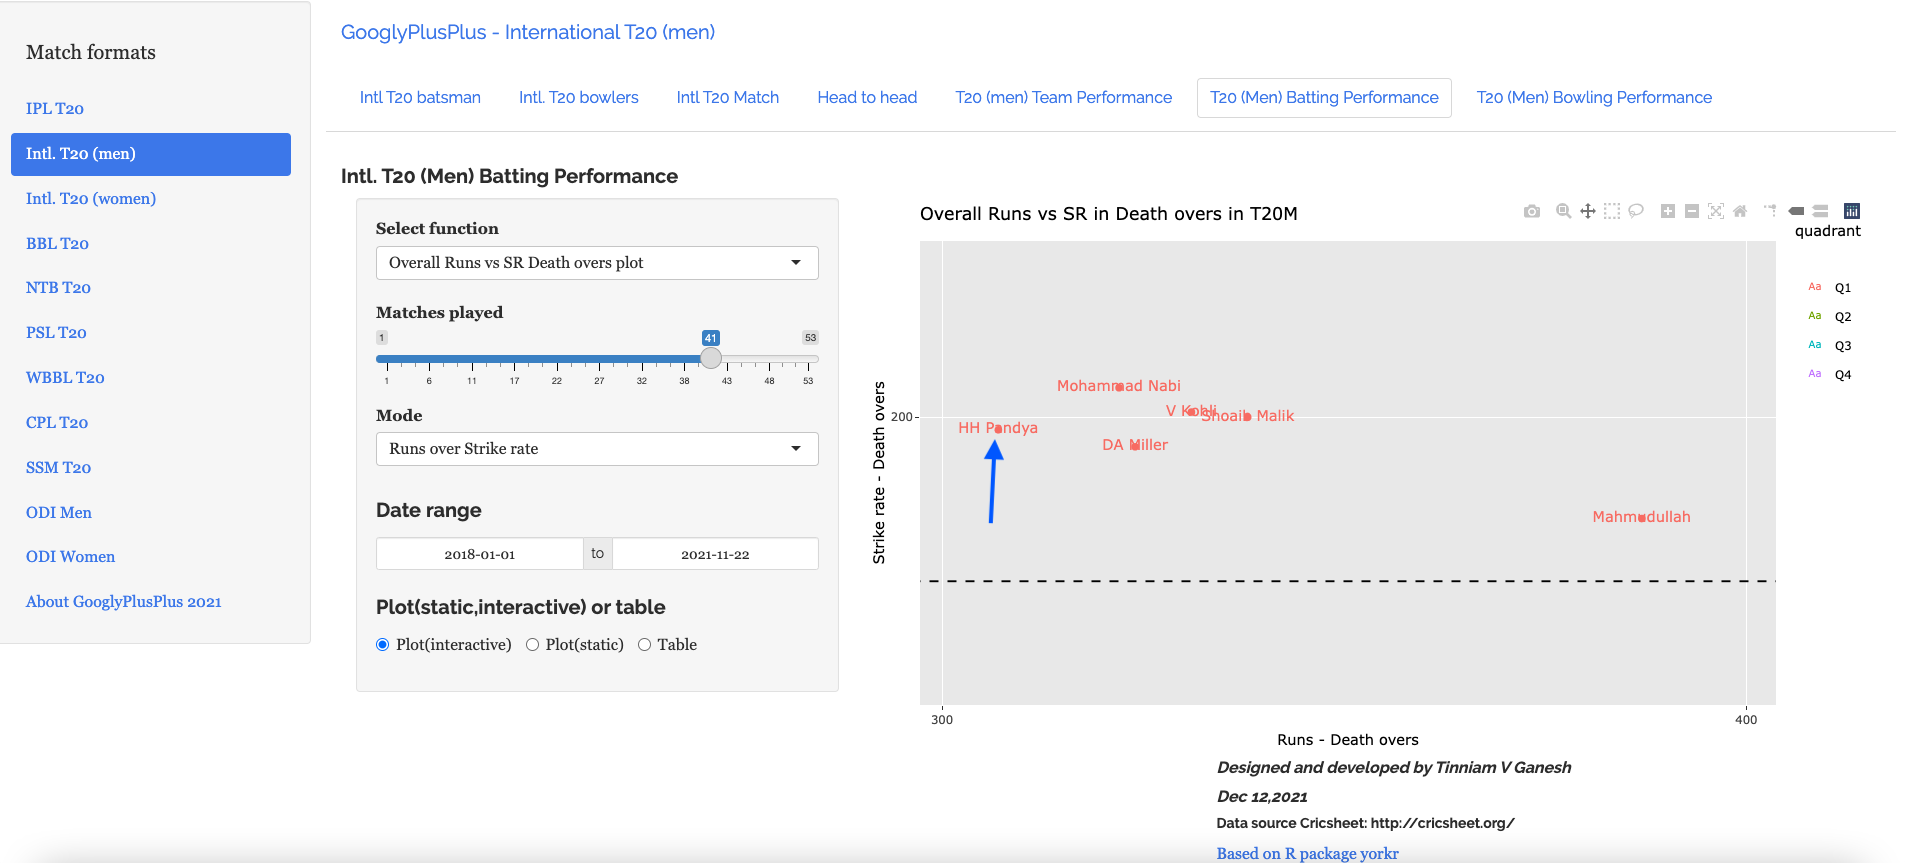
a) Why was Hardik Pandya chosen, and why this was in error?
Of course, it provides an insight into why Hardik Pandya was chosen in India’s World cup team despite poor performances recently. Here are the best Intl. T20 death over batsmen
Of course, we can zoom in to get a better look
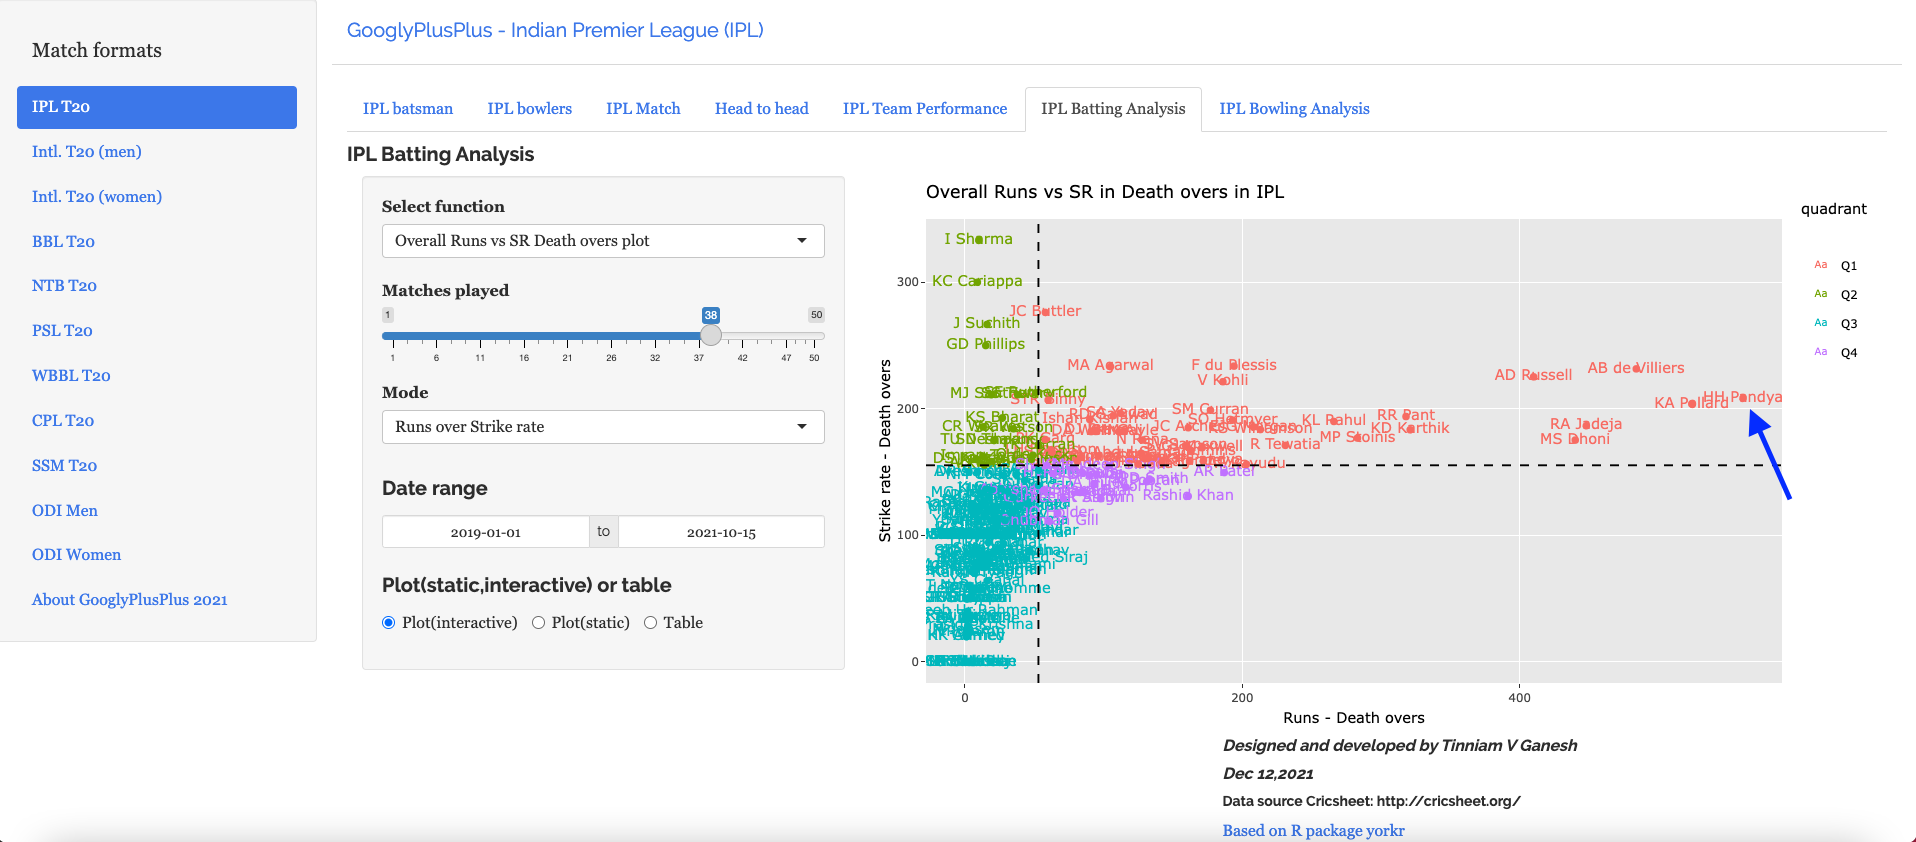
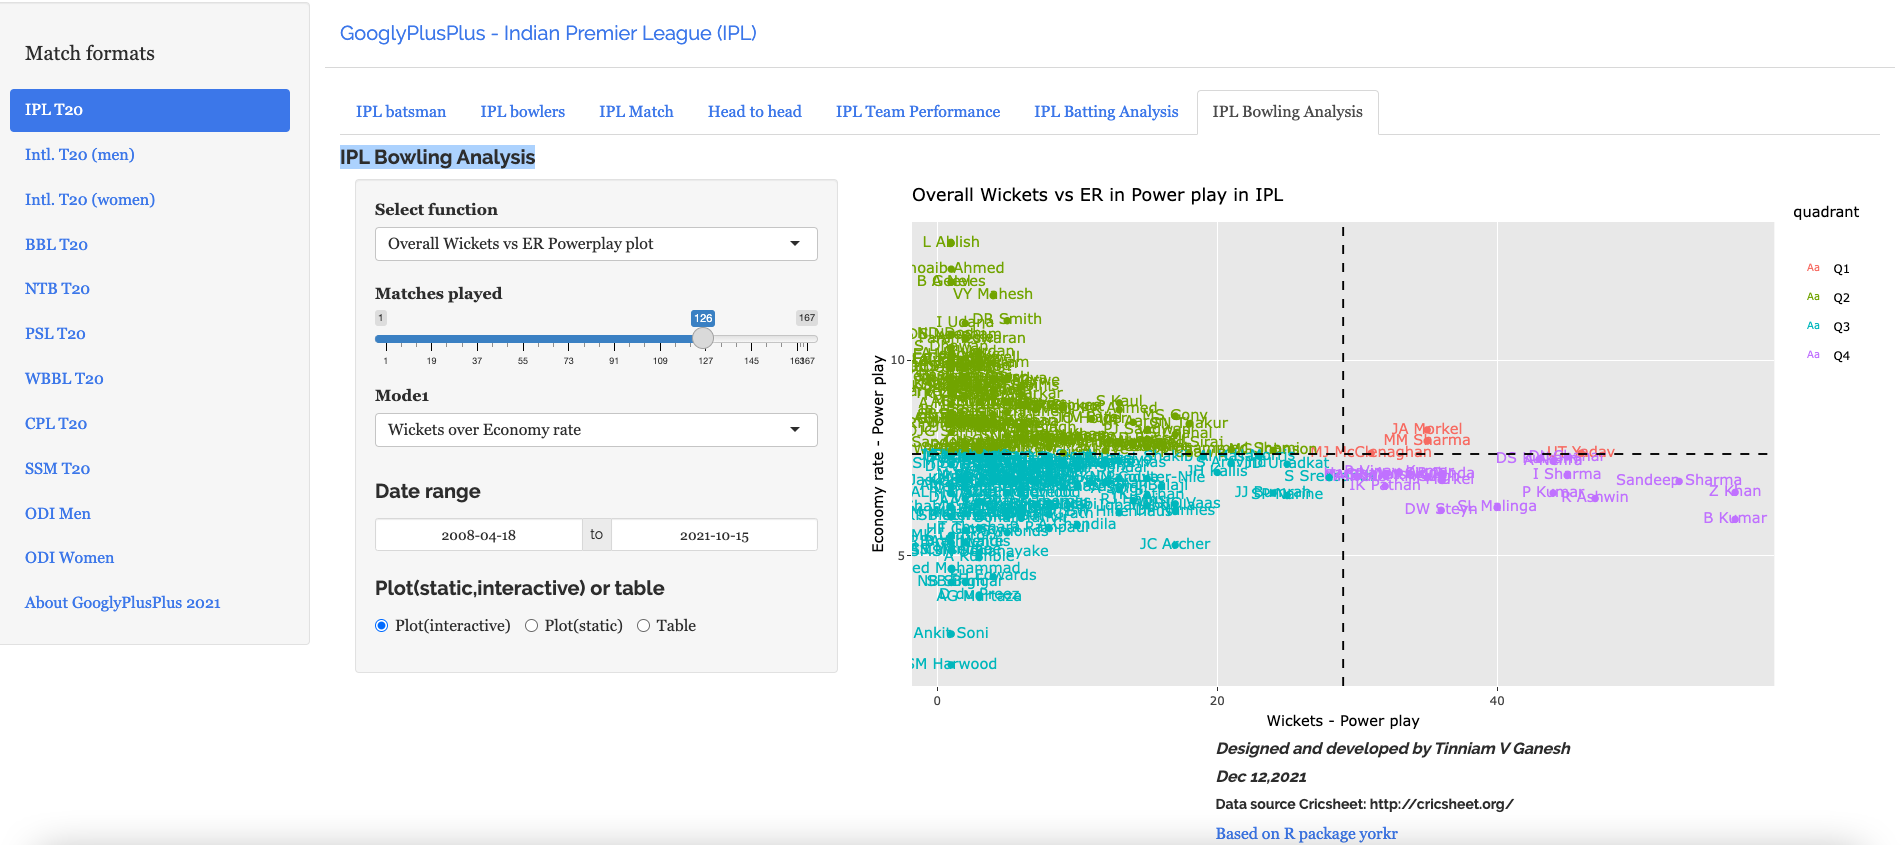
This is further substantiated when we performances in IPL
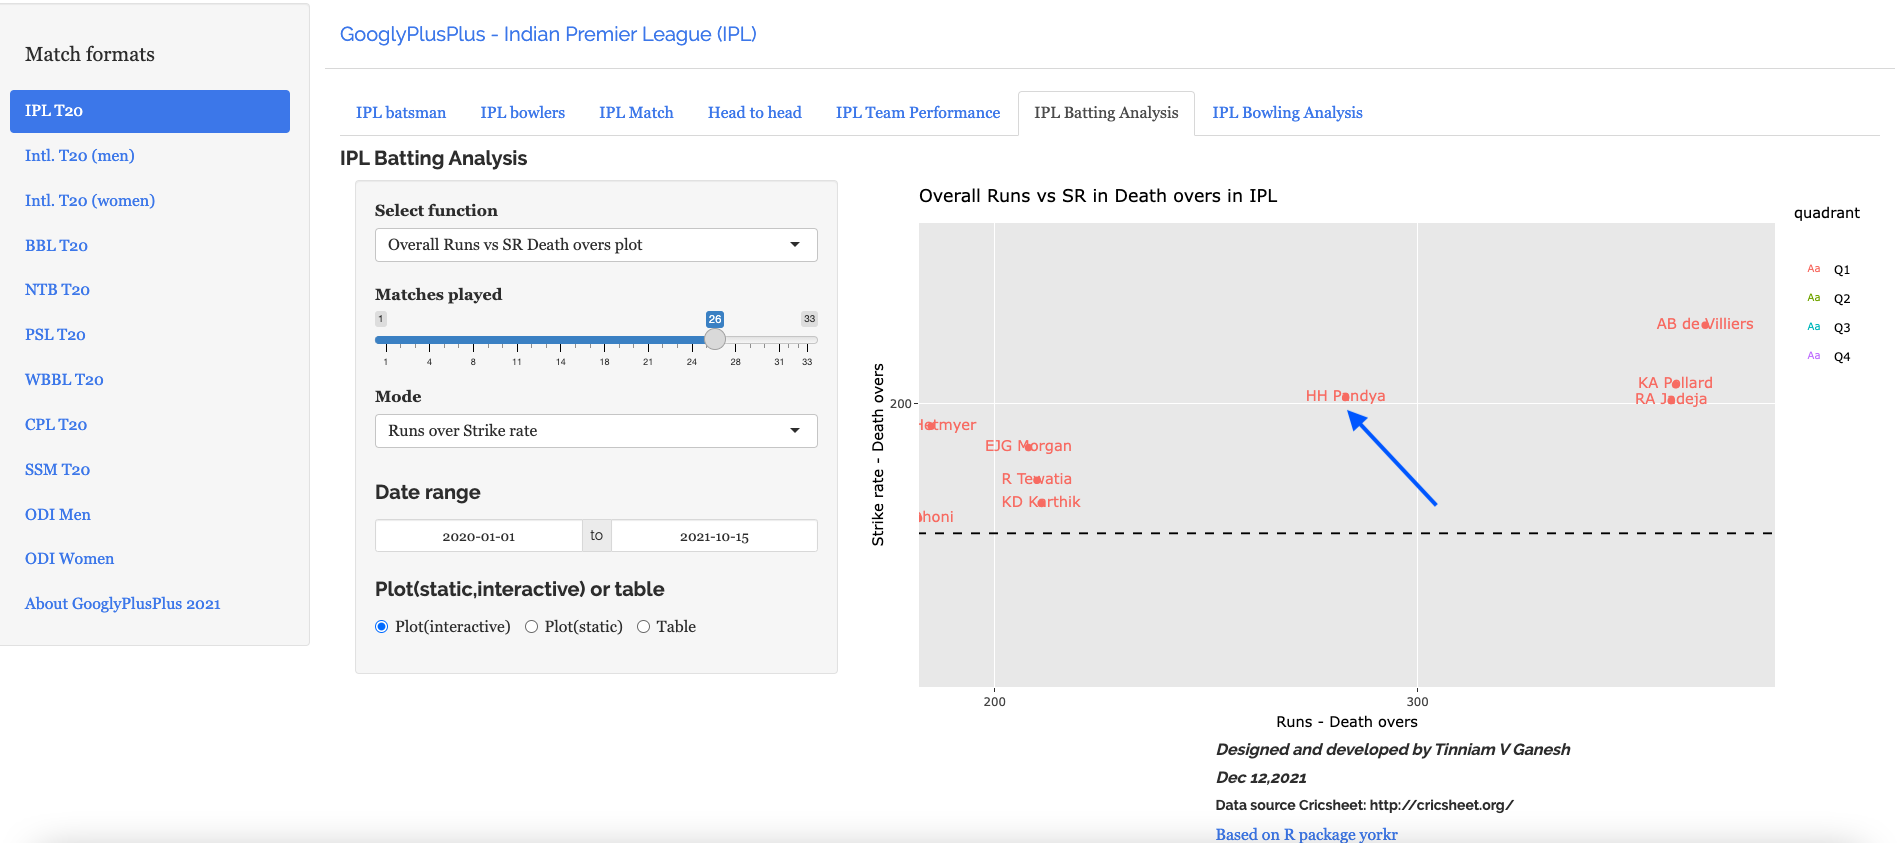
However, if you move the needle forward a year at a time, you see Hardik Pandya’s performance drops significantly
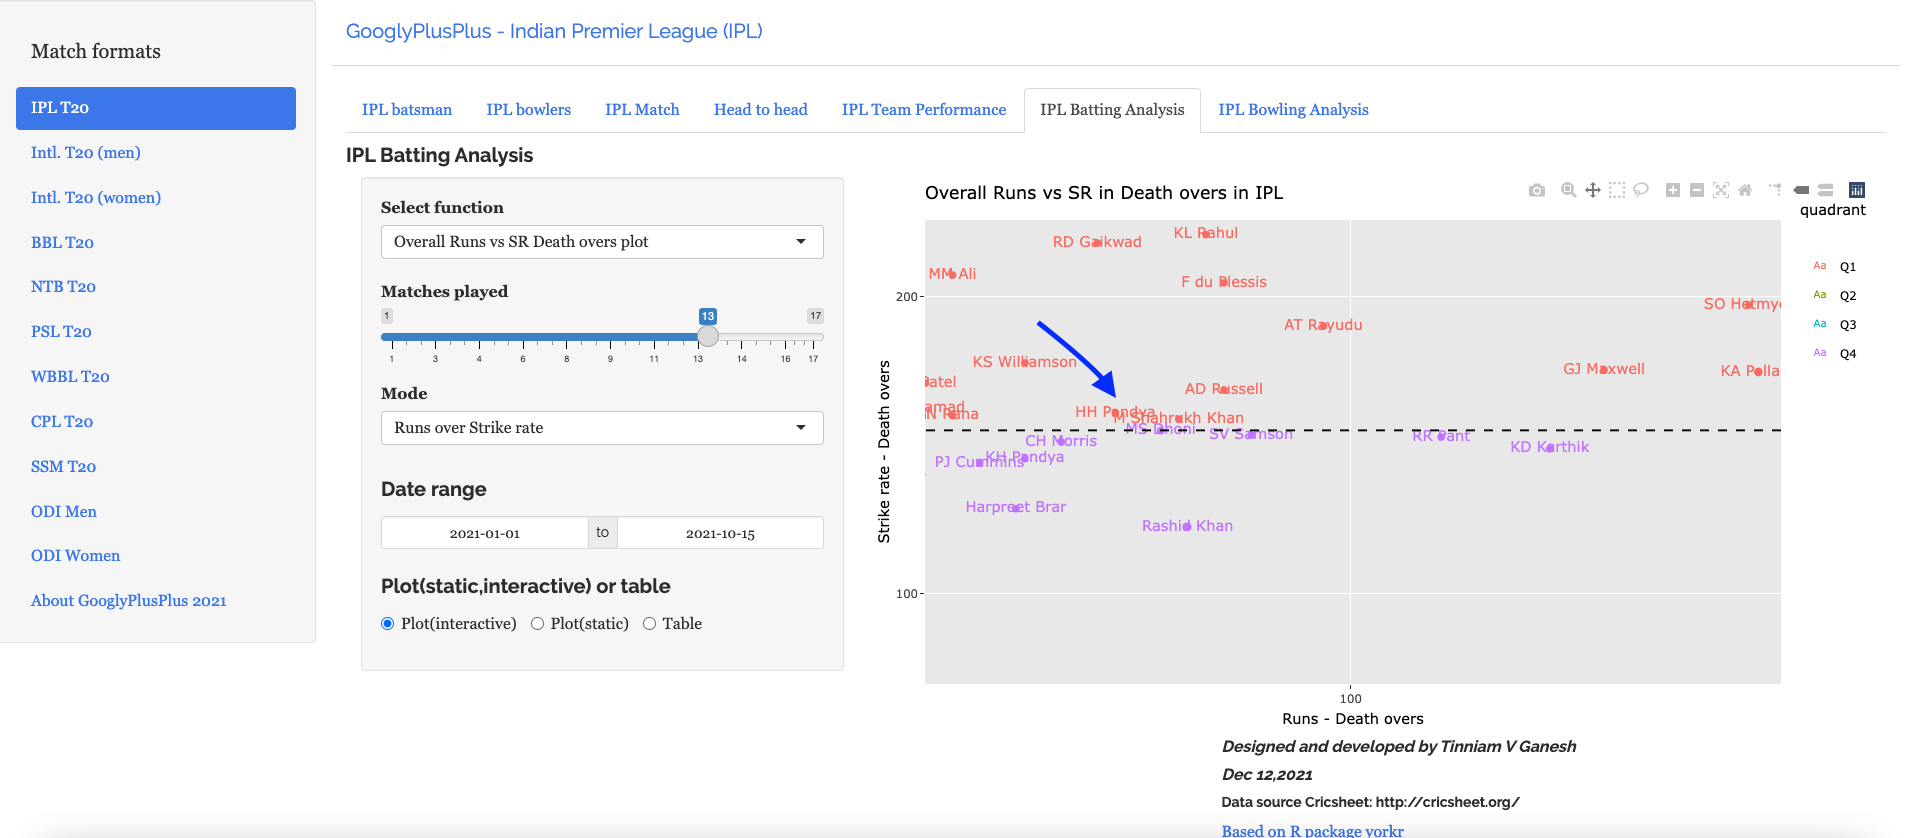
and further down
Rather, Dinesh Karthik, Sanju Samson or Ruturaj Gaikwad would have been better options
b) Best batsmen Intl. T20 (women) in Power play since 2018
V) Overall bowling performance
This tab gives the bowler’s rank and overall bowling performance in Power play, middle and death overs across all T20 formats
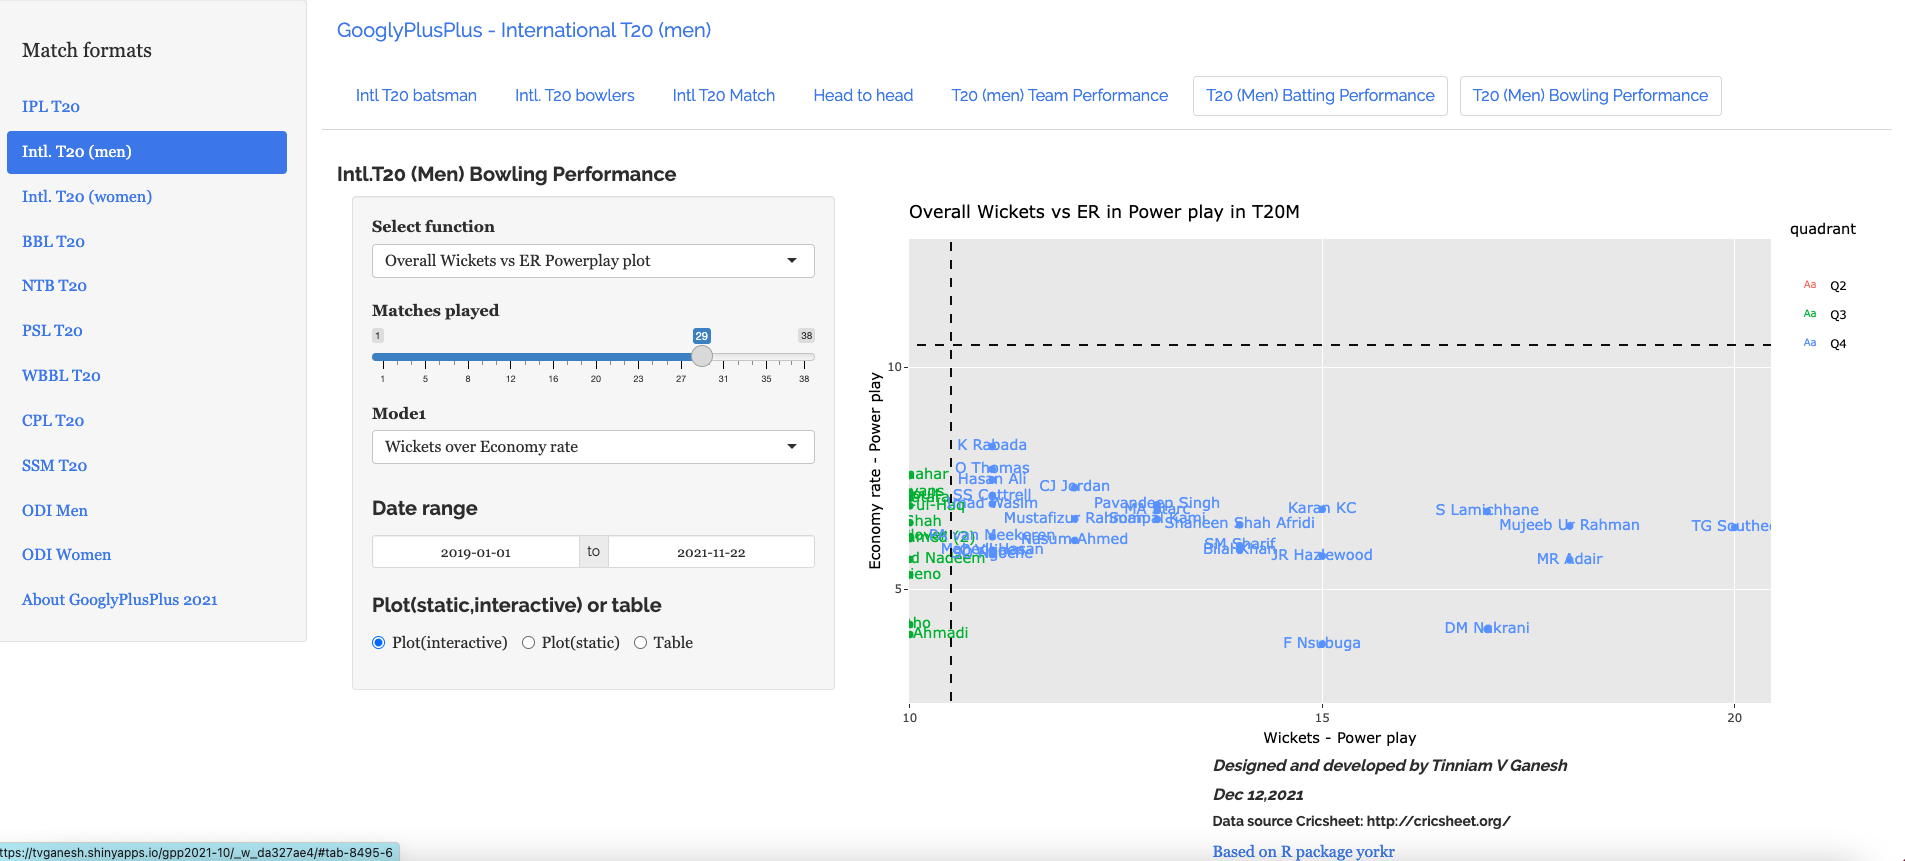
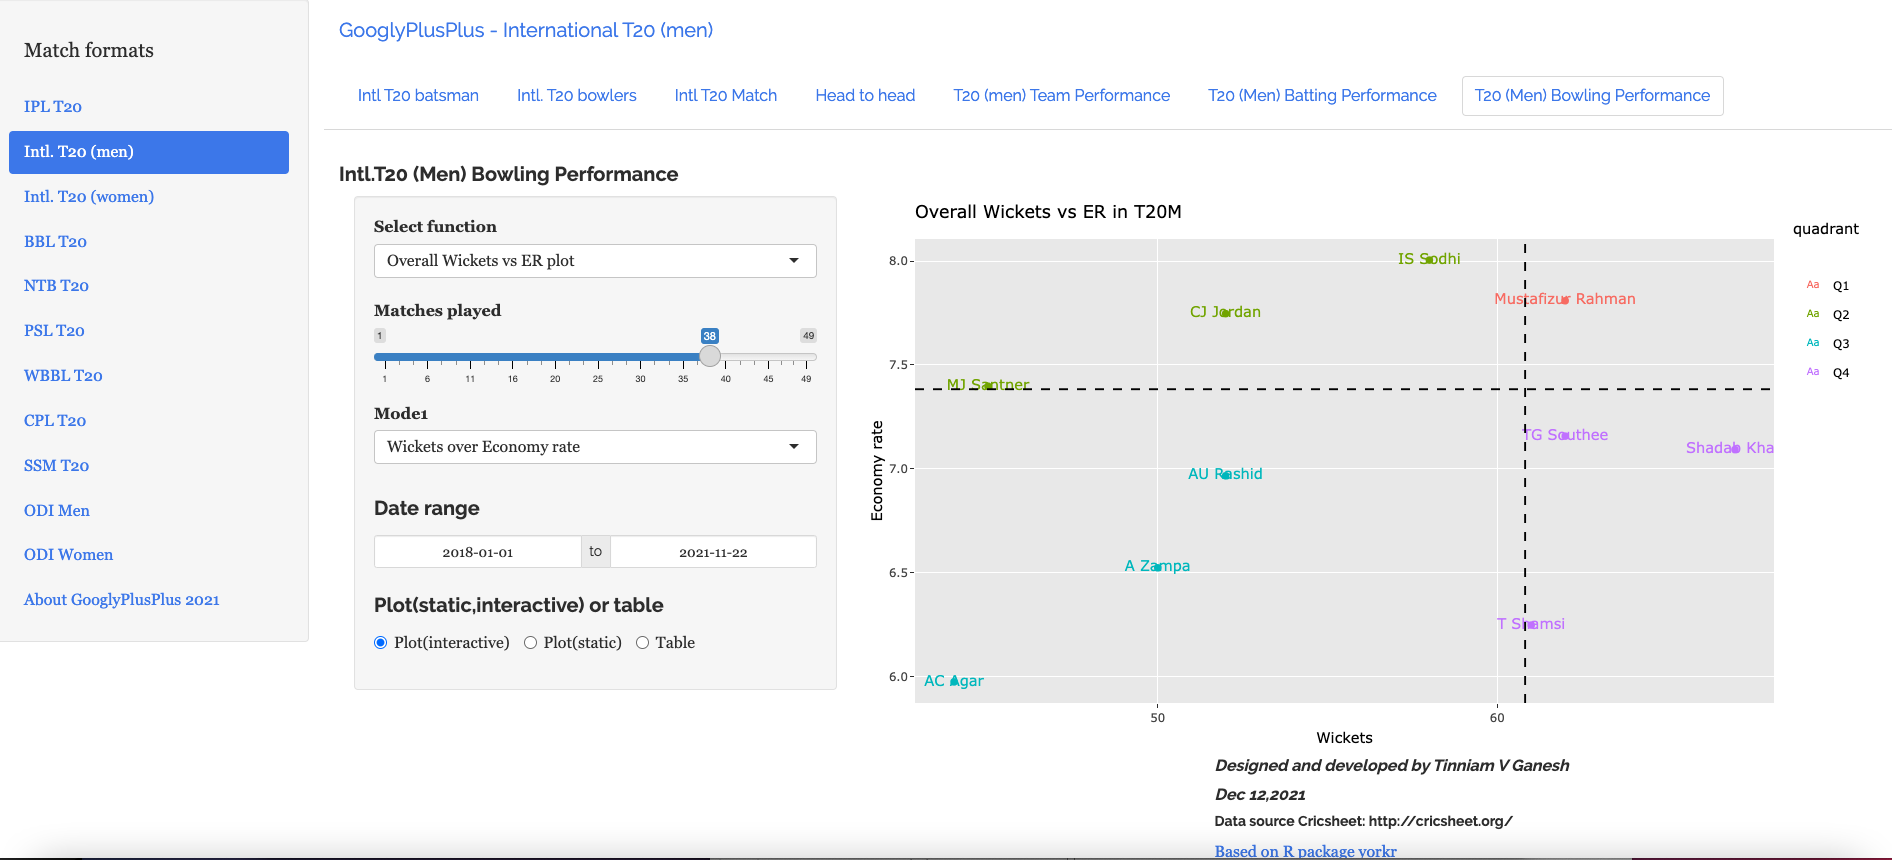
a) Intl. T20 (men) best bowlers in Power Play from 2019 (zoomed in)
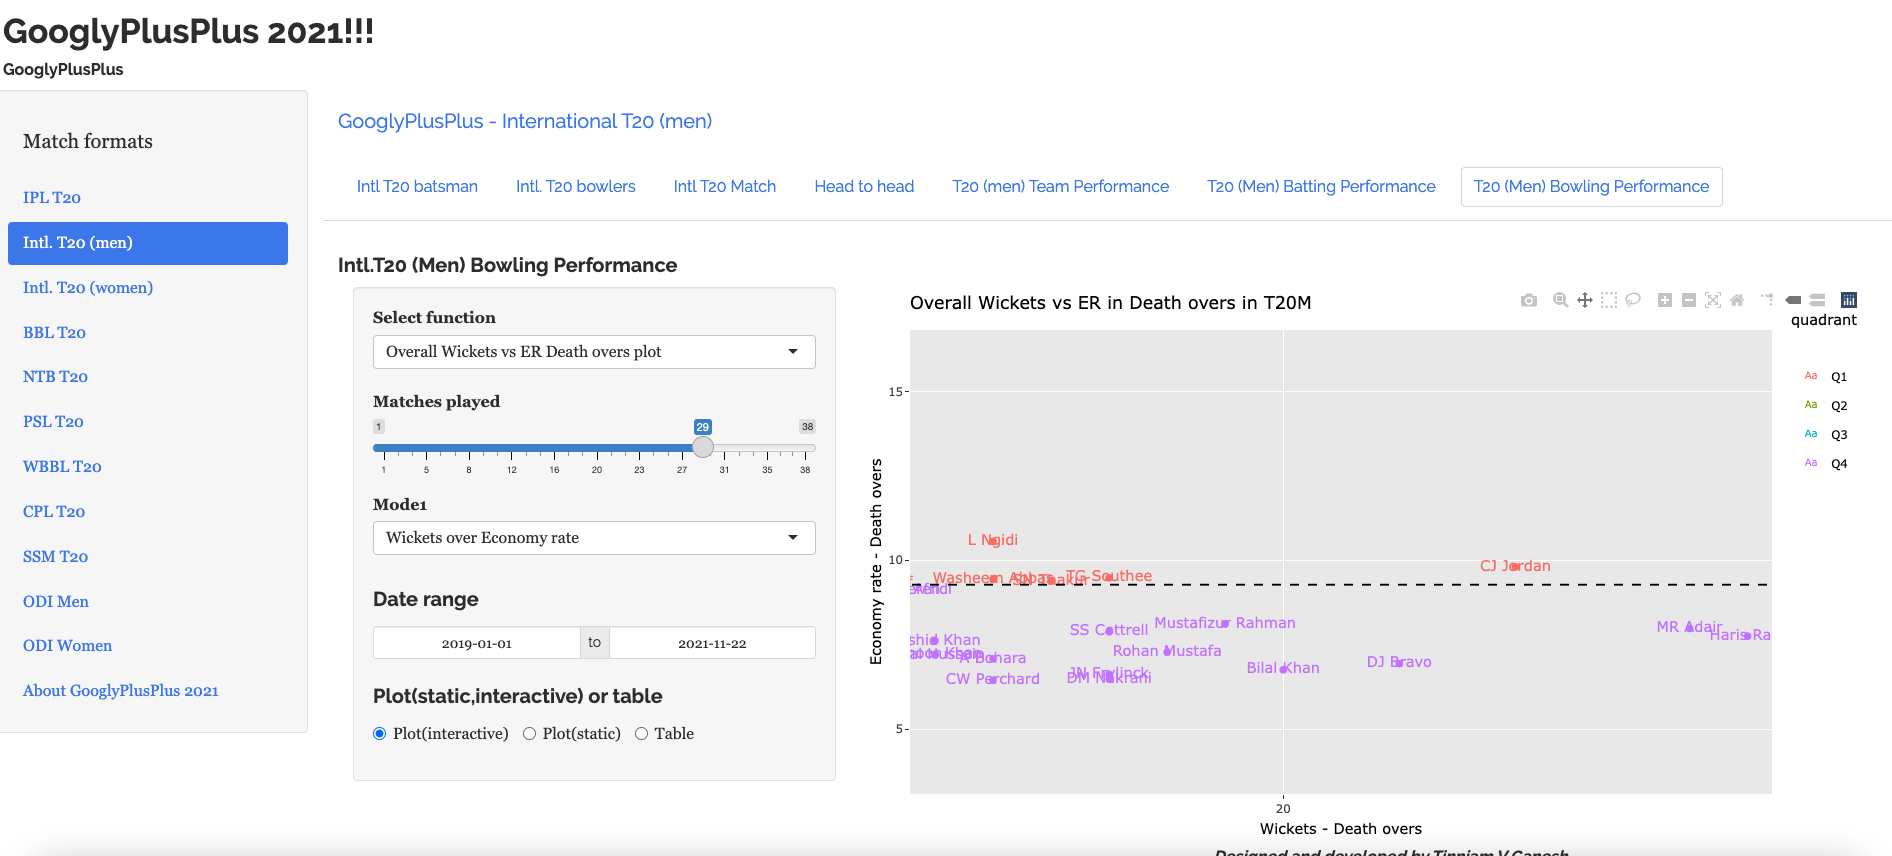
b) Intl. T20(men) best bowlers in Death overs since 2019
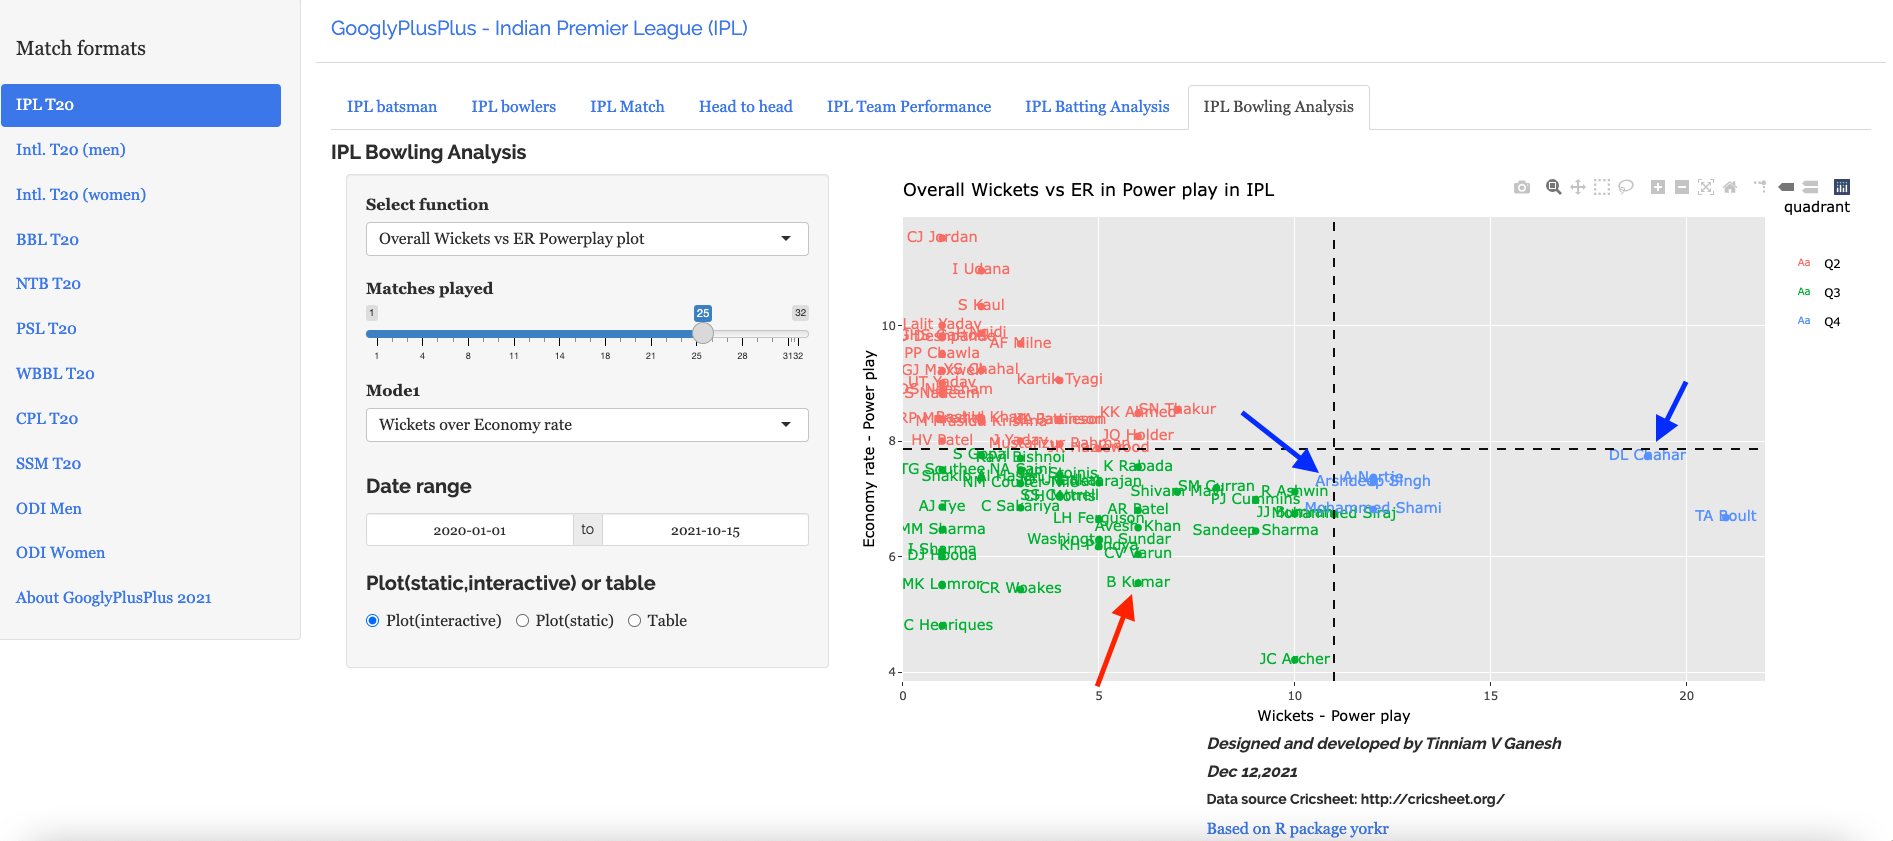
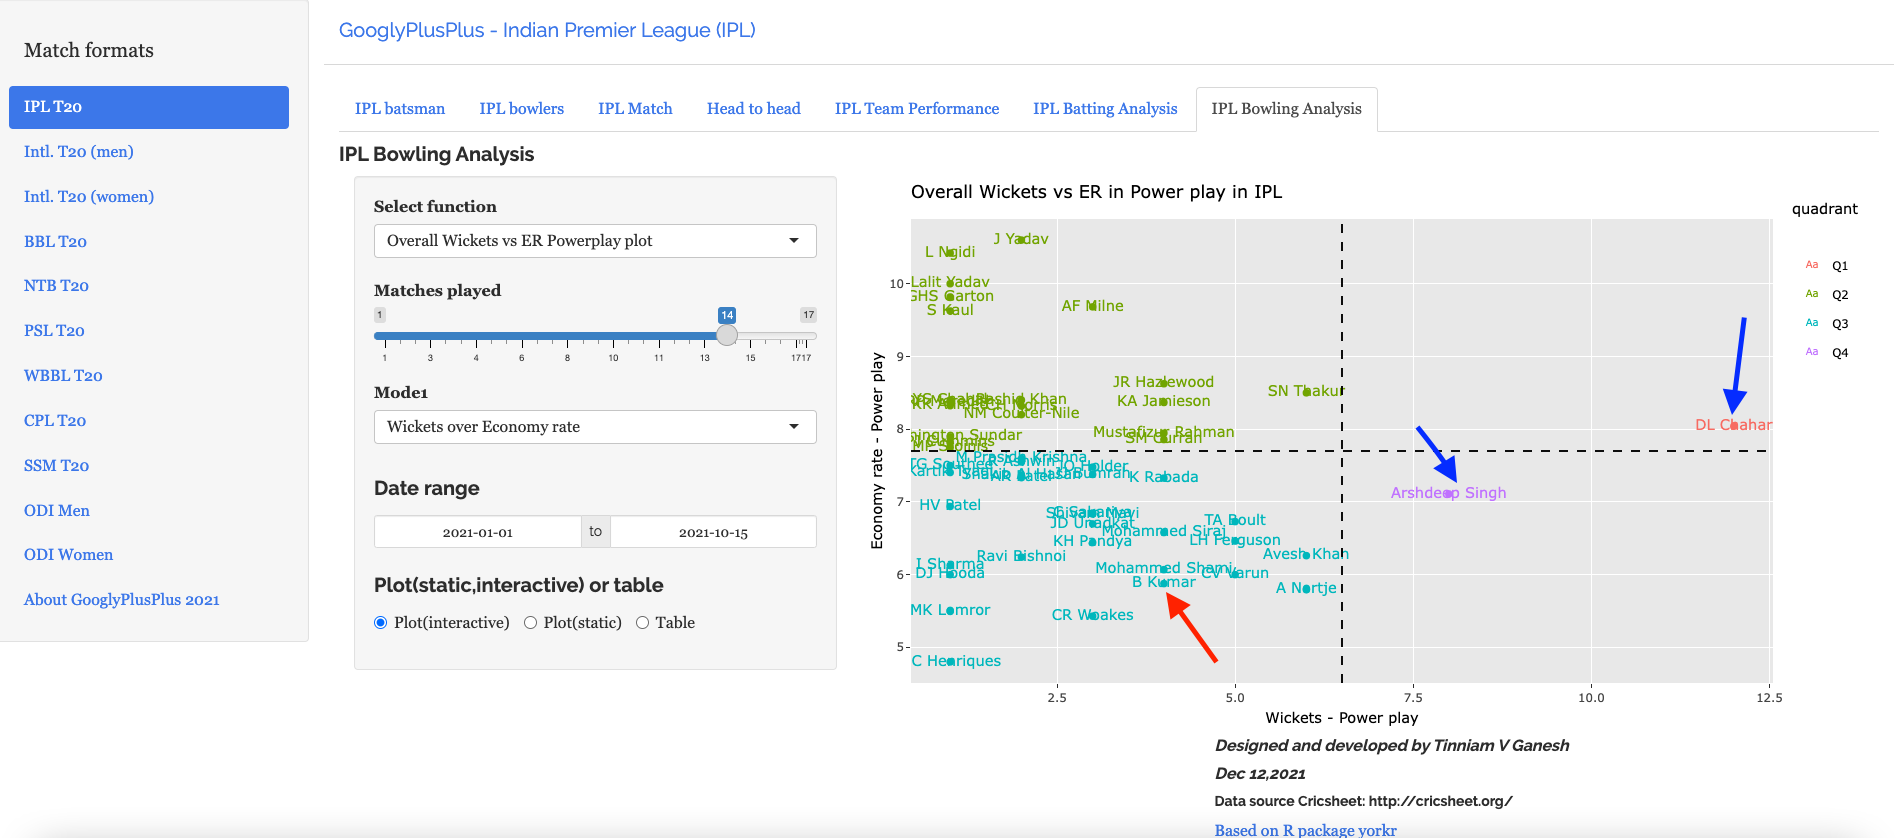
c) Was B. Kumar a good choice for India team in World cup?
Bhuvi was one of India’s best bowler in Power play only if we go back to the beginning of time
i) From 2008
But if we move forward to 2020 onwards we see Arshdeep Singh or D Chahar would have been a better choice
ii) From 2020 onwards
iii) 2021 onwards
Hence D Chahar & Arshdeep Singh are the natural choice moving forwards for India
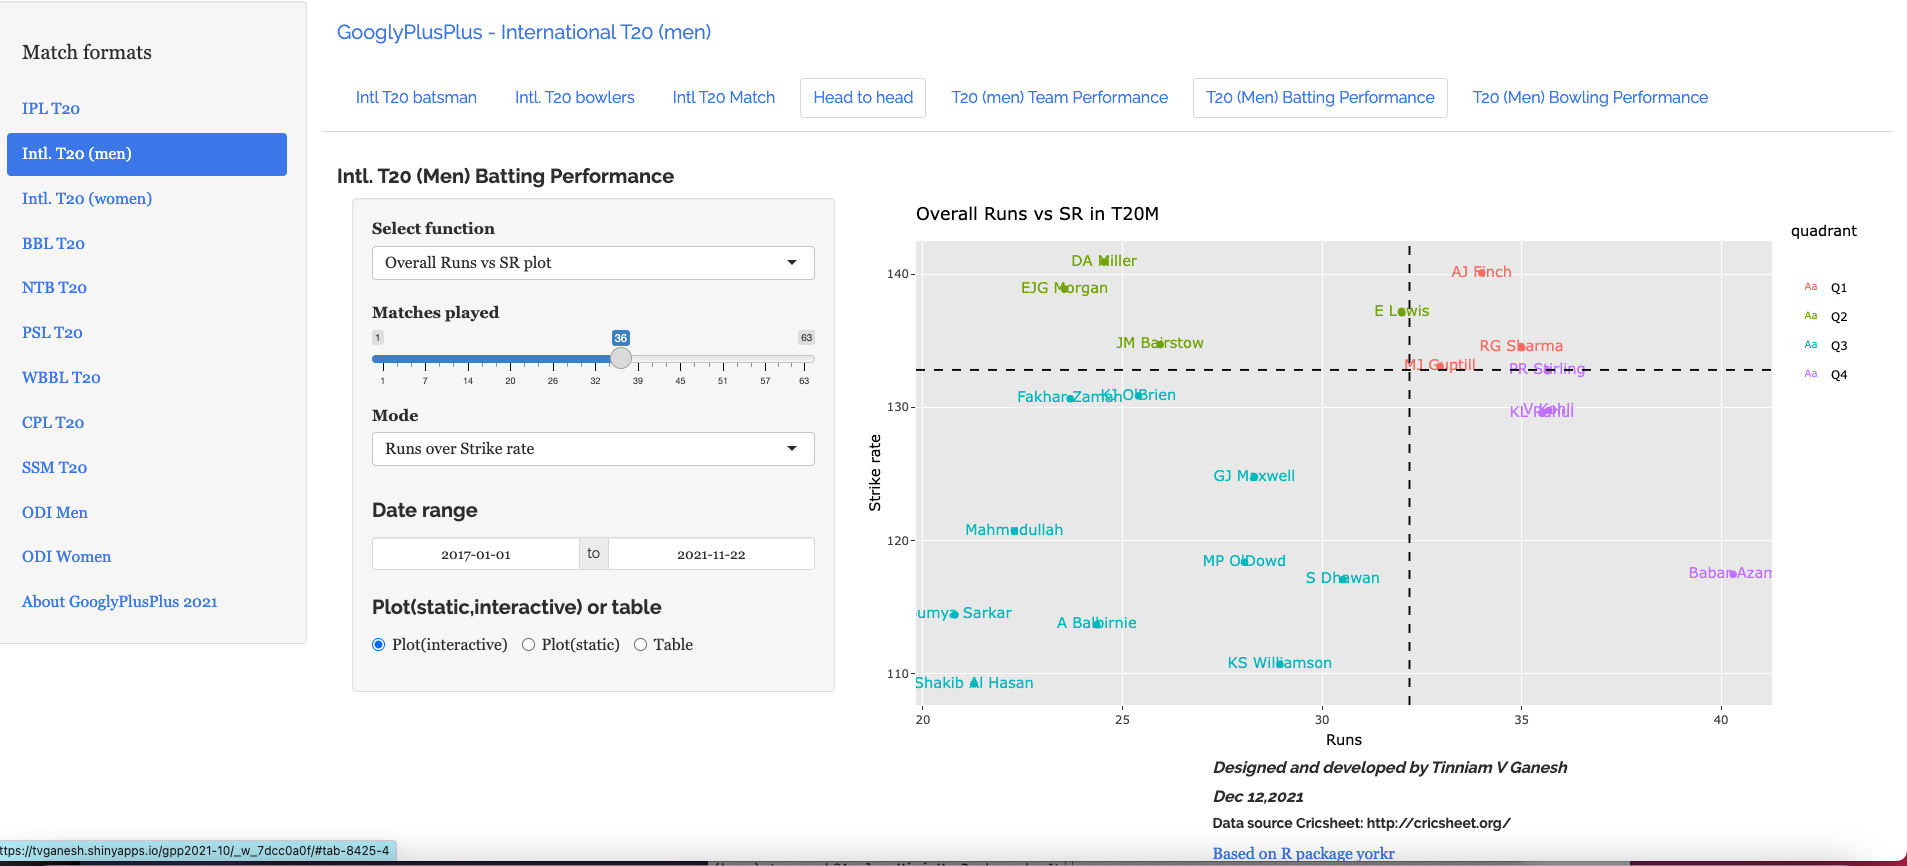
iv) T20 Best batsman
If we look at Intl. T20 performances since 2017, Babar Azam leads the pack, however his Strike rate needs to move up.
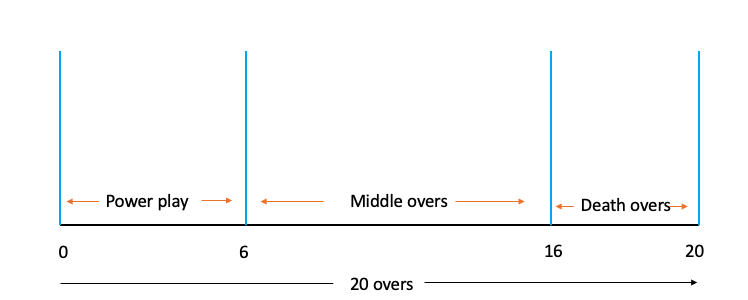
This latest edition of GooglyPlusPlus2021 now includes detailed analysis of teams, batsmen and bowlers in power play, middle and death overs. The T20 format is based on 3 phases as each side faces 20 overs.
Power play: Overs: 0 – 6 – No more than 2 players can be outside the 30 yard circle
Middle overs: Overs: 7- 16 – During these overs the batting side tries to consolidate their innings
Death overs: Overs: 16 -20 – During these 5 overs the batting side tries to accelerate the scoring rate, while the bowling side will try to restrict the batsmen against going for big hits
This is shown below
This latest update of GooglyPlusPlus2021 includes the following functions
a) Match tab
teamRunsAcrossOvers
teamSRAcrossOvers
teamWicketsAcrossOvers
teamERAcrossOvers
matchWormWickets
b) Head-to-head tab
teamRunsAcrossOversOppnAllMatches
teamSRAcrossOversOppnAllMatches
teamWicketsAcrossOversOppnAllMatches
teamERAcrossOversOppnAllMatches
topRunsBatsmenAcrossOversOppnAllMatches
topSRBatsmenAcrossOversOppnAllMatches
topWicketsBowlersAcrossOversOppnAllMatches
topERBowlerAcrossOverOppnAllMatches
c) Overall performance tab
teamRunsAcrossOversAllOppnAllMatches
teamSRAcrossOversAllOppnAllMatches
teamWicketsAcrossOversAllOppnAllMatches
teamERAcrossOversAllOppnAllMatches
topRunsBatsmenAcrossOversAllOppnAllMatches
topSRBatsmenAcrossOversAllOppnAllMatches
topWicketsBowlersAcrossOversAllOppnAllMatches
topERBowlerAcrossOverAllOppnAllMatches
Hence a total of 8 + 8 + 5 = 21 functions have been added. These functions can be utilized across all the 9 T20 formats that are supported in GooglyPlusPlus2021 namely
You can clone/fork the code for the Shiny app from Github – gpp2021-9
Included below is a random selection of options from the 189 possibilities mentioned above. Feel free to try out for yourself
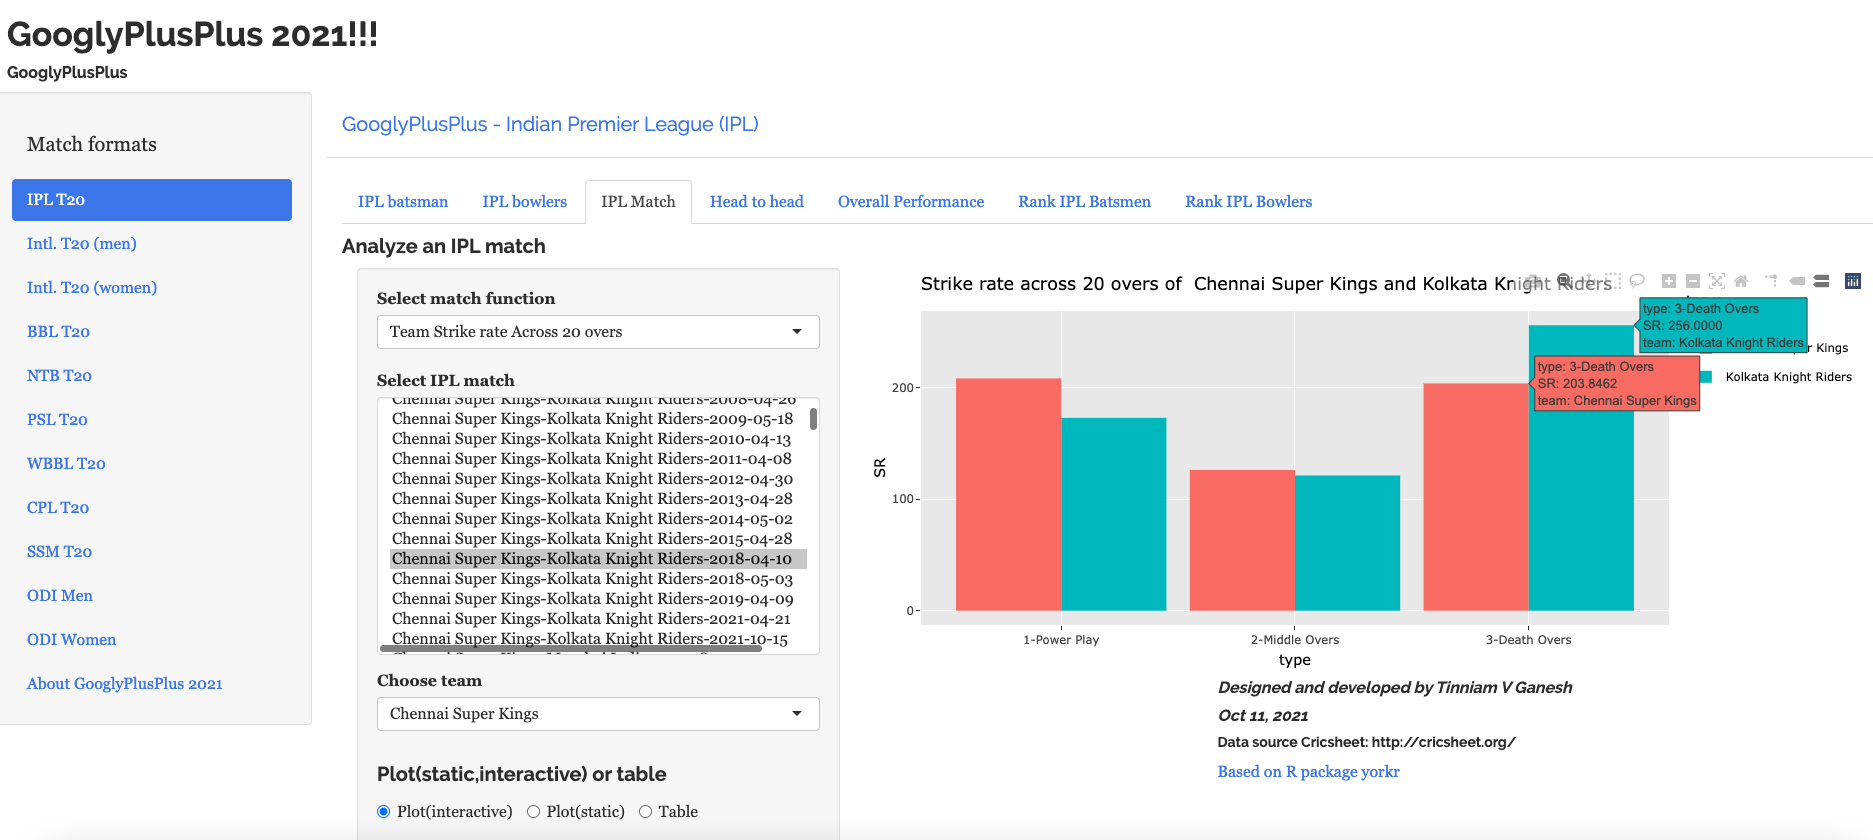
A) IPL – CSK vs KKR 2018-04-10
a) Team Runs in power play, middle and death overs
b) Team Strike rate in power play, middle and death overs
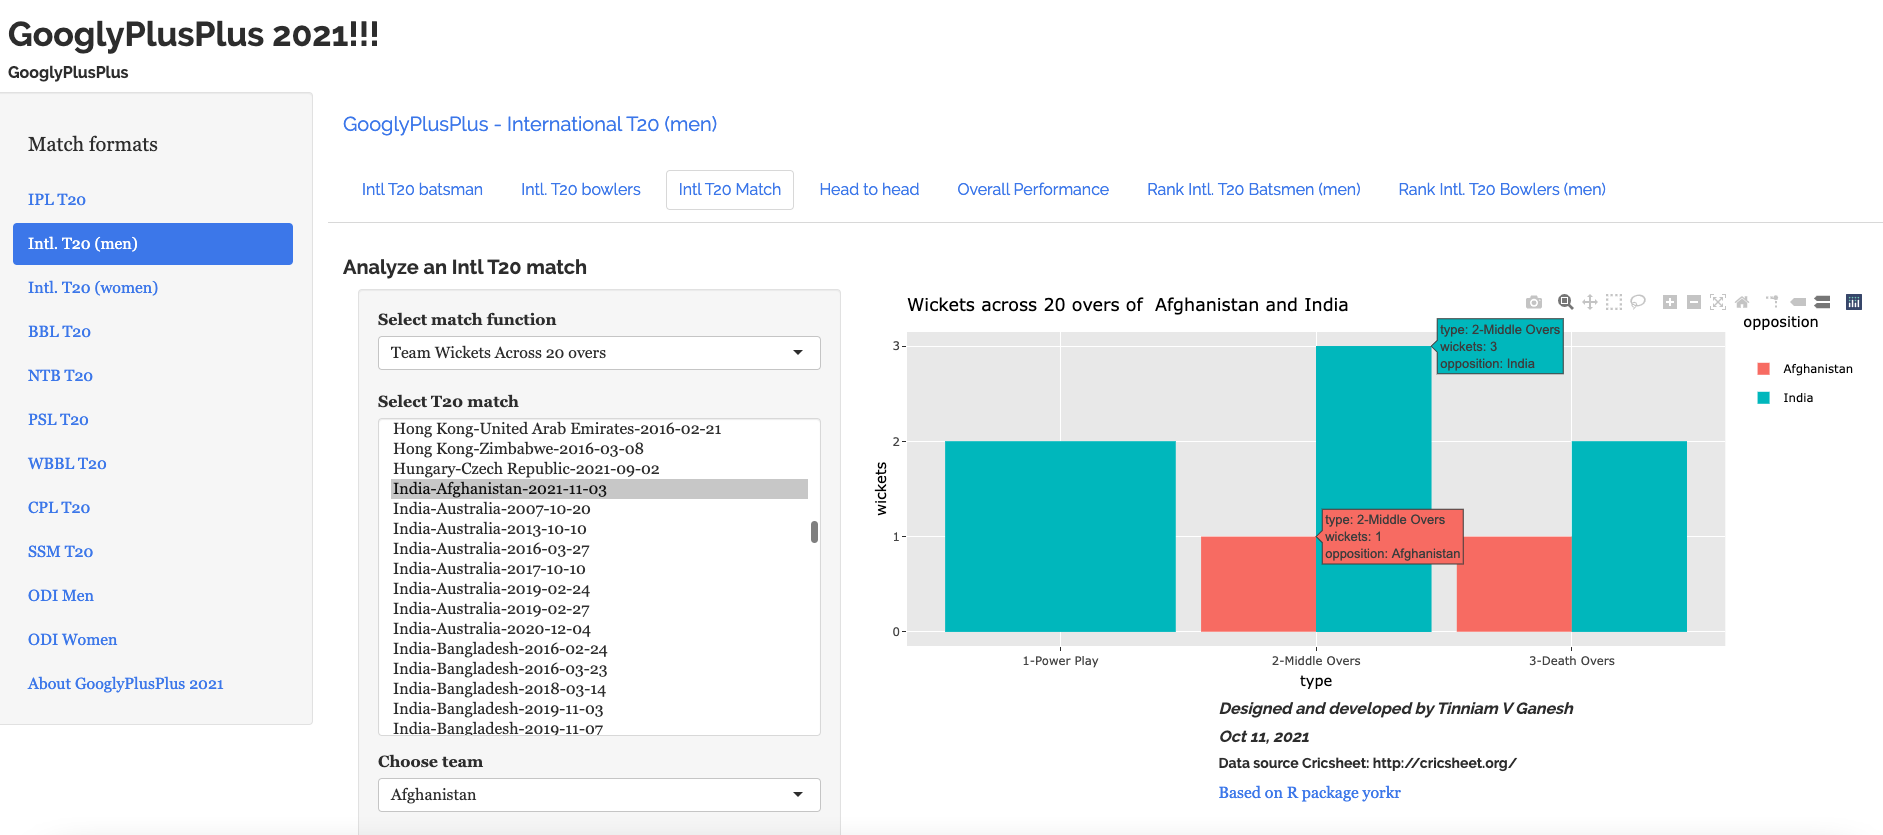
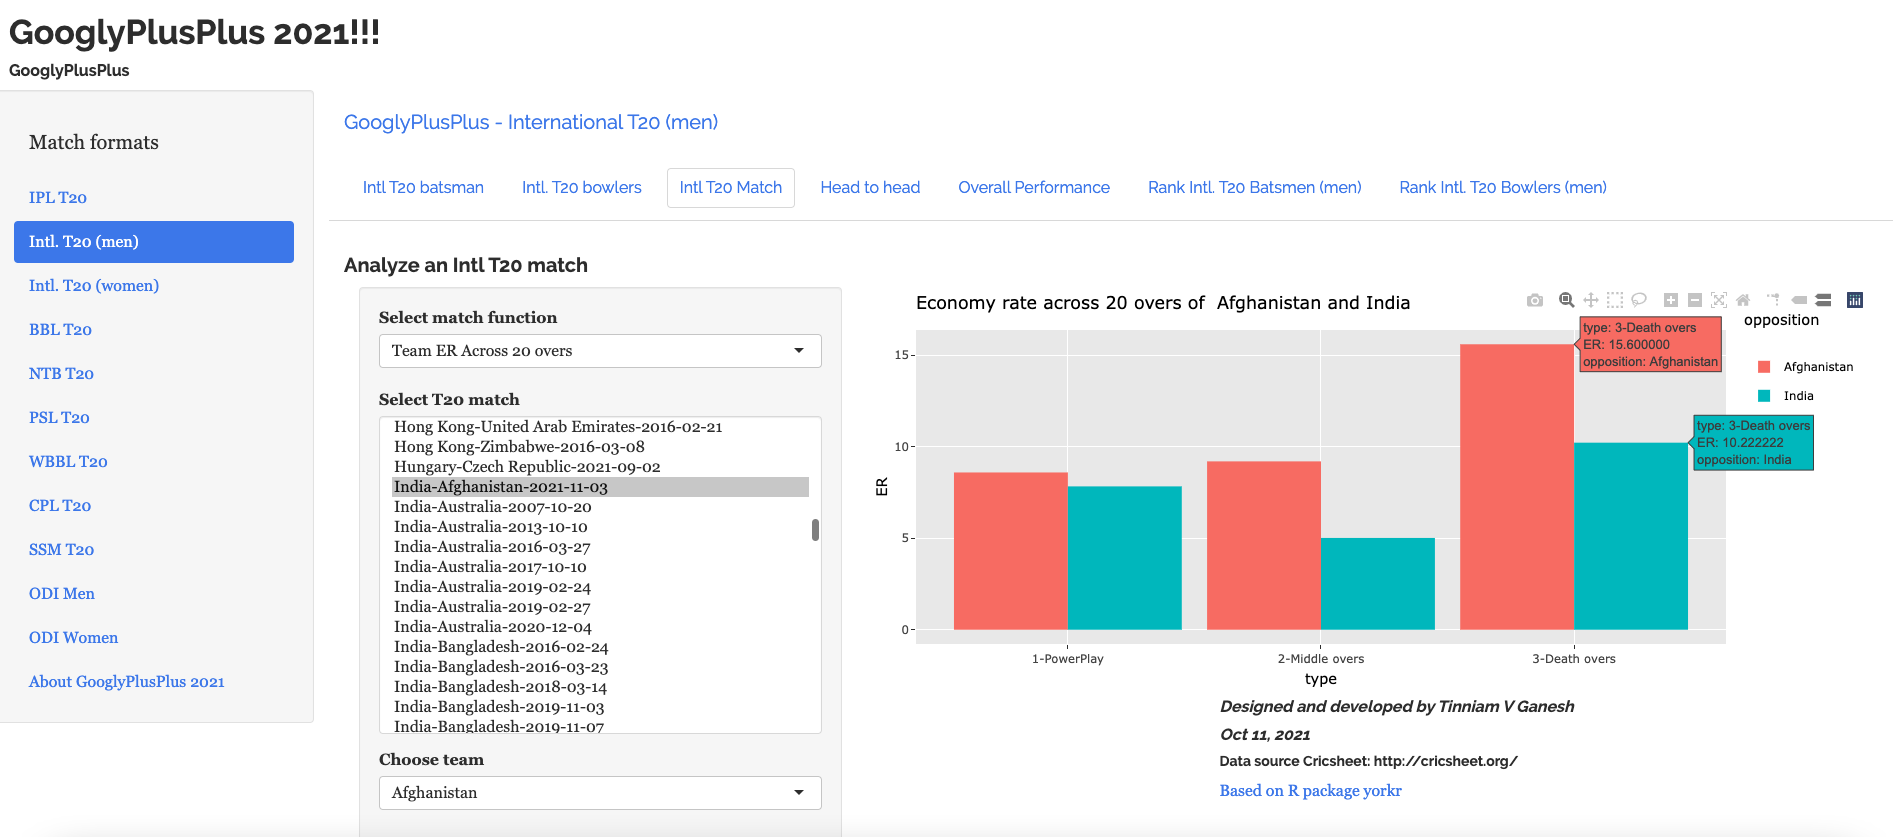
B) Intl. T20 (men) – India vs Afghanistan (2021-11-03)
a) Team wickets in power play, middle and death overs
b) Team Economy rate in power play, middle and death overs
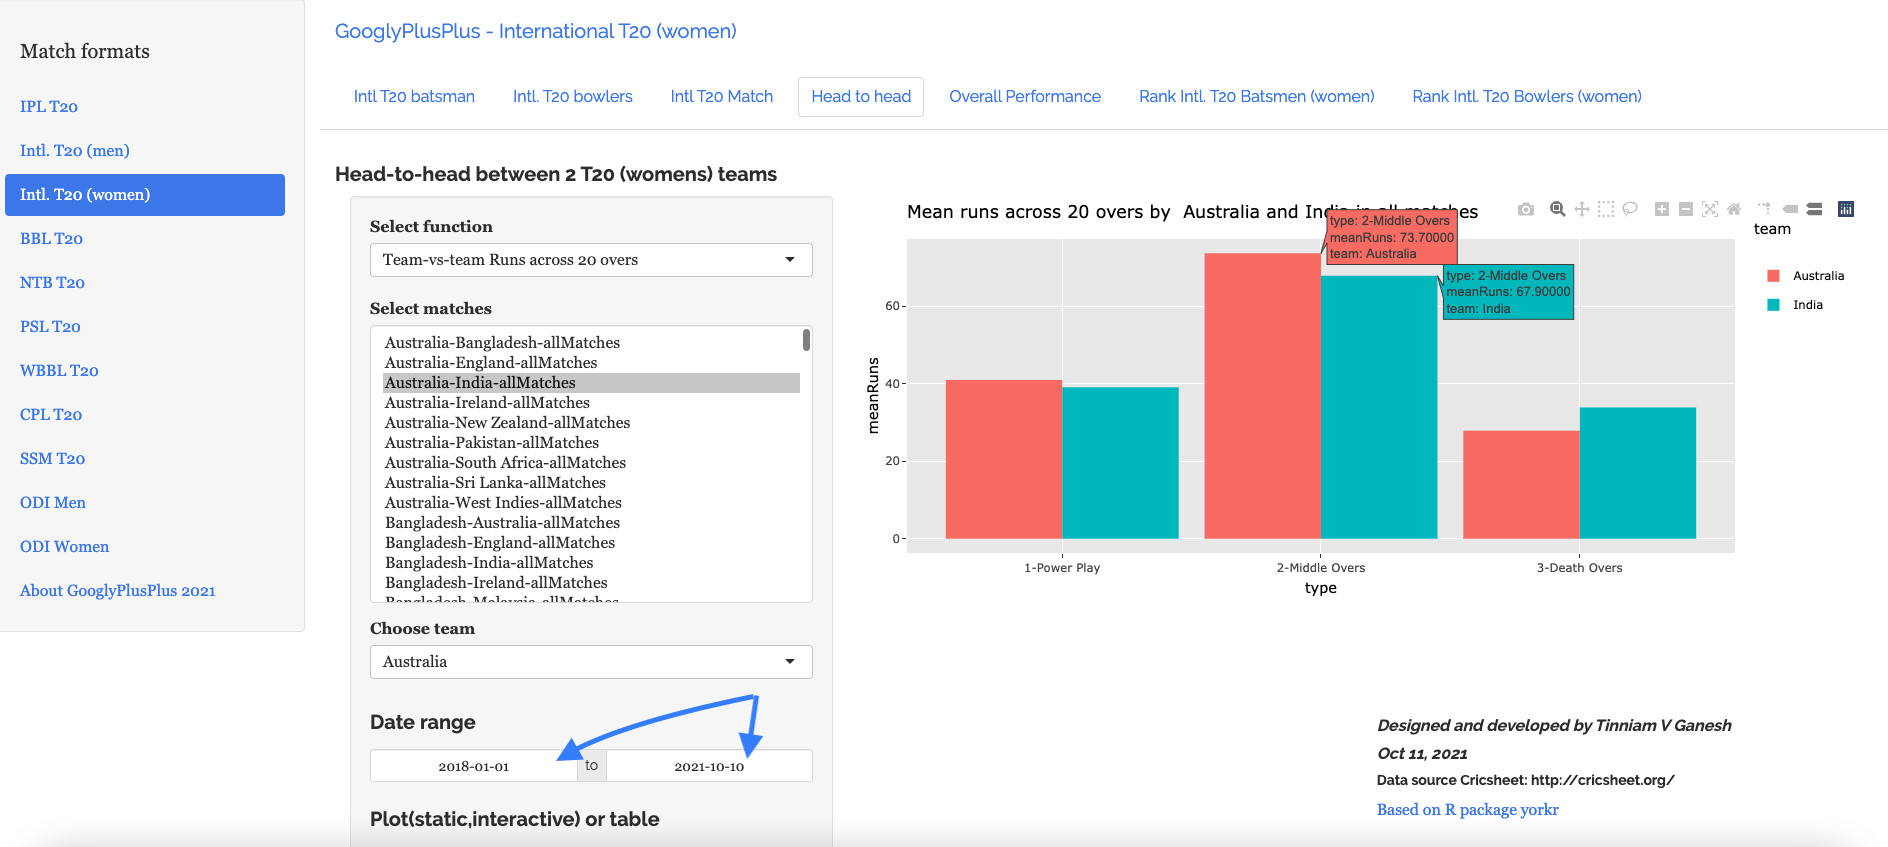
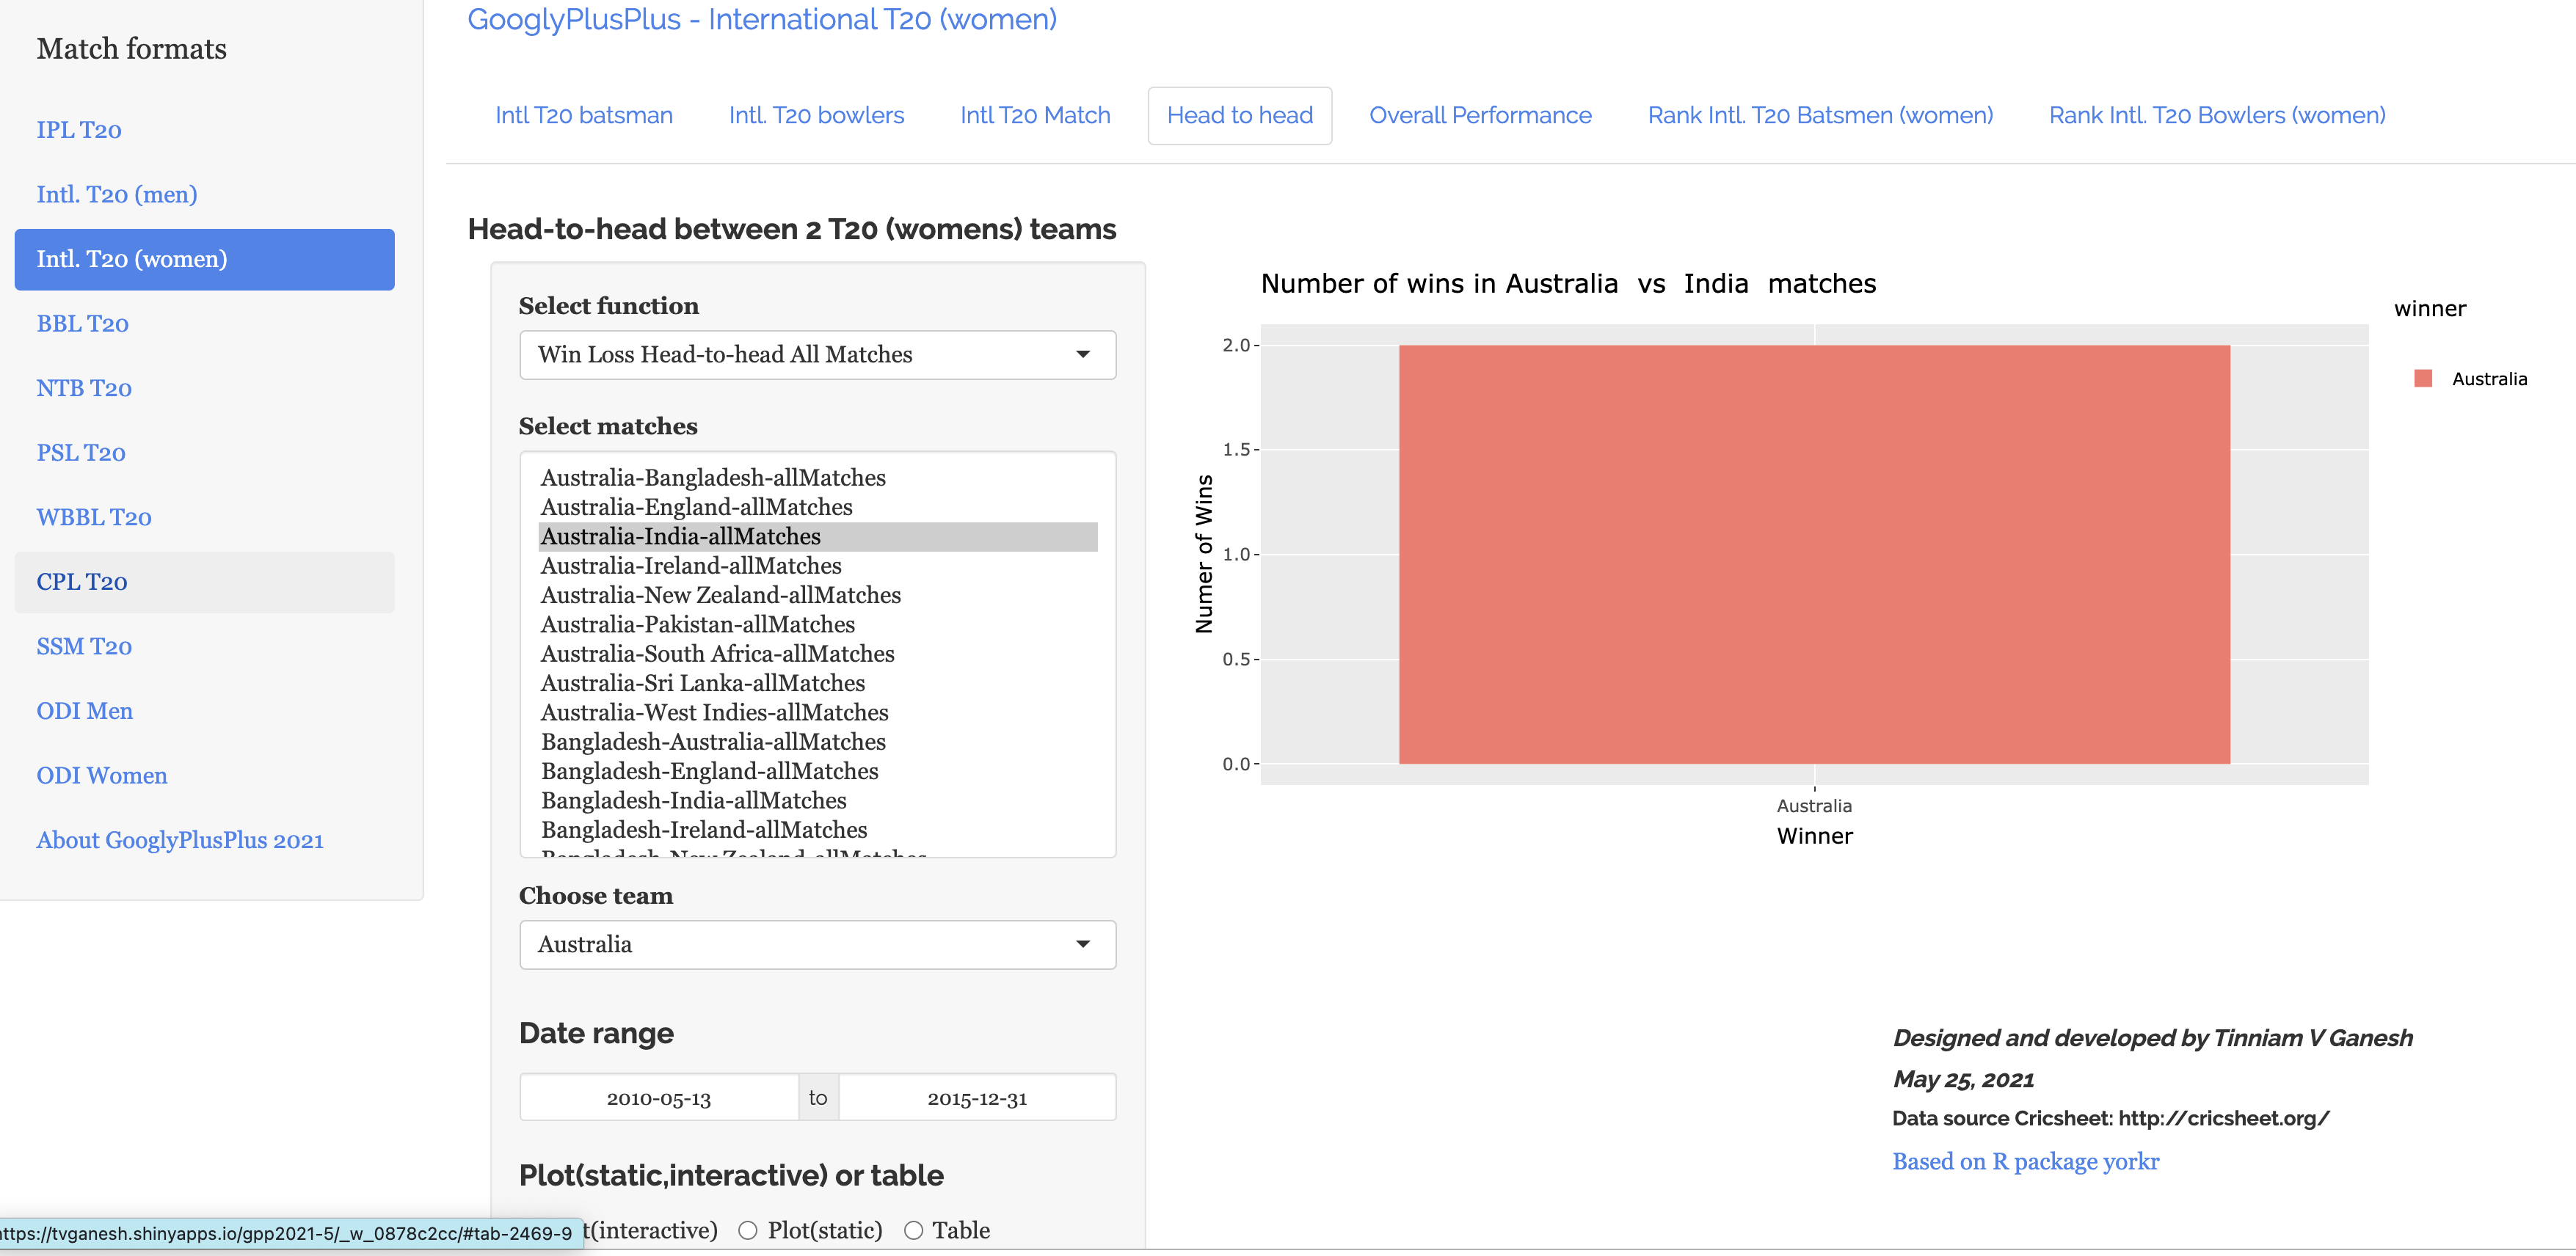
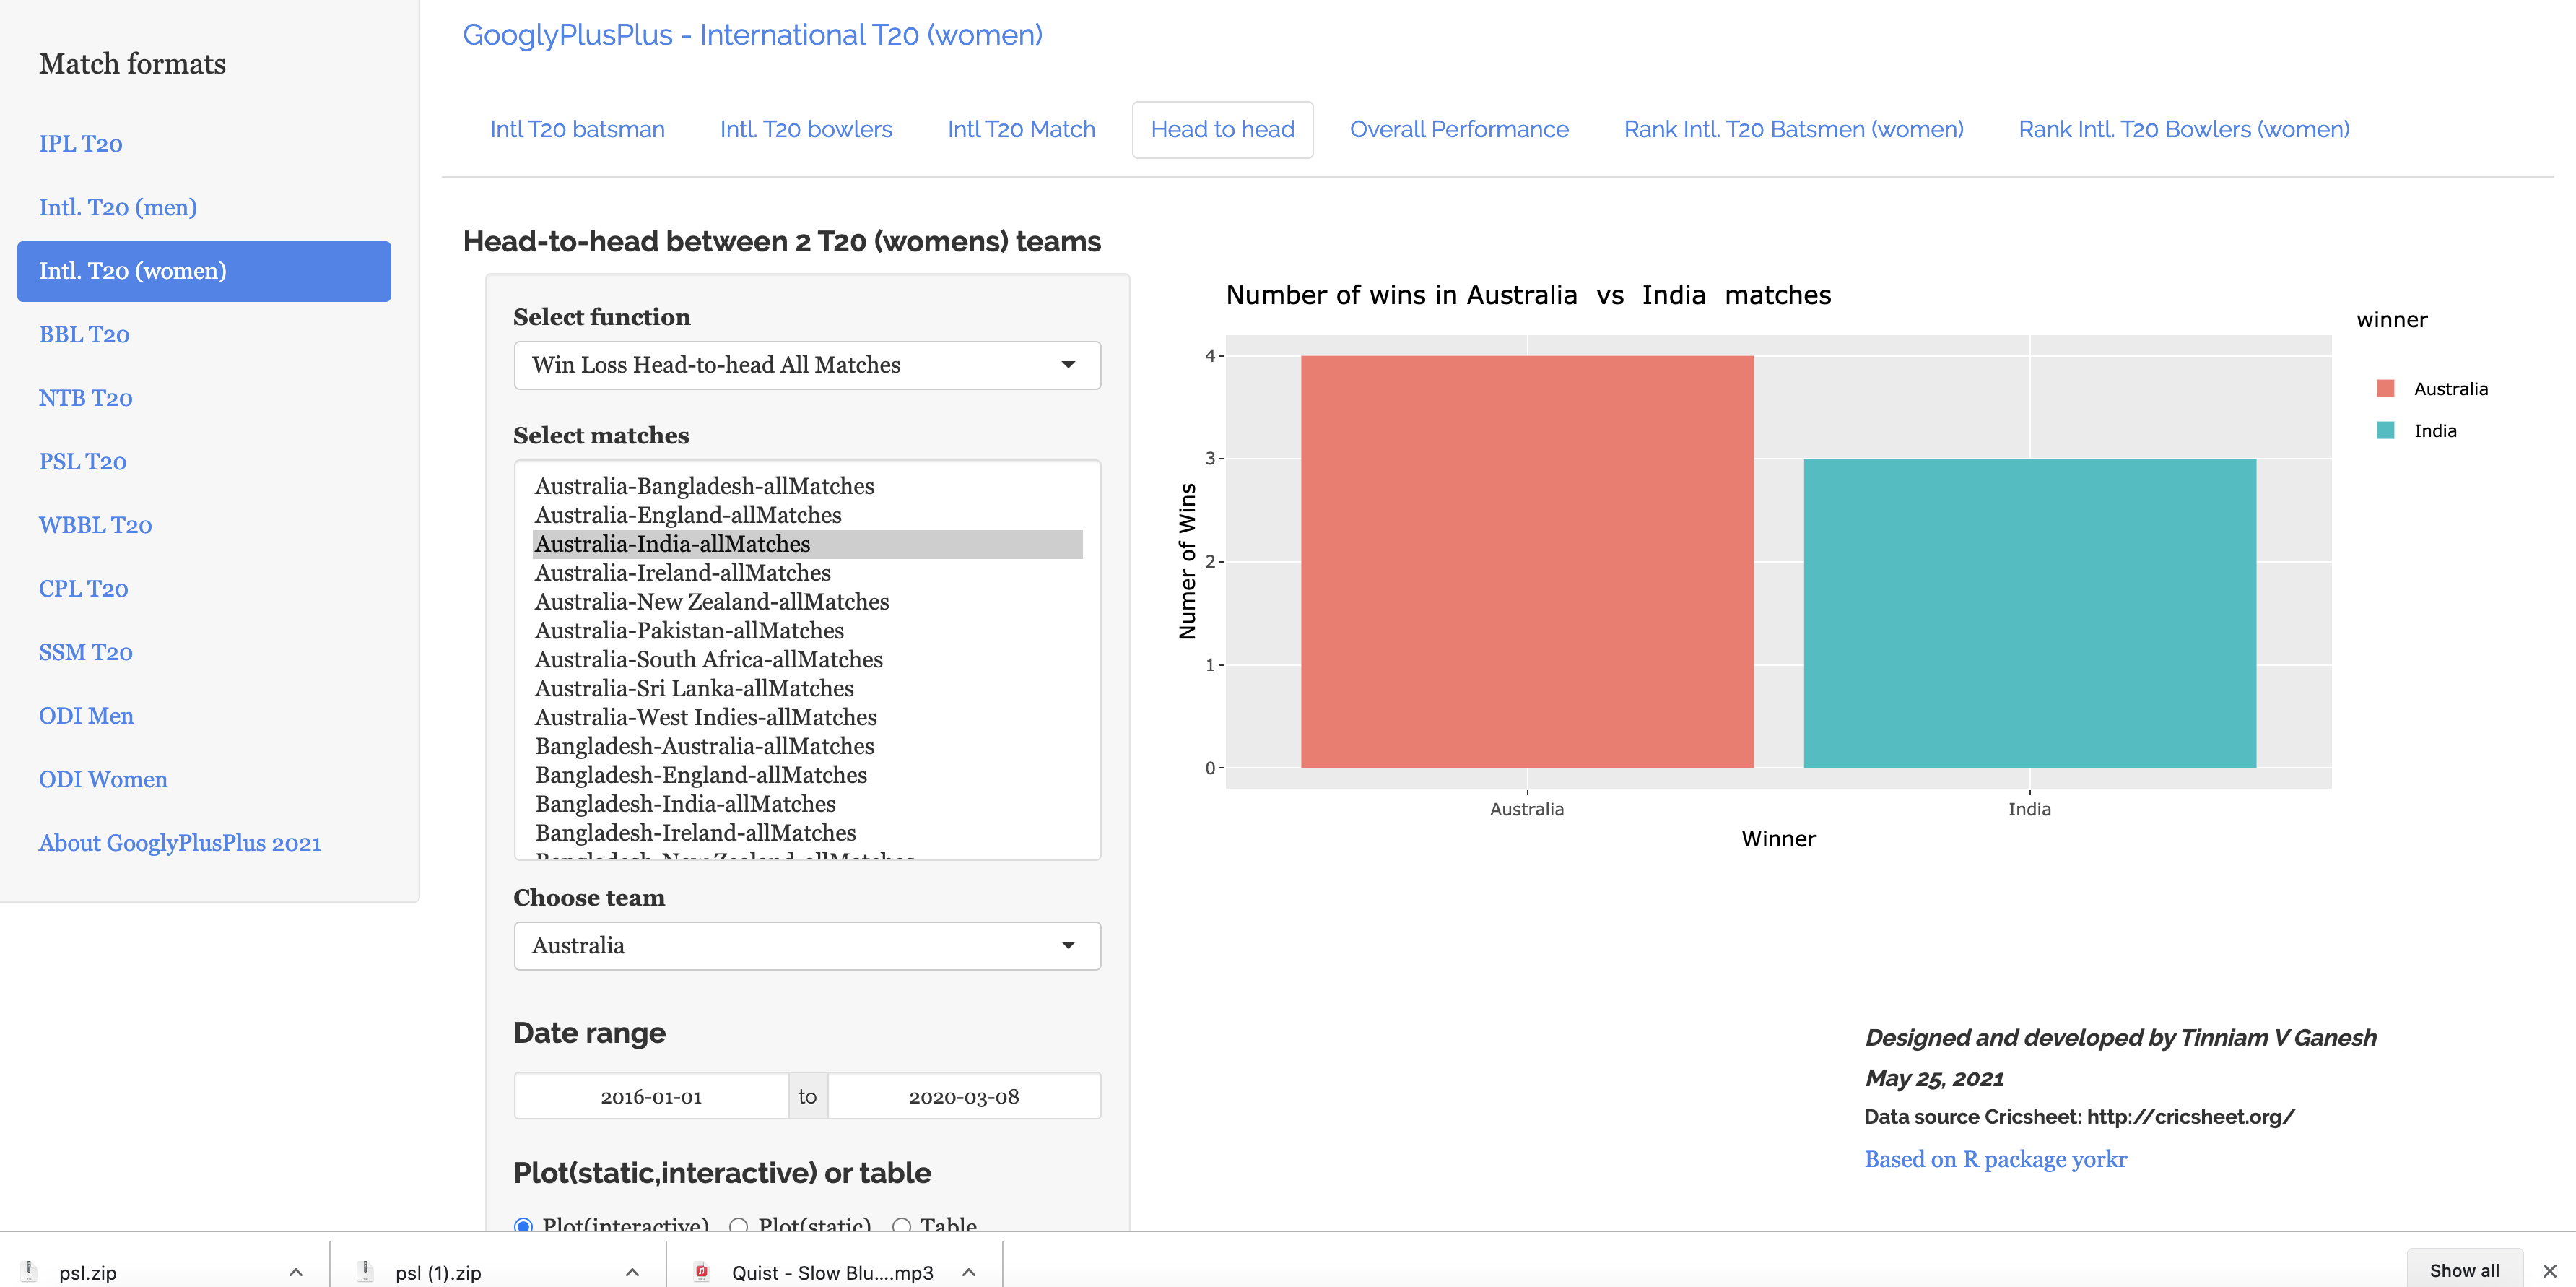
C) Intl. T20 (women) Head-to-head : India vs Australia since 2018
a) Team Runs in all matches in power play, middle and death overs
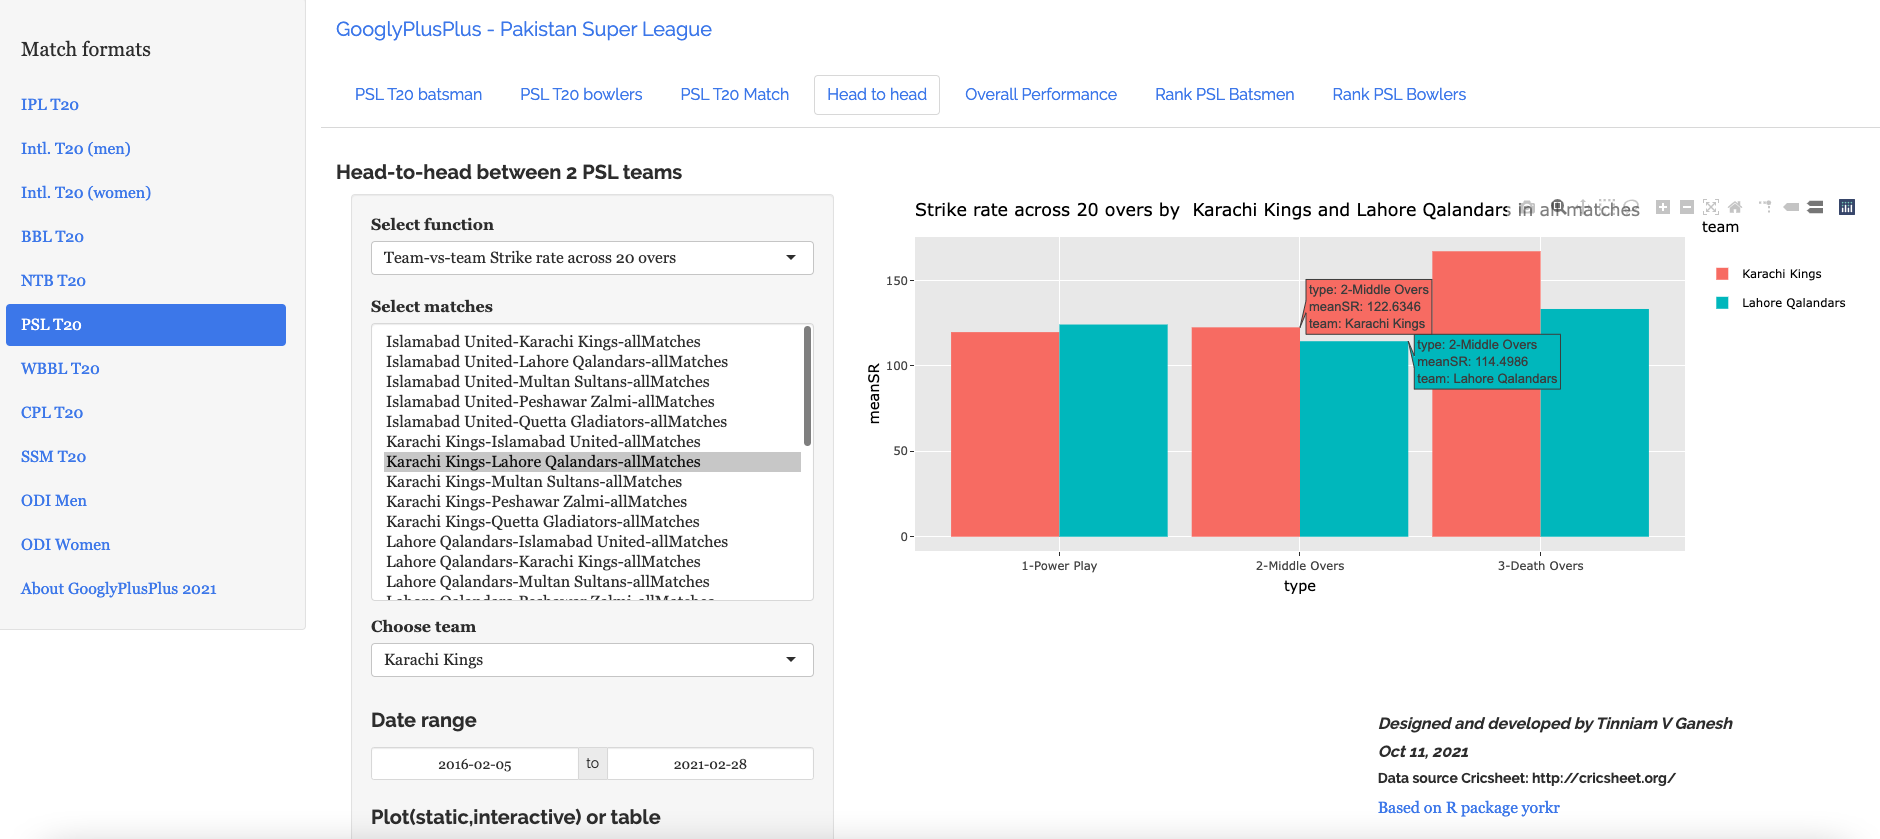
D) PSL Head-to-head strike rate since 2019
a) Team vs team Strike rate : Karachi Kings vs Lahore Qalanders since 2019 in power play, middle and death overs
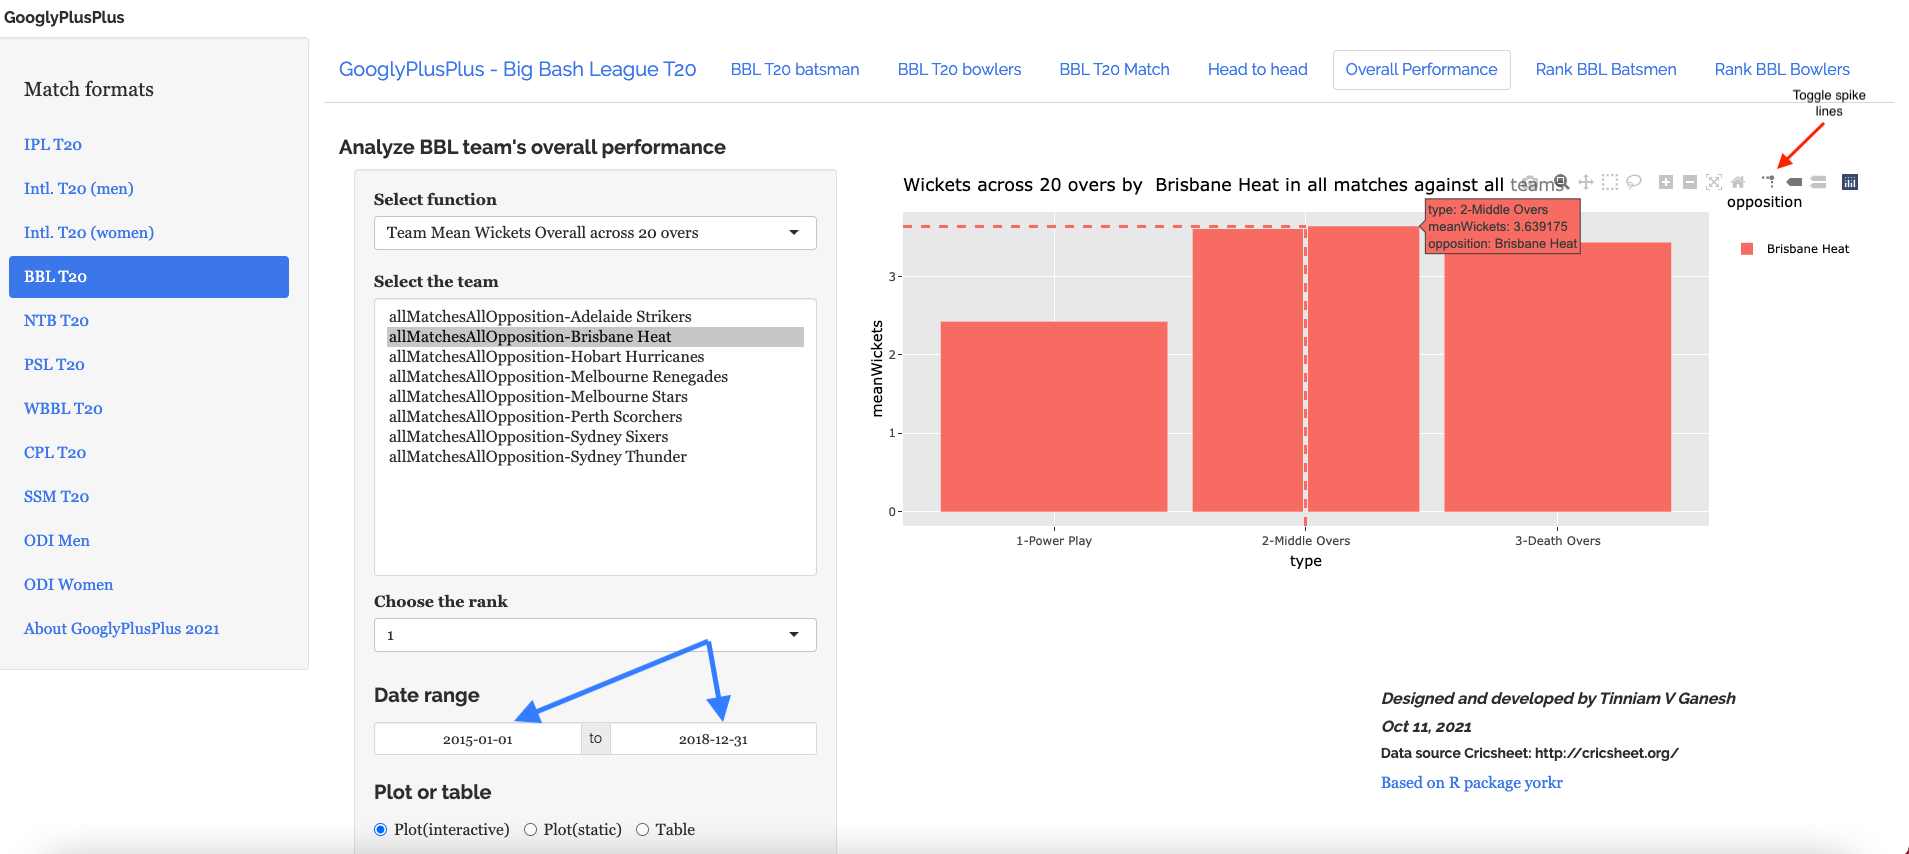
E) Team overall performance in all matches against all opposition
a) BBL : Brisbane Heats : Team Wickets between 2015 – 2018 in power play, middle and death overs
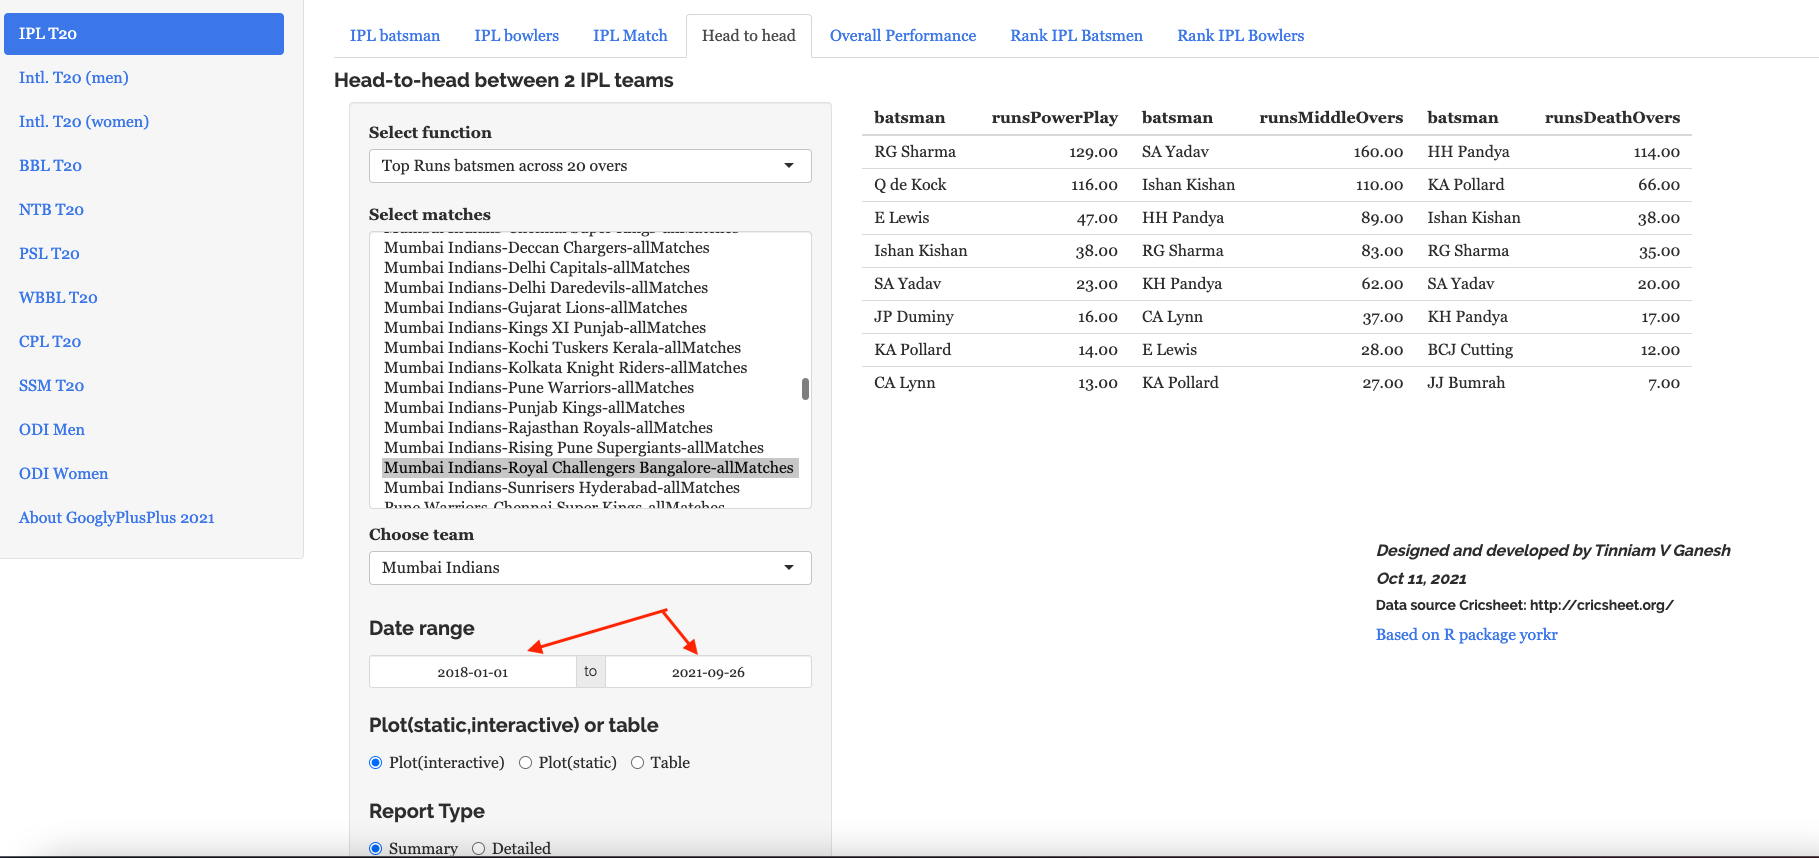
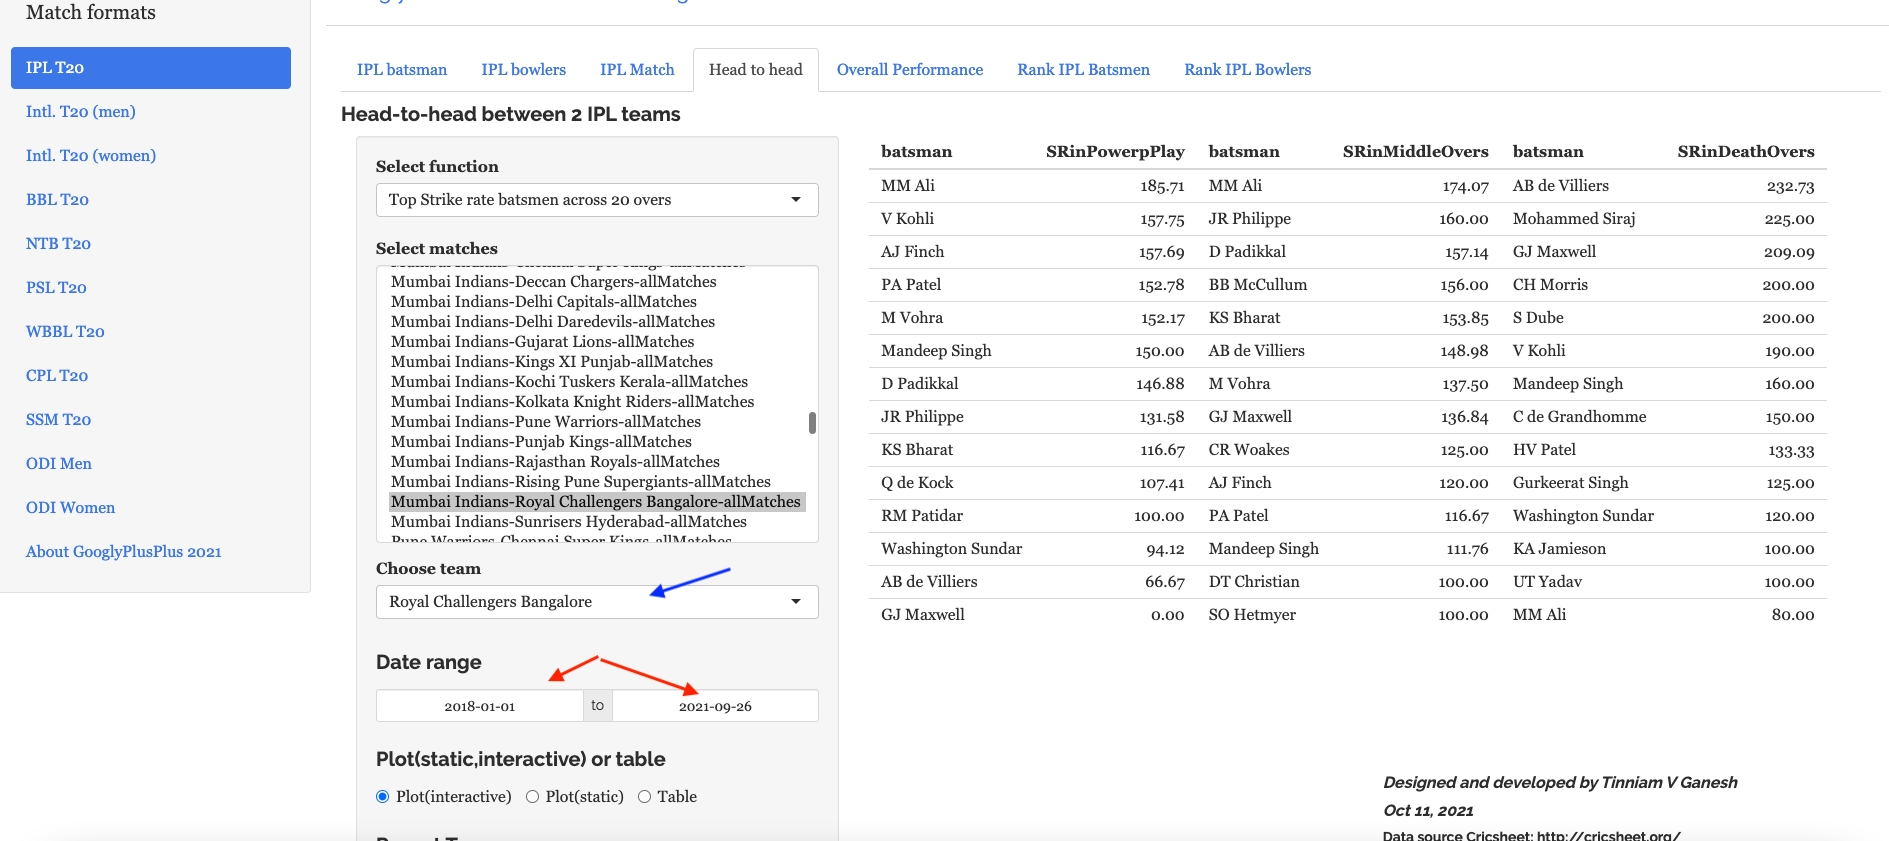
F) Top Runs and Strike rate Batsman of Mumbai Indians vs Royal Challengers Bangalore since 2018
a) Top runs scorers for Mumbai Indians (MI) in power play, middle and death overs
b) Top strike rate for RCB in power play, middle and death overs
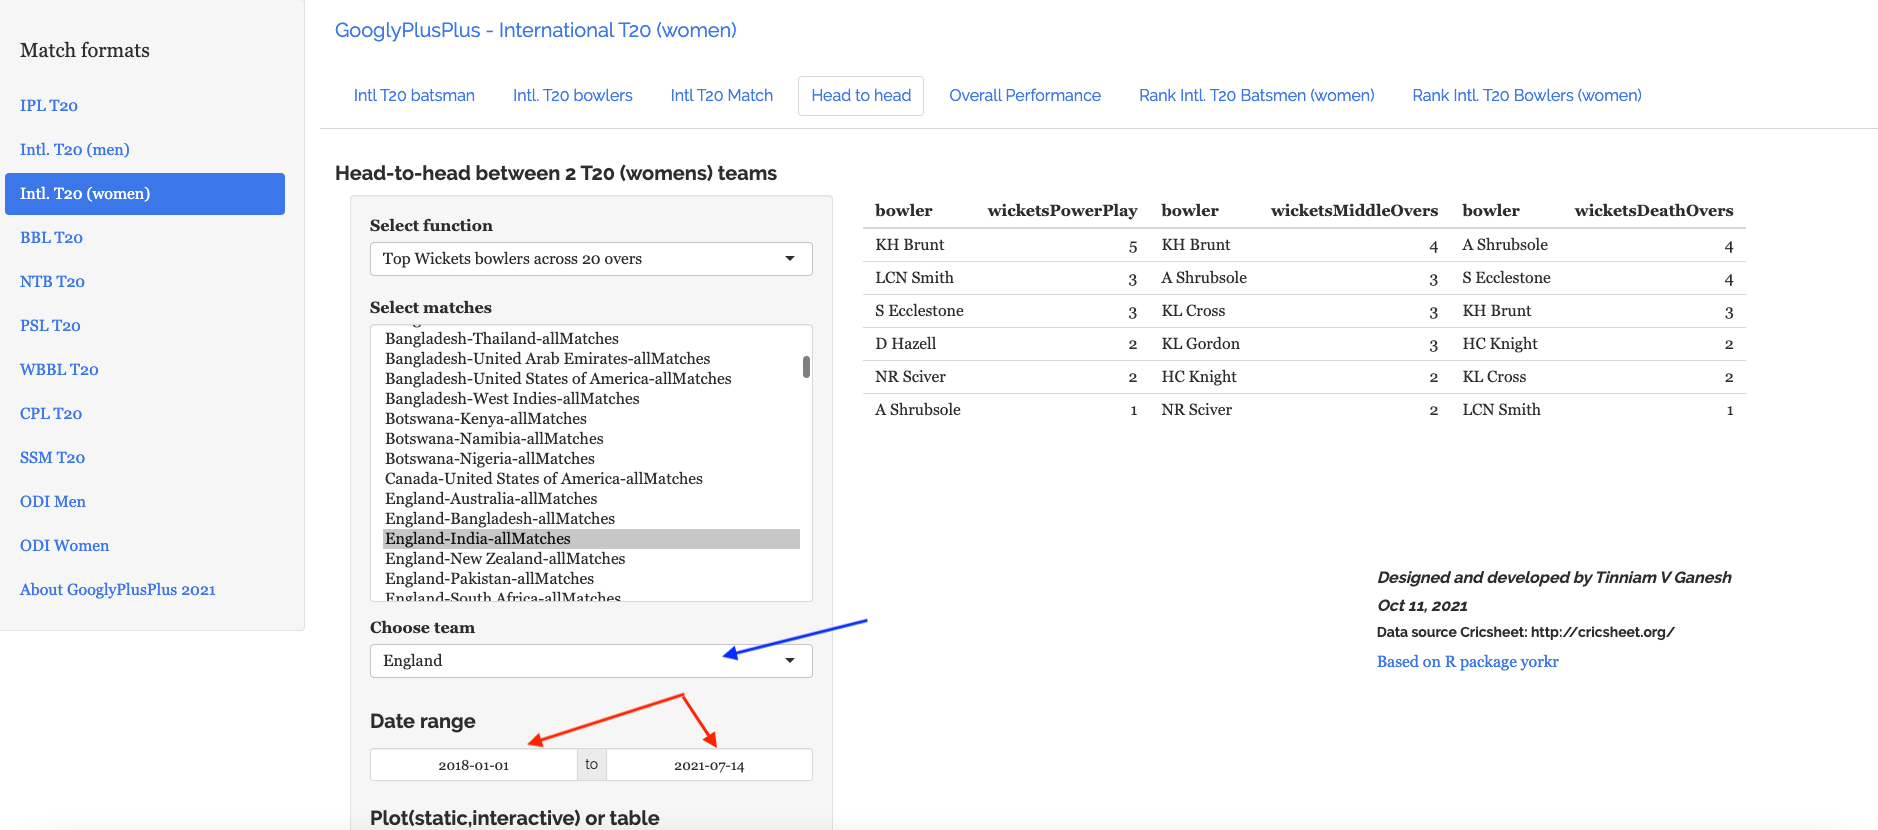
F) Intl. T20 (women) India vs England since 2018
a) Top wicket takers for England in power play, middle and death overs since 2018
b) Top wicket takers for India in power play, middle and death overs since 2018
G) Intl. T20 (men) All time best batsmen and bowlers for India
a) Most runs in power play, middle and death overs
b) Highest strike rate in power play, middle and death overs
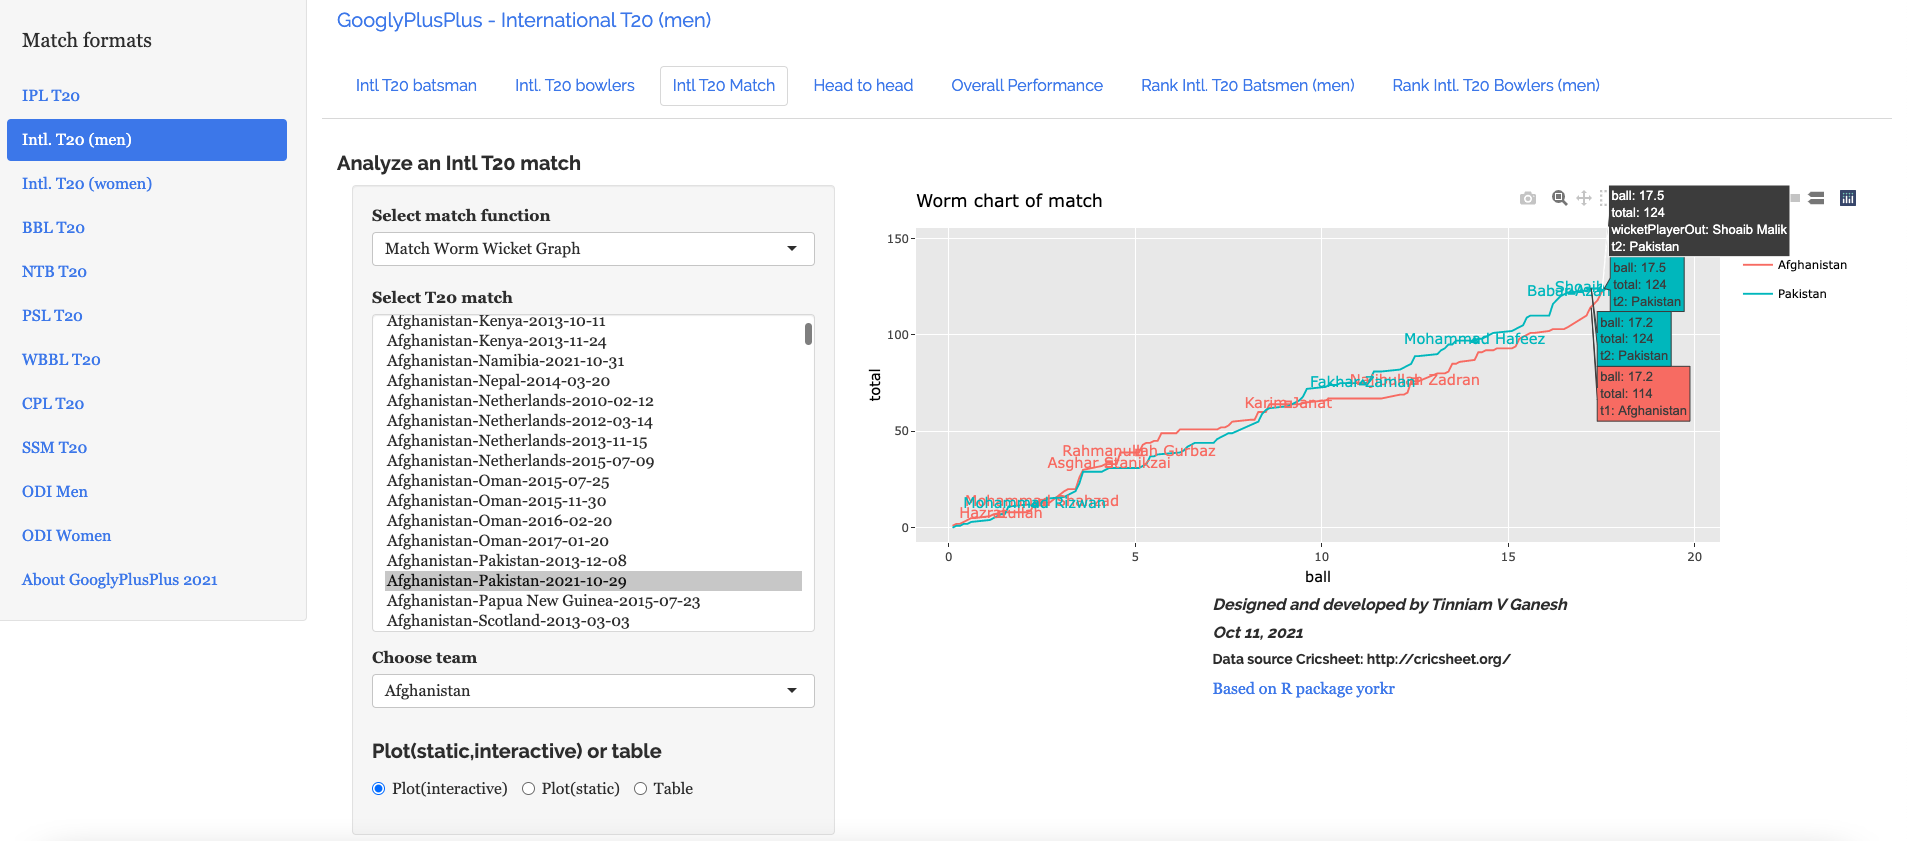
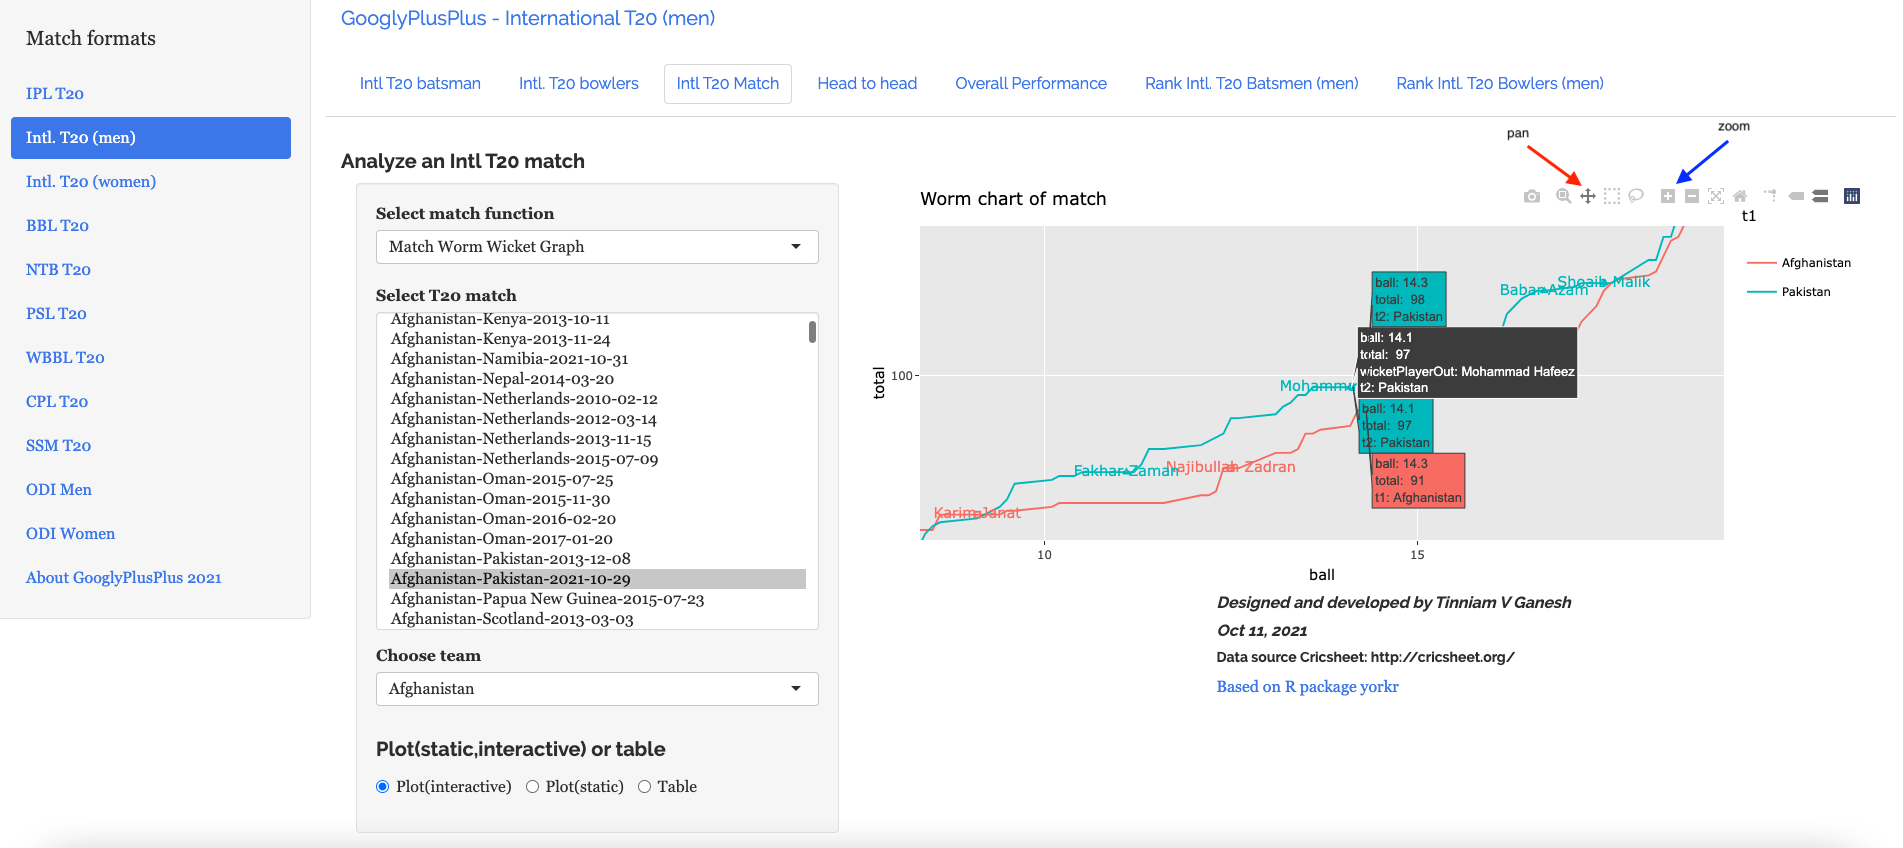
H) Match worm wicket chart
In addition to the usual Match worm chart, I have also added a Match Wicket worm chart in the latest version
Note: You can zoom to the area where you would like to focus more
The option of looking at the Match worm chart (without wickets) also exists.
Go ahead take GooglyPlusPlus2021 for a test drive and check out how your favourite players perform in power play, middle and death overs. Click GooglyPlusPlus2021
You can fork/download the app code from Github at gpp2021-9
This year 2021, we are witnessing a rare spectacle in the cricketing universe, where IPL playoffs are immediately followed by ICC World Cup T20. Cricket pundits have claimed such a phenomenon occurs once in 127 years! Jokes apart, the World cup T20 is underway and as usual GooglyPlusPlus is ready for the action.
GooglyPlusPlus will provide near-real time analytics, by automatically downloading the latest match data daily, processing and organising the match data into appropriate folders so that my R package yorkr can slice and dice the data to provide the pavilion-view analytics.
The charts capture all the breathless, heart-pounding, and nail-biting action in great details in the many tables and plots. Every table and chart tell a story. You just have to ‘read between the lines!’
GooglyPlusPlus2021 will update itself automatically every day, so the data will be current and you can analyse all matches upto the previous day, along with the historical performances of the teams. So make sure you check it everyday.
The are 5 tabs for each of the formats supported by GooglyPlusPlus2021 which now supports IPL, Intl. T20(men), Intl. T20(women), BBL, NTB, PSL, CPL, SSM, WBB. Besides, it also supports ODI (men) and ODI (women)
Each of the formats have 5 tabs – Batsman, Bowler, Match, Head-to-head and Overall Performace.
All T20 formats also include a ranking functionality for the batsmen and bowlers
You can now perform drill-down analytics for batsmen, bowlers, head-to-head and overall performance based on date-range selector functionality. The ranking tabs also include date range selector granular analysis. For more details see GooglyPlusPlus2021 enhanced with drill-down batsman, bowler analytics
This latest update to GooglyPlusPlus2021 includes the following changes
a) All the functions in the ‘Batsman’ and ‘Bowler ‘tabs now include a date range, which allows you specify a period of interest.
b) The ‘Rank Batsman’ and ‘Rank Bowler’ tabs also include a date range selector, against the earlier version which had a ‘Since year’ slider see GooglyPlusPlus2021 bubbles up top T20 players in all formats!. The earlier ‘Since year’ slider option could only rank for the latest year or for all years up to the current year. Now with the new ‘date range’ picker we can check the batsman and bowler ranks in any IPL season or (any T20 format) or for a range of years.
c) Note: The Head-to-head and Overall performance tabs already include a date range selector.
There are 10 batsman functions and 9 bowler function that have changed for the following T20 and ODI formats and Rank batsman and bowler includes the ‘date range’ and has changed for all T20 formats.
GooglyPlusPlus2021 supports all the following T20 formats
I have included some random screen shots of some of using these tabs and options in GooglyPlusPlus2021.
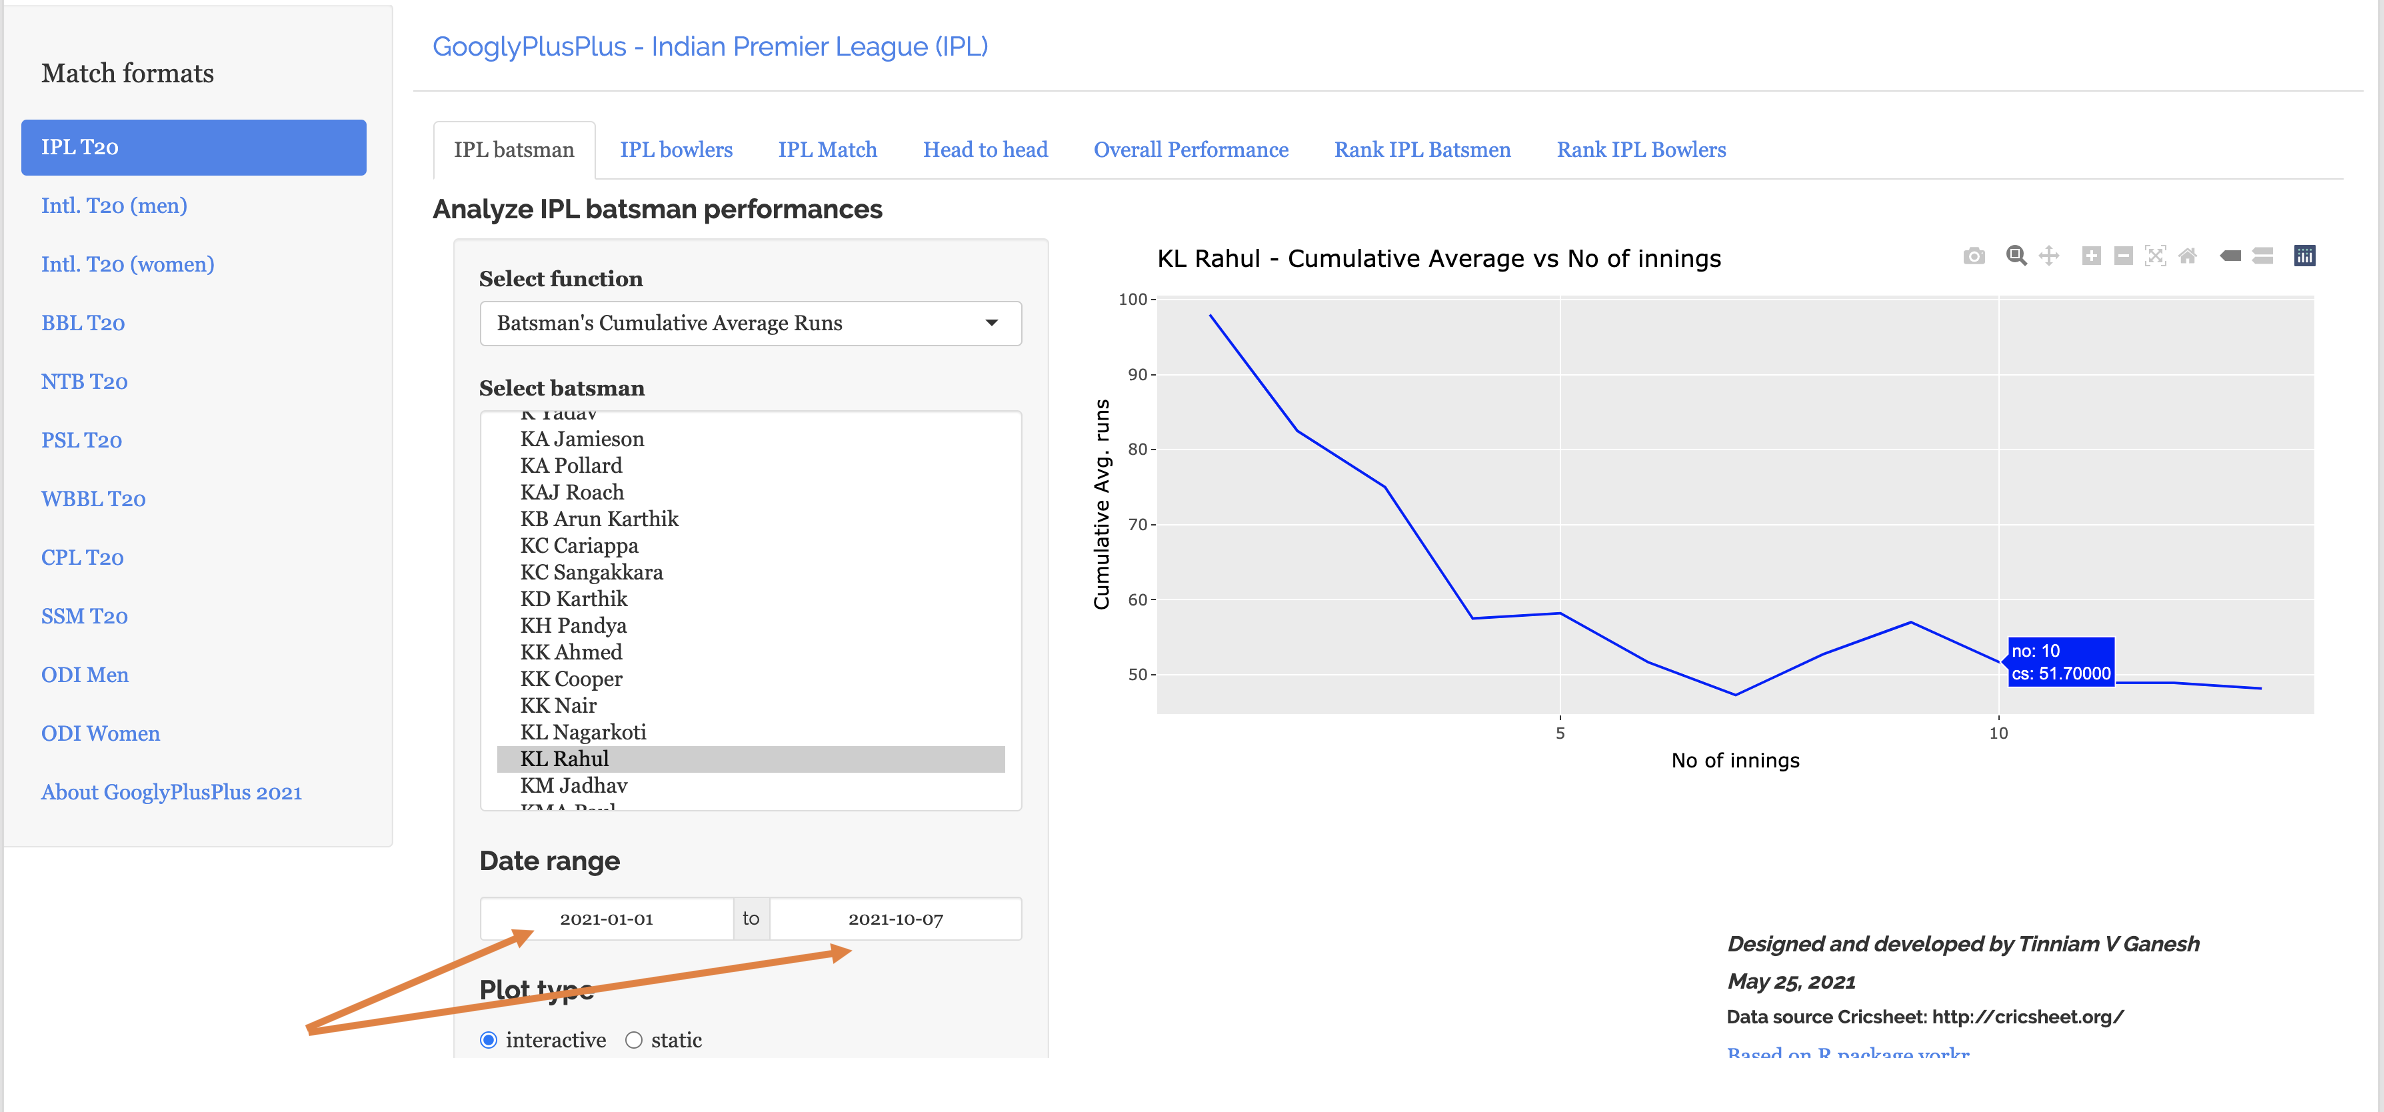
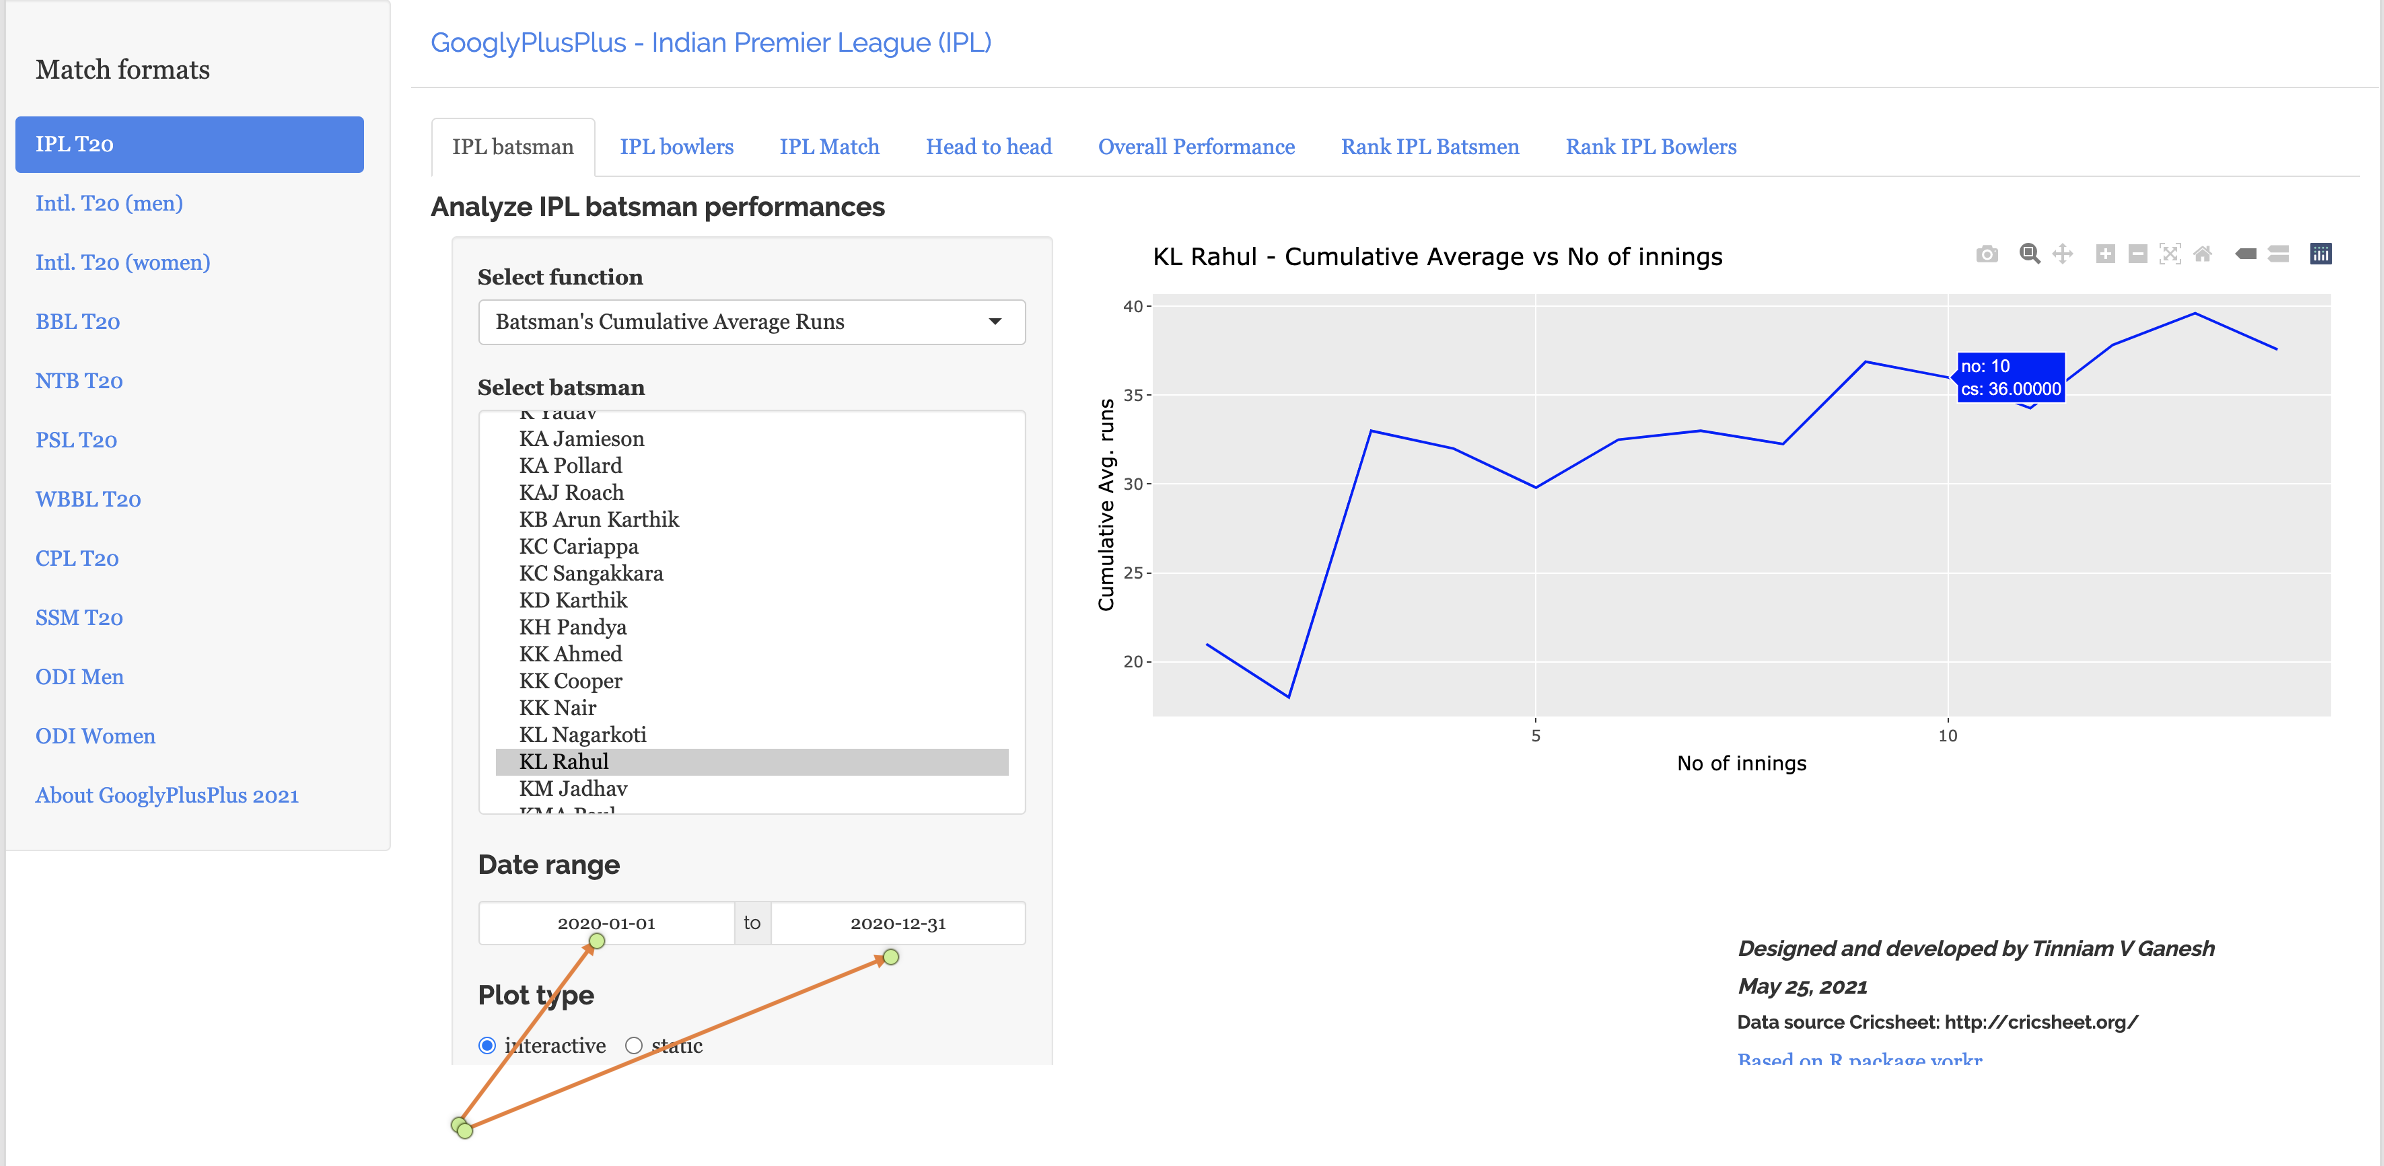
A) KL Rahul’s Cumulative average in IPL 2021 vs IPL 2020
a) KL Rahul in IPL 2021
b) KL Rahul in IPL 2020
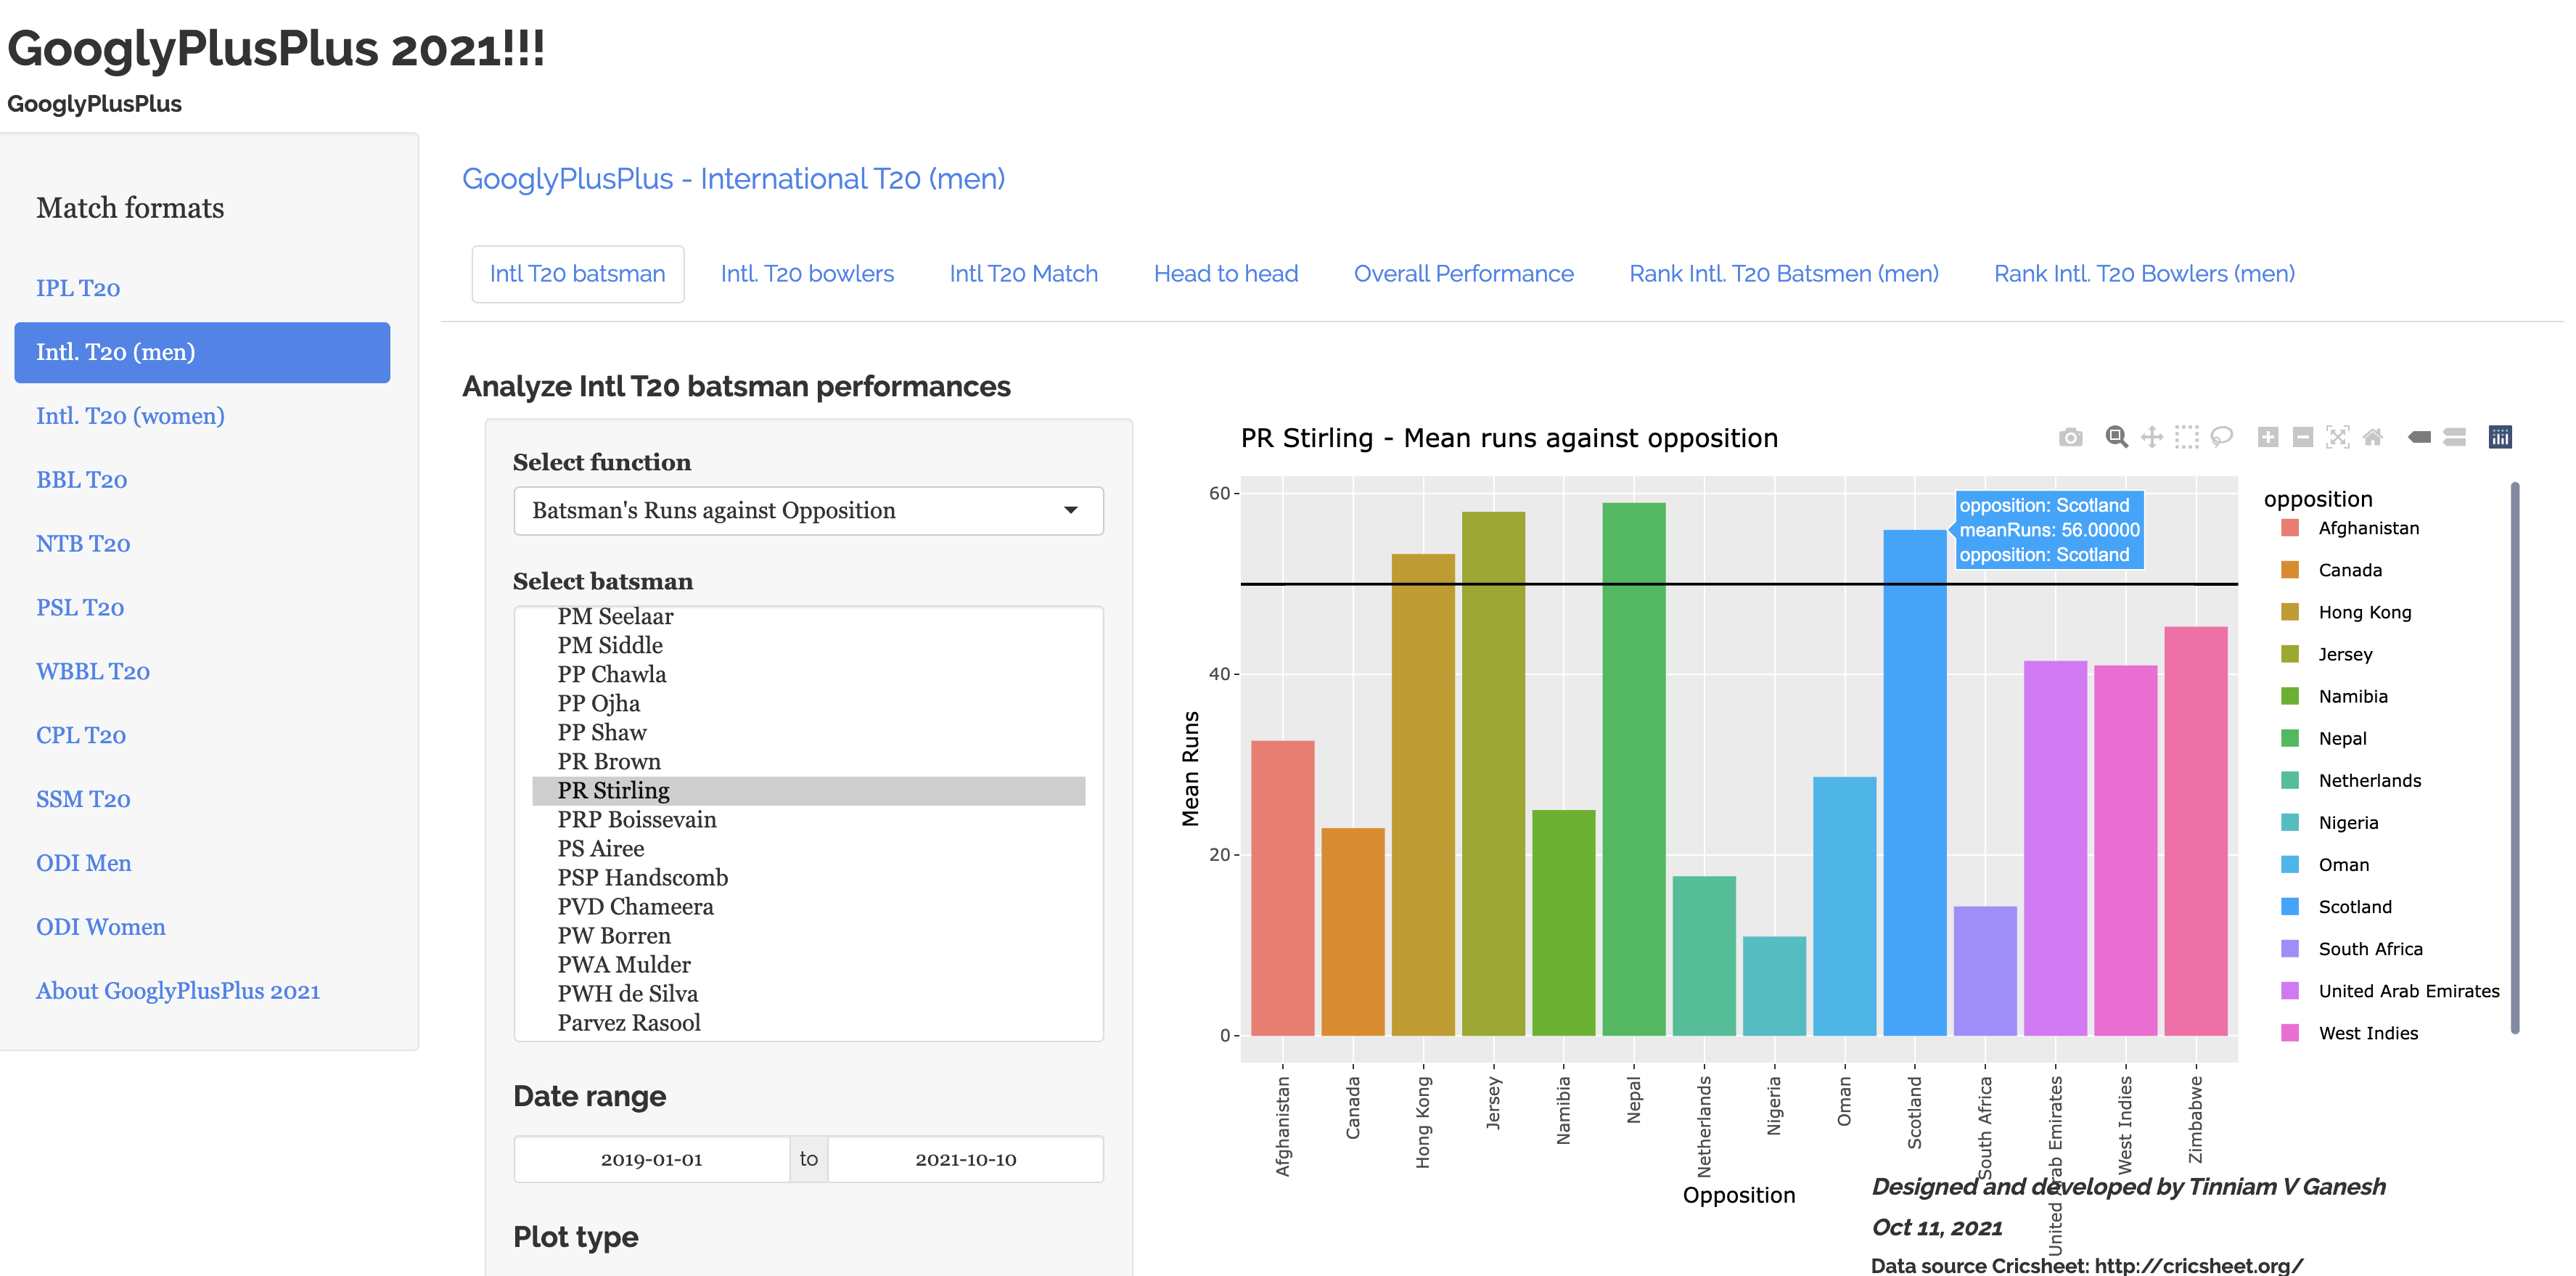
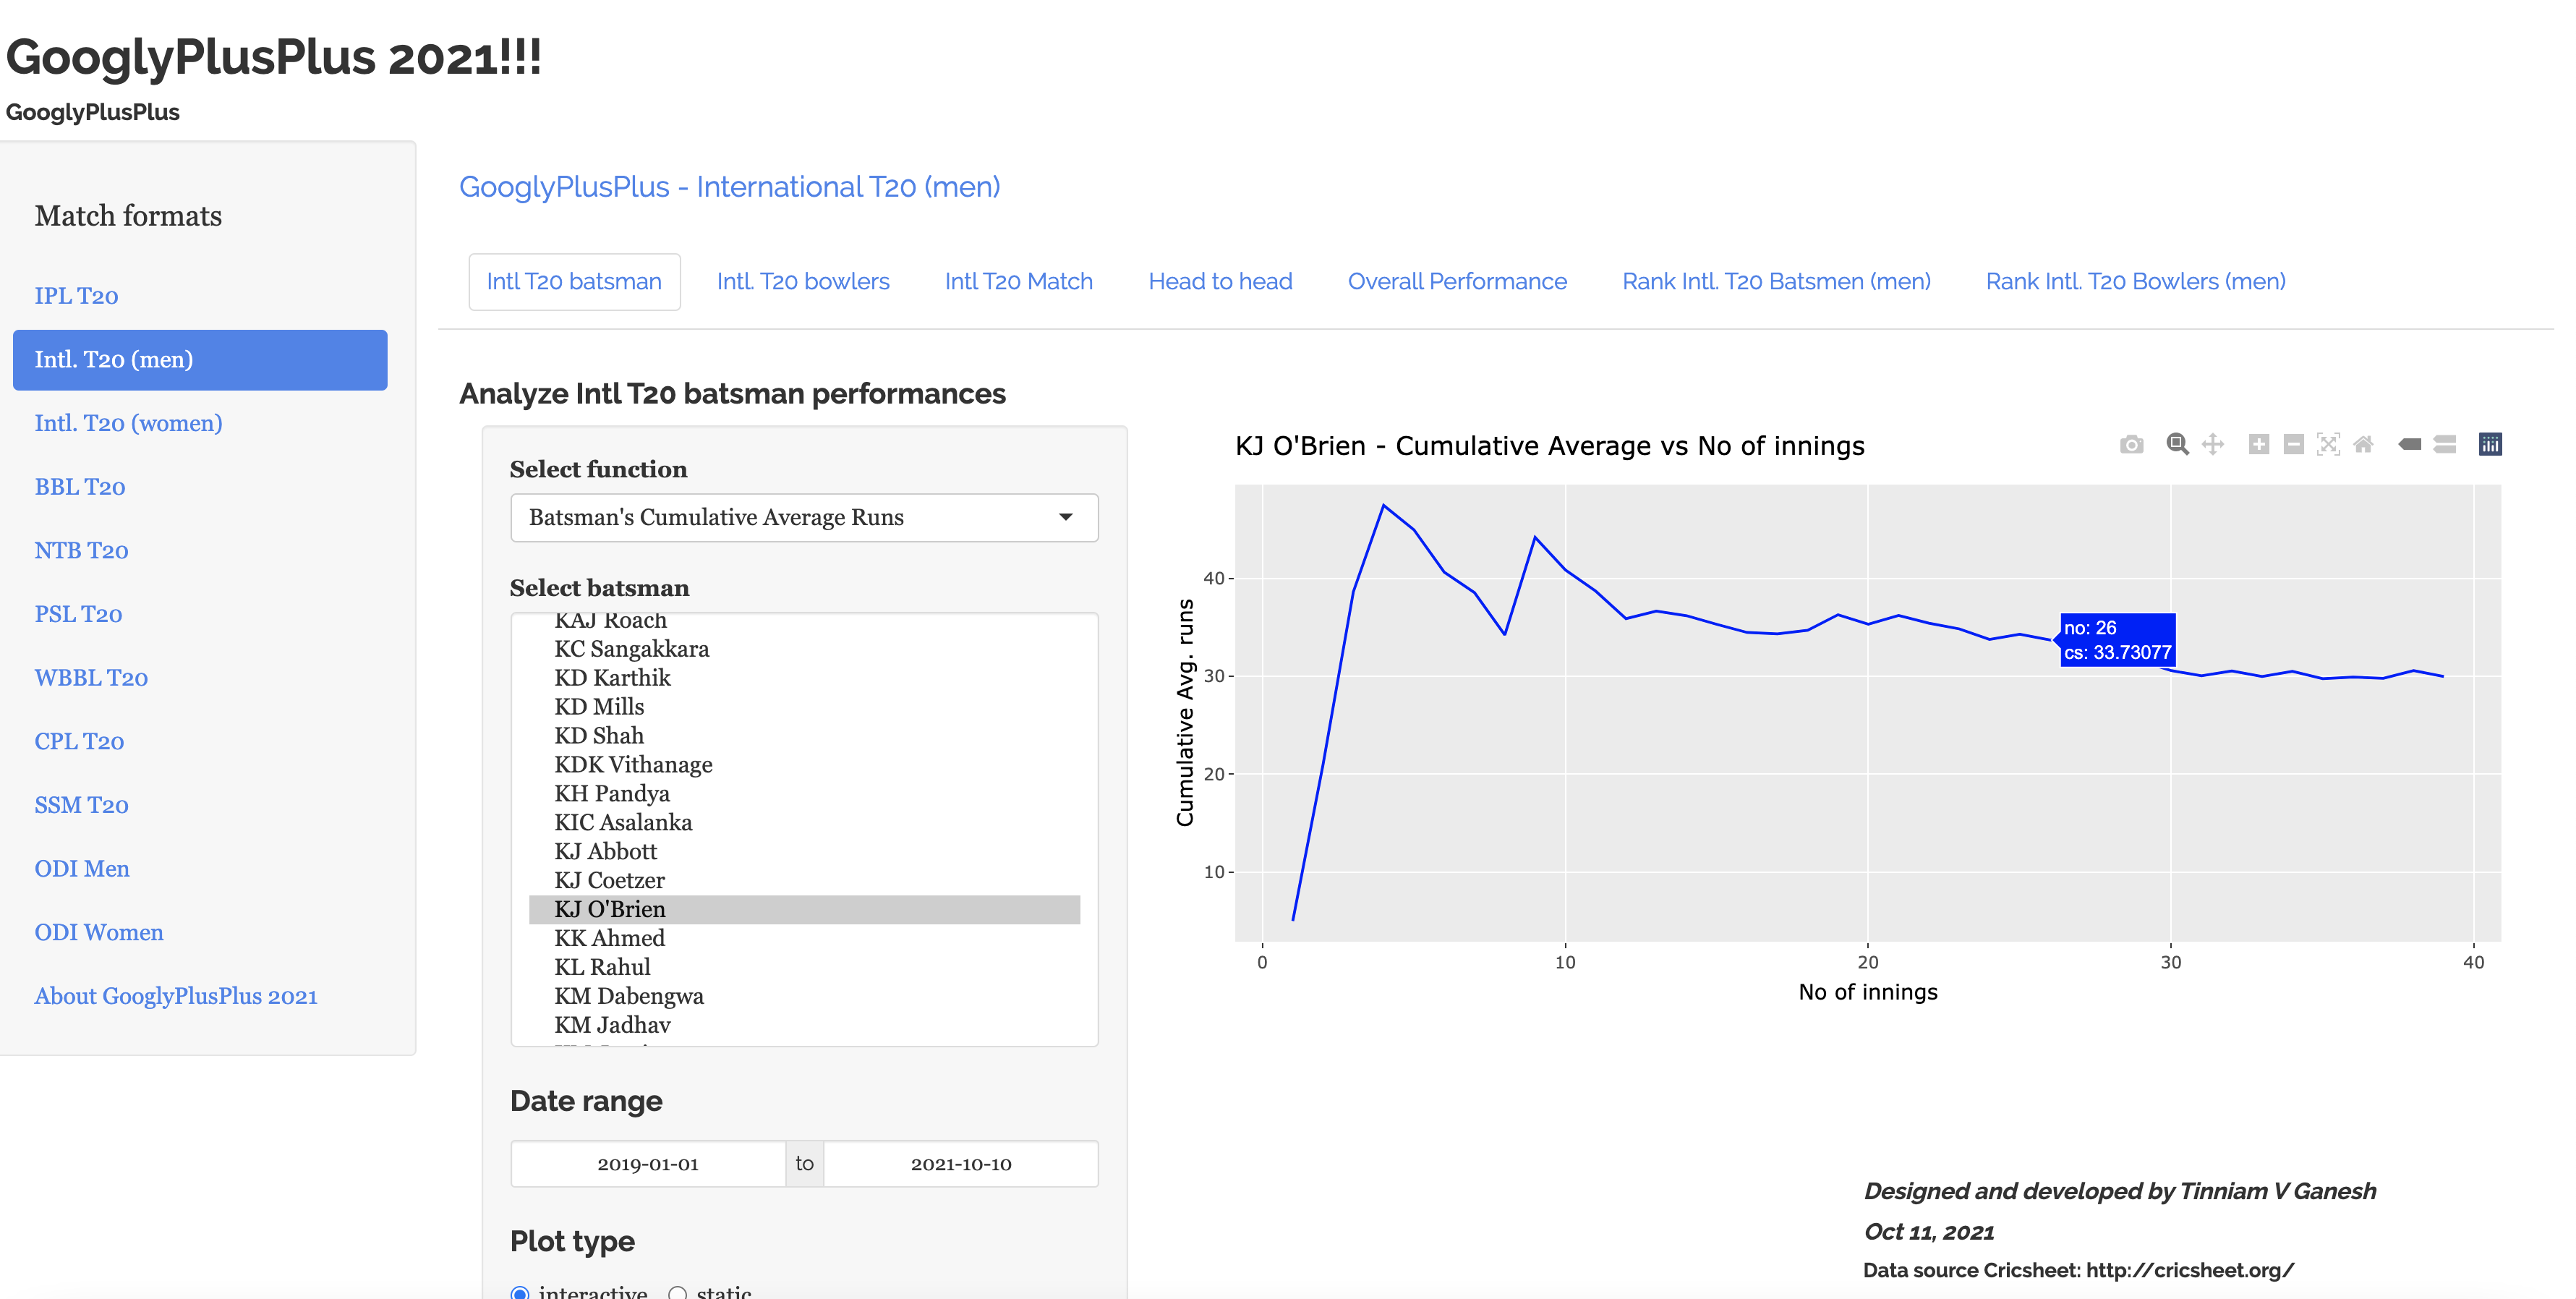
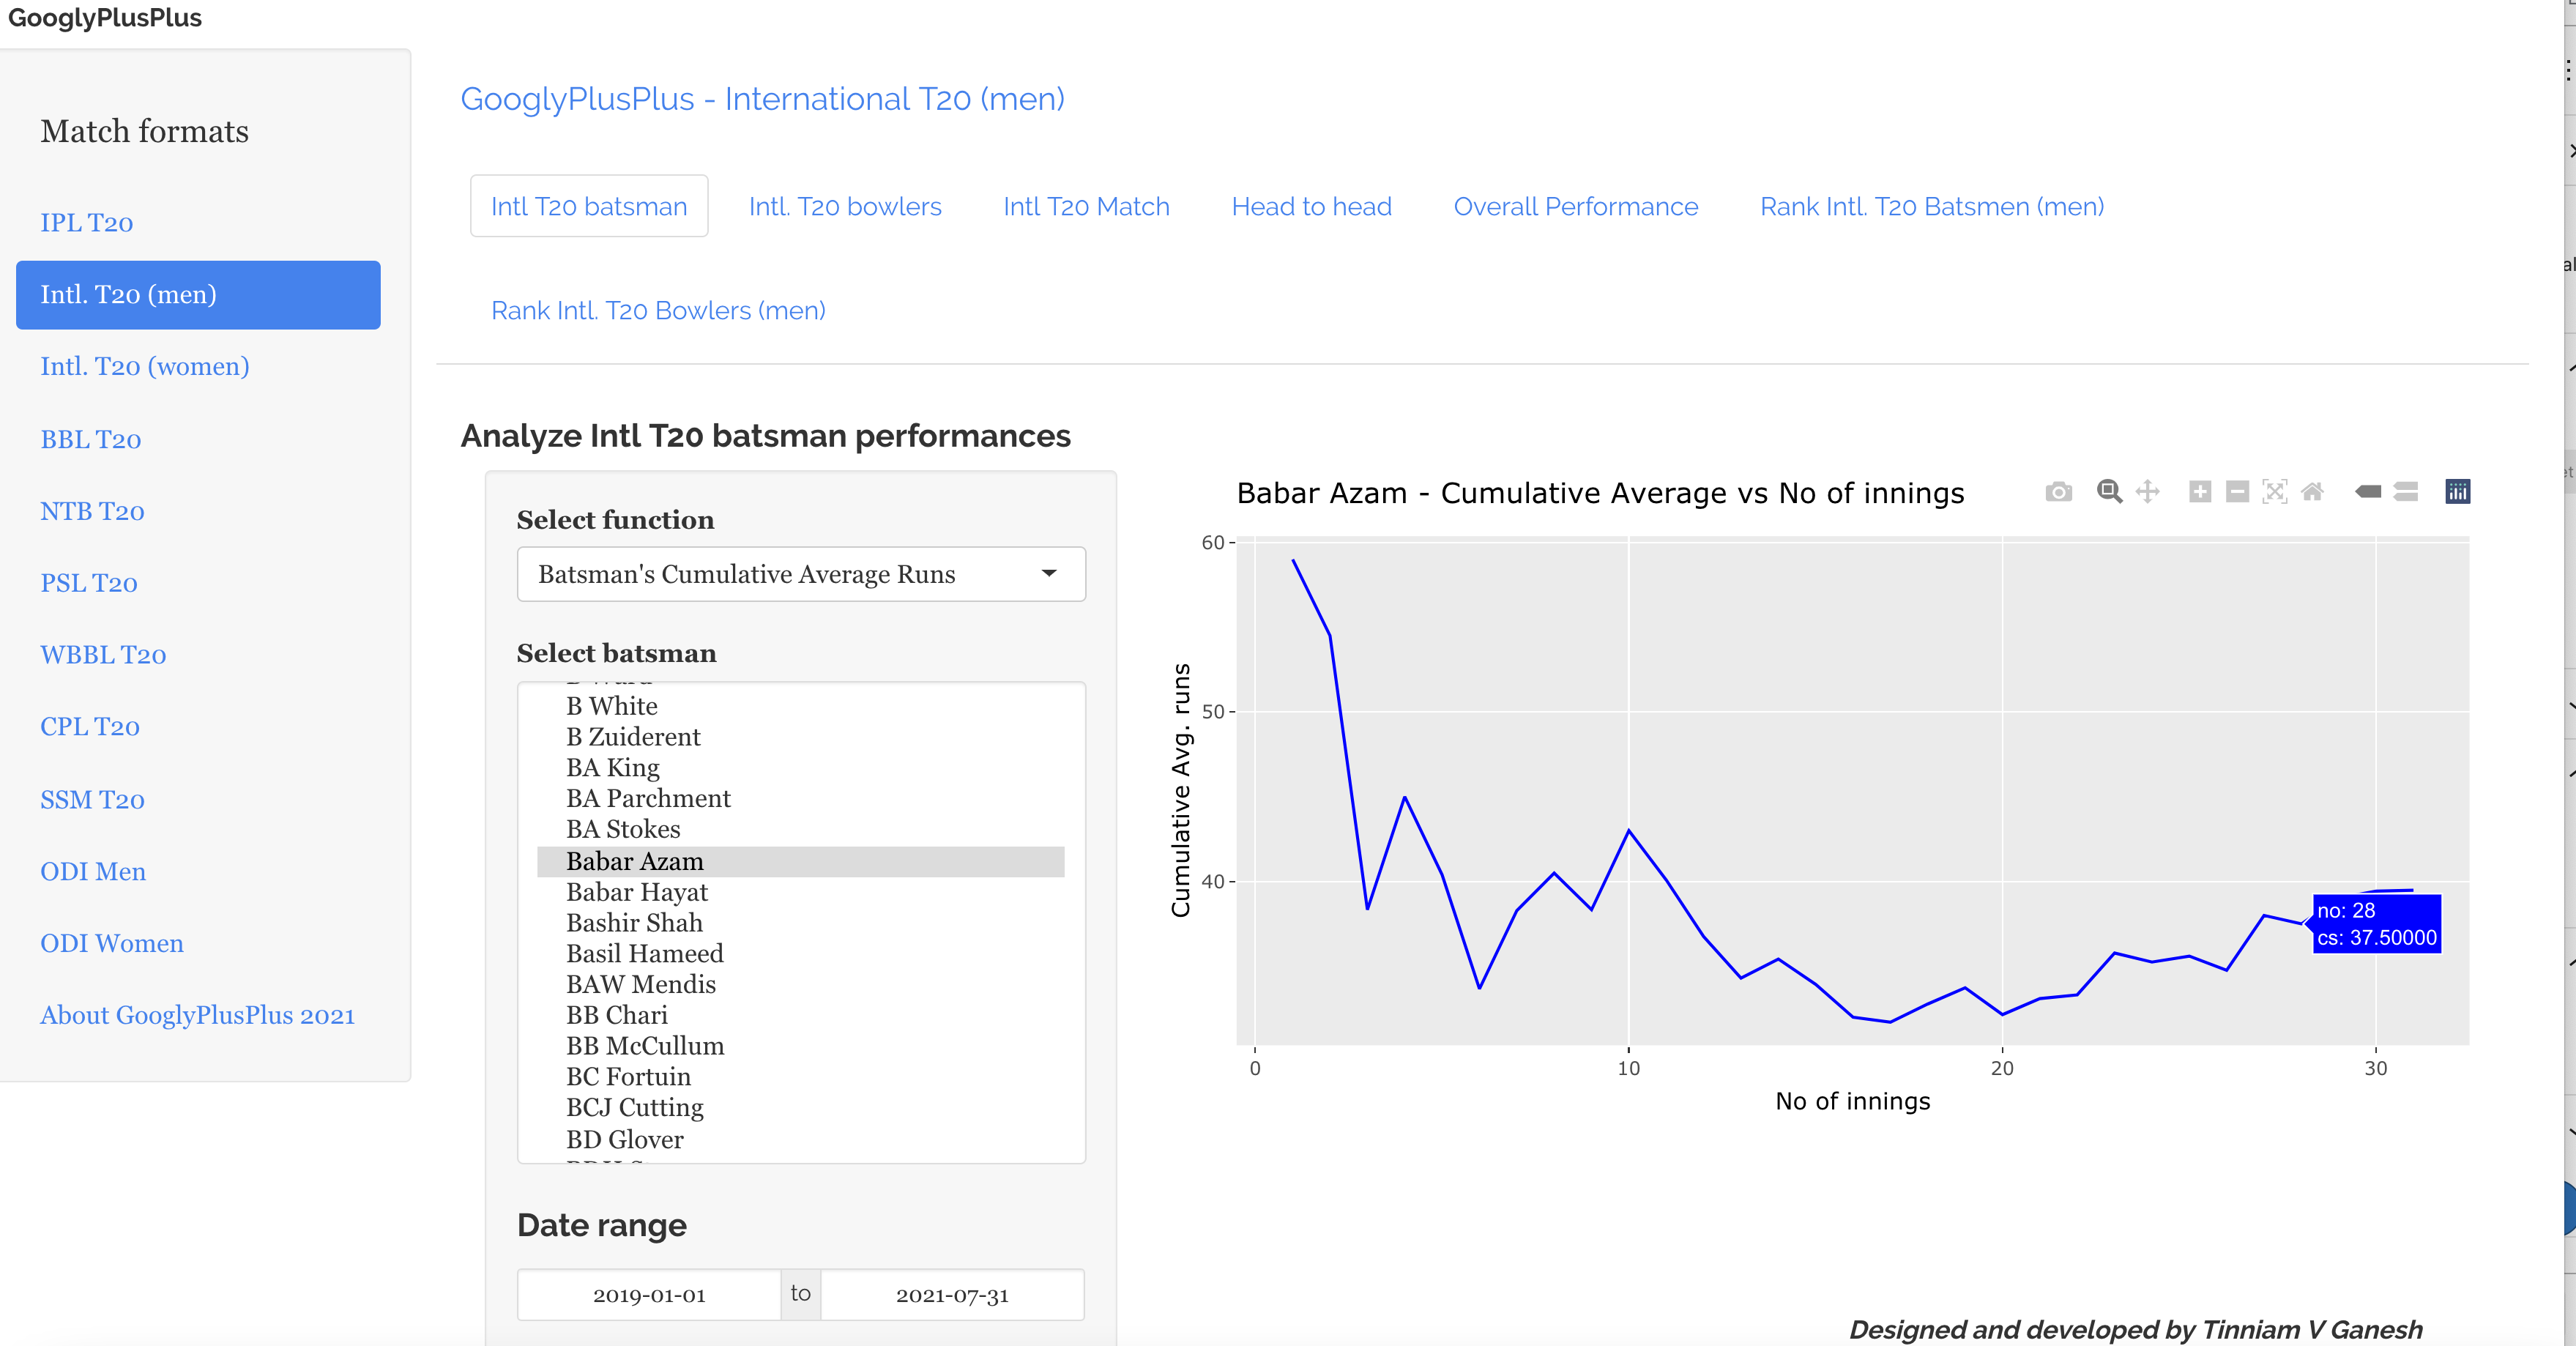
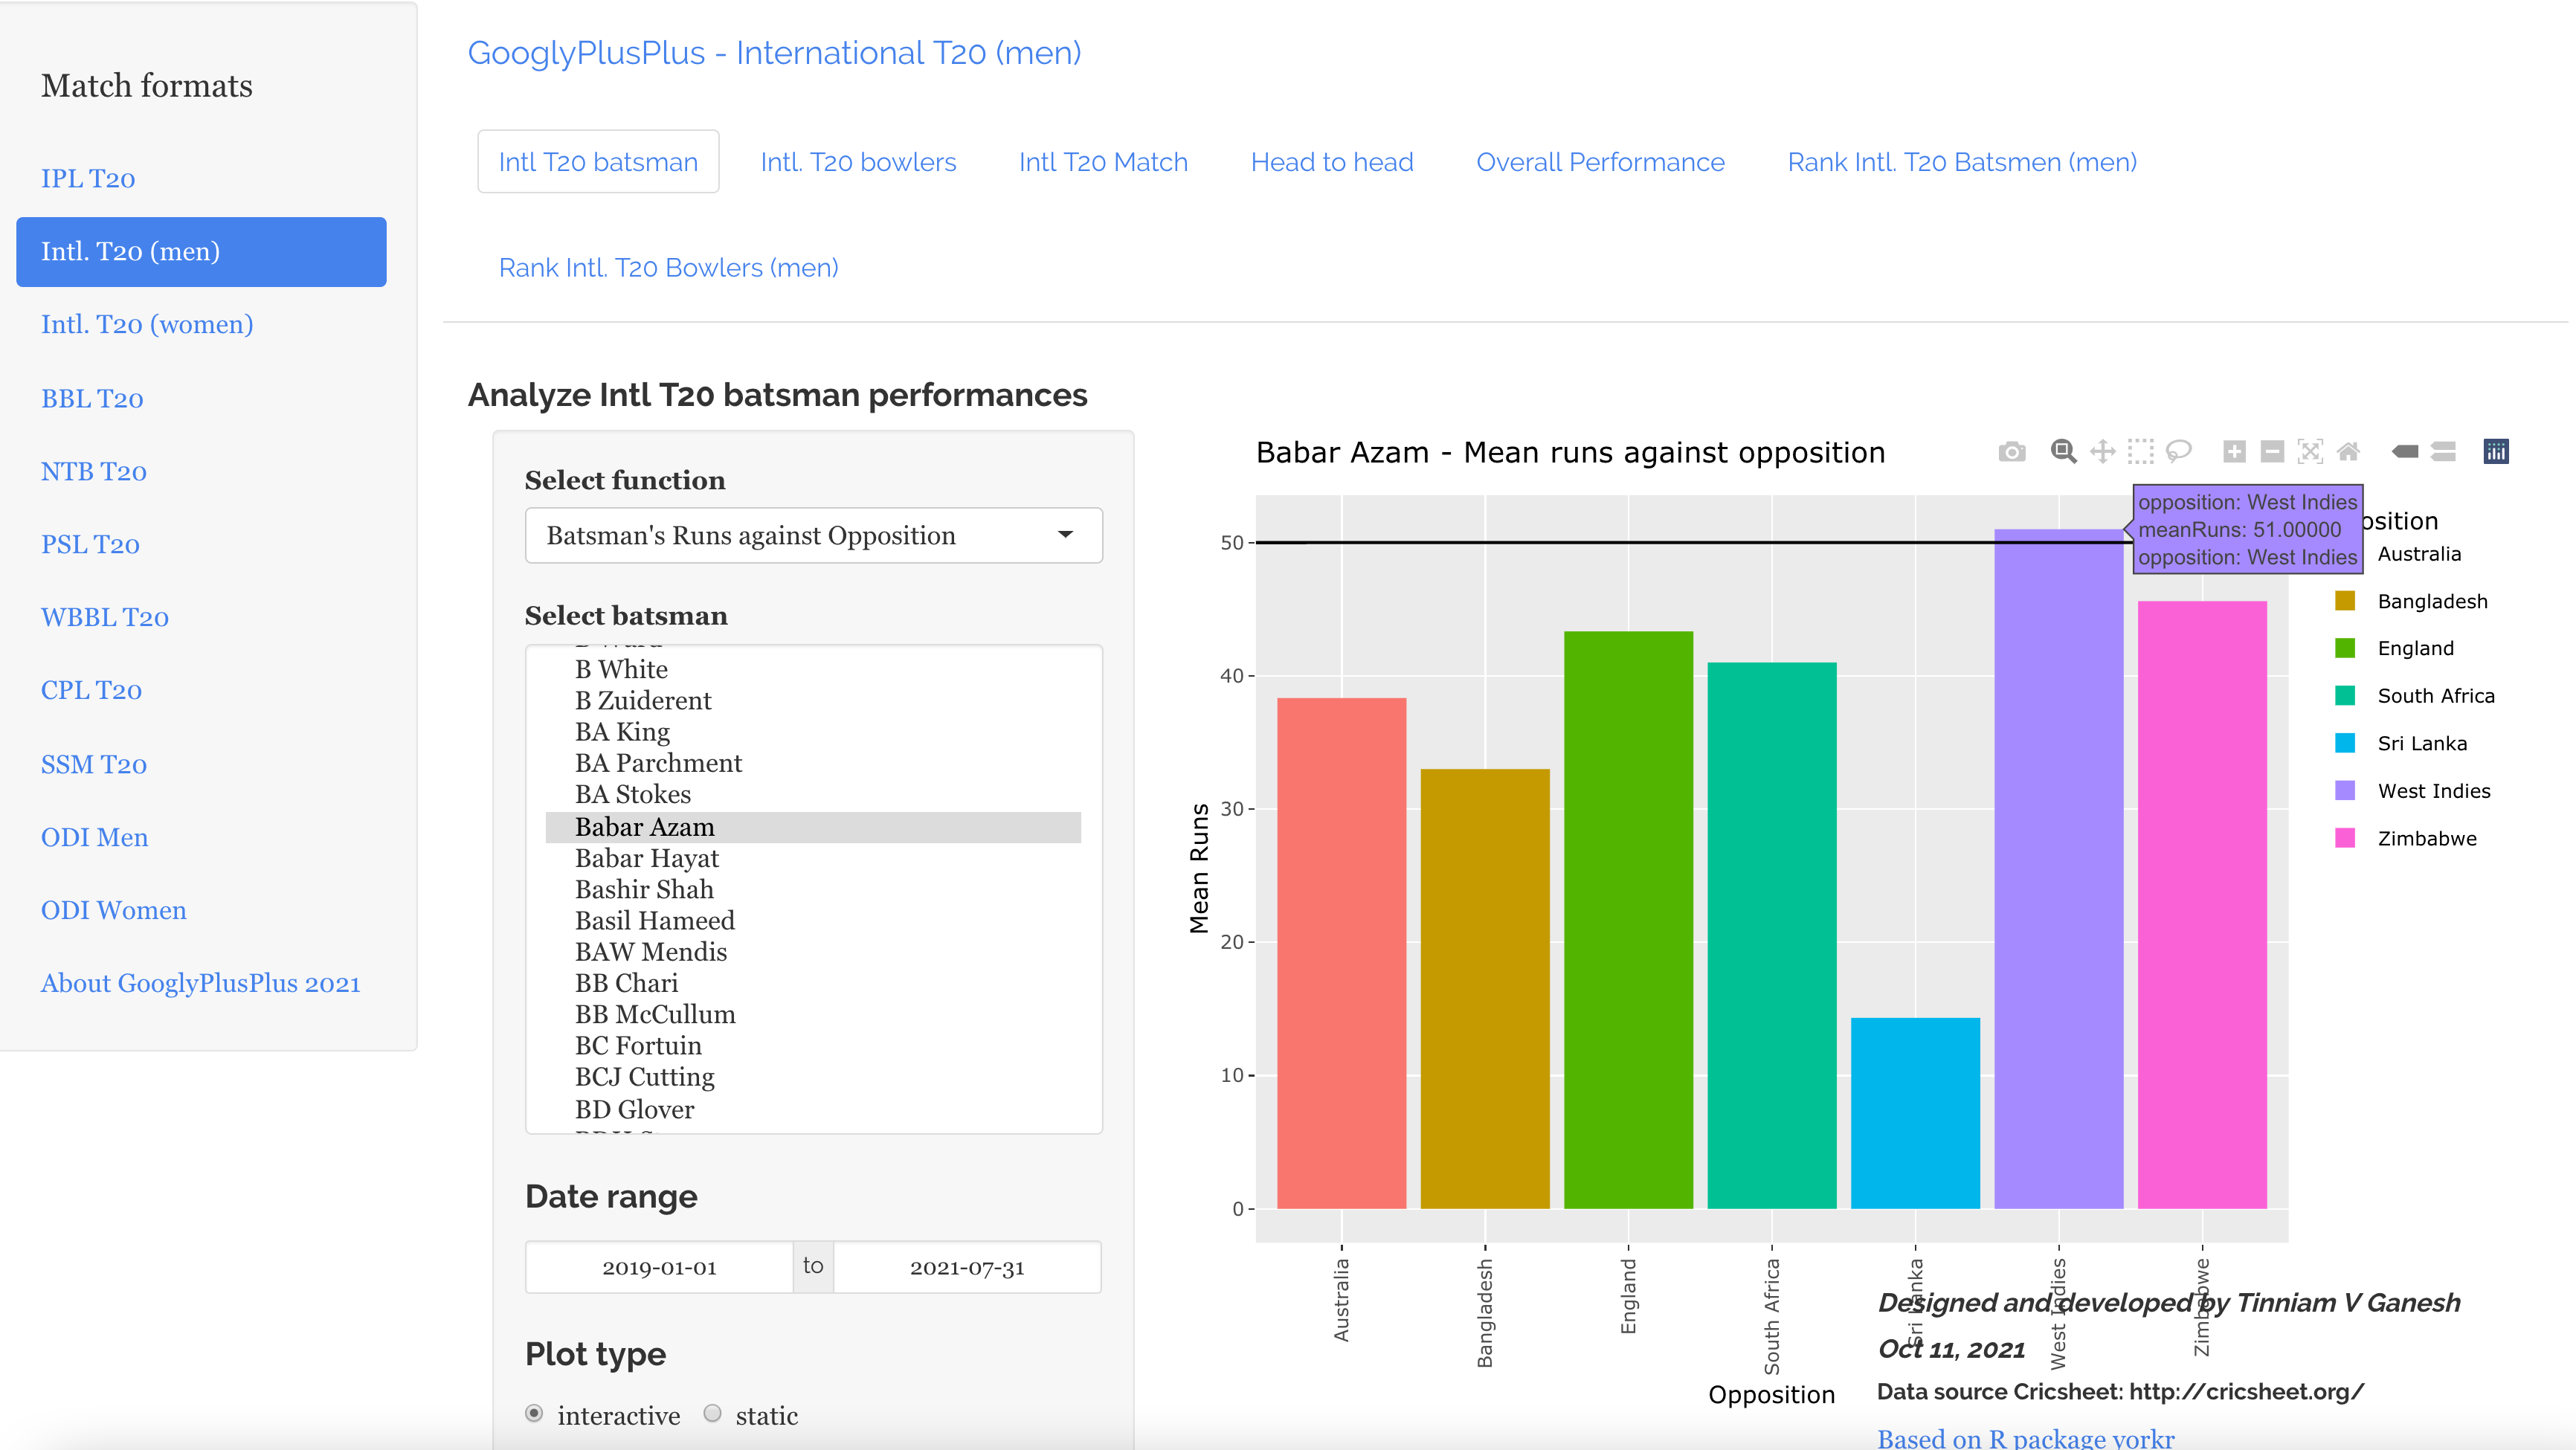
B) Performance of Babar Azam in Intl. T20 (men)
a) Babar Azam’s cumulative average from 2019
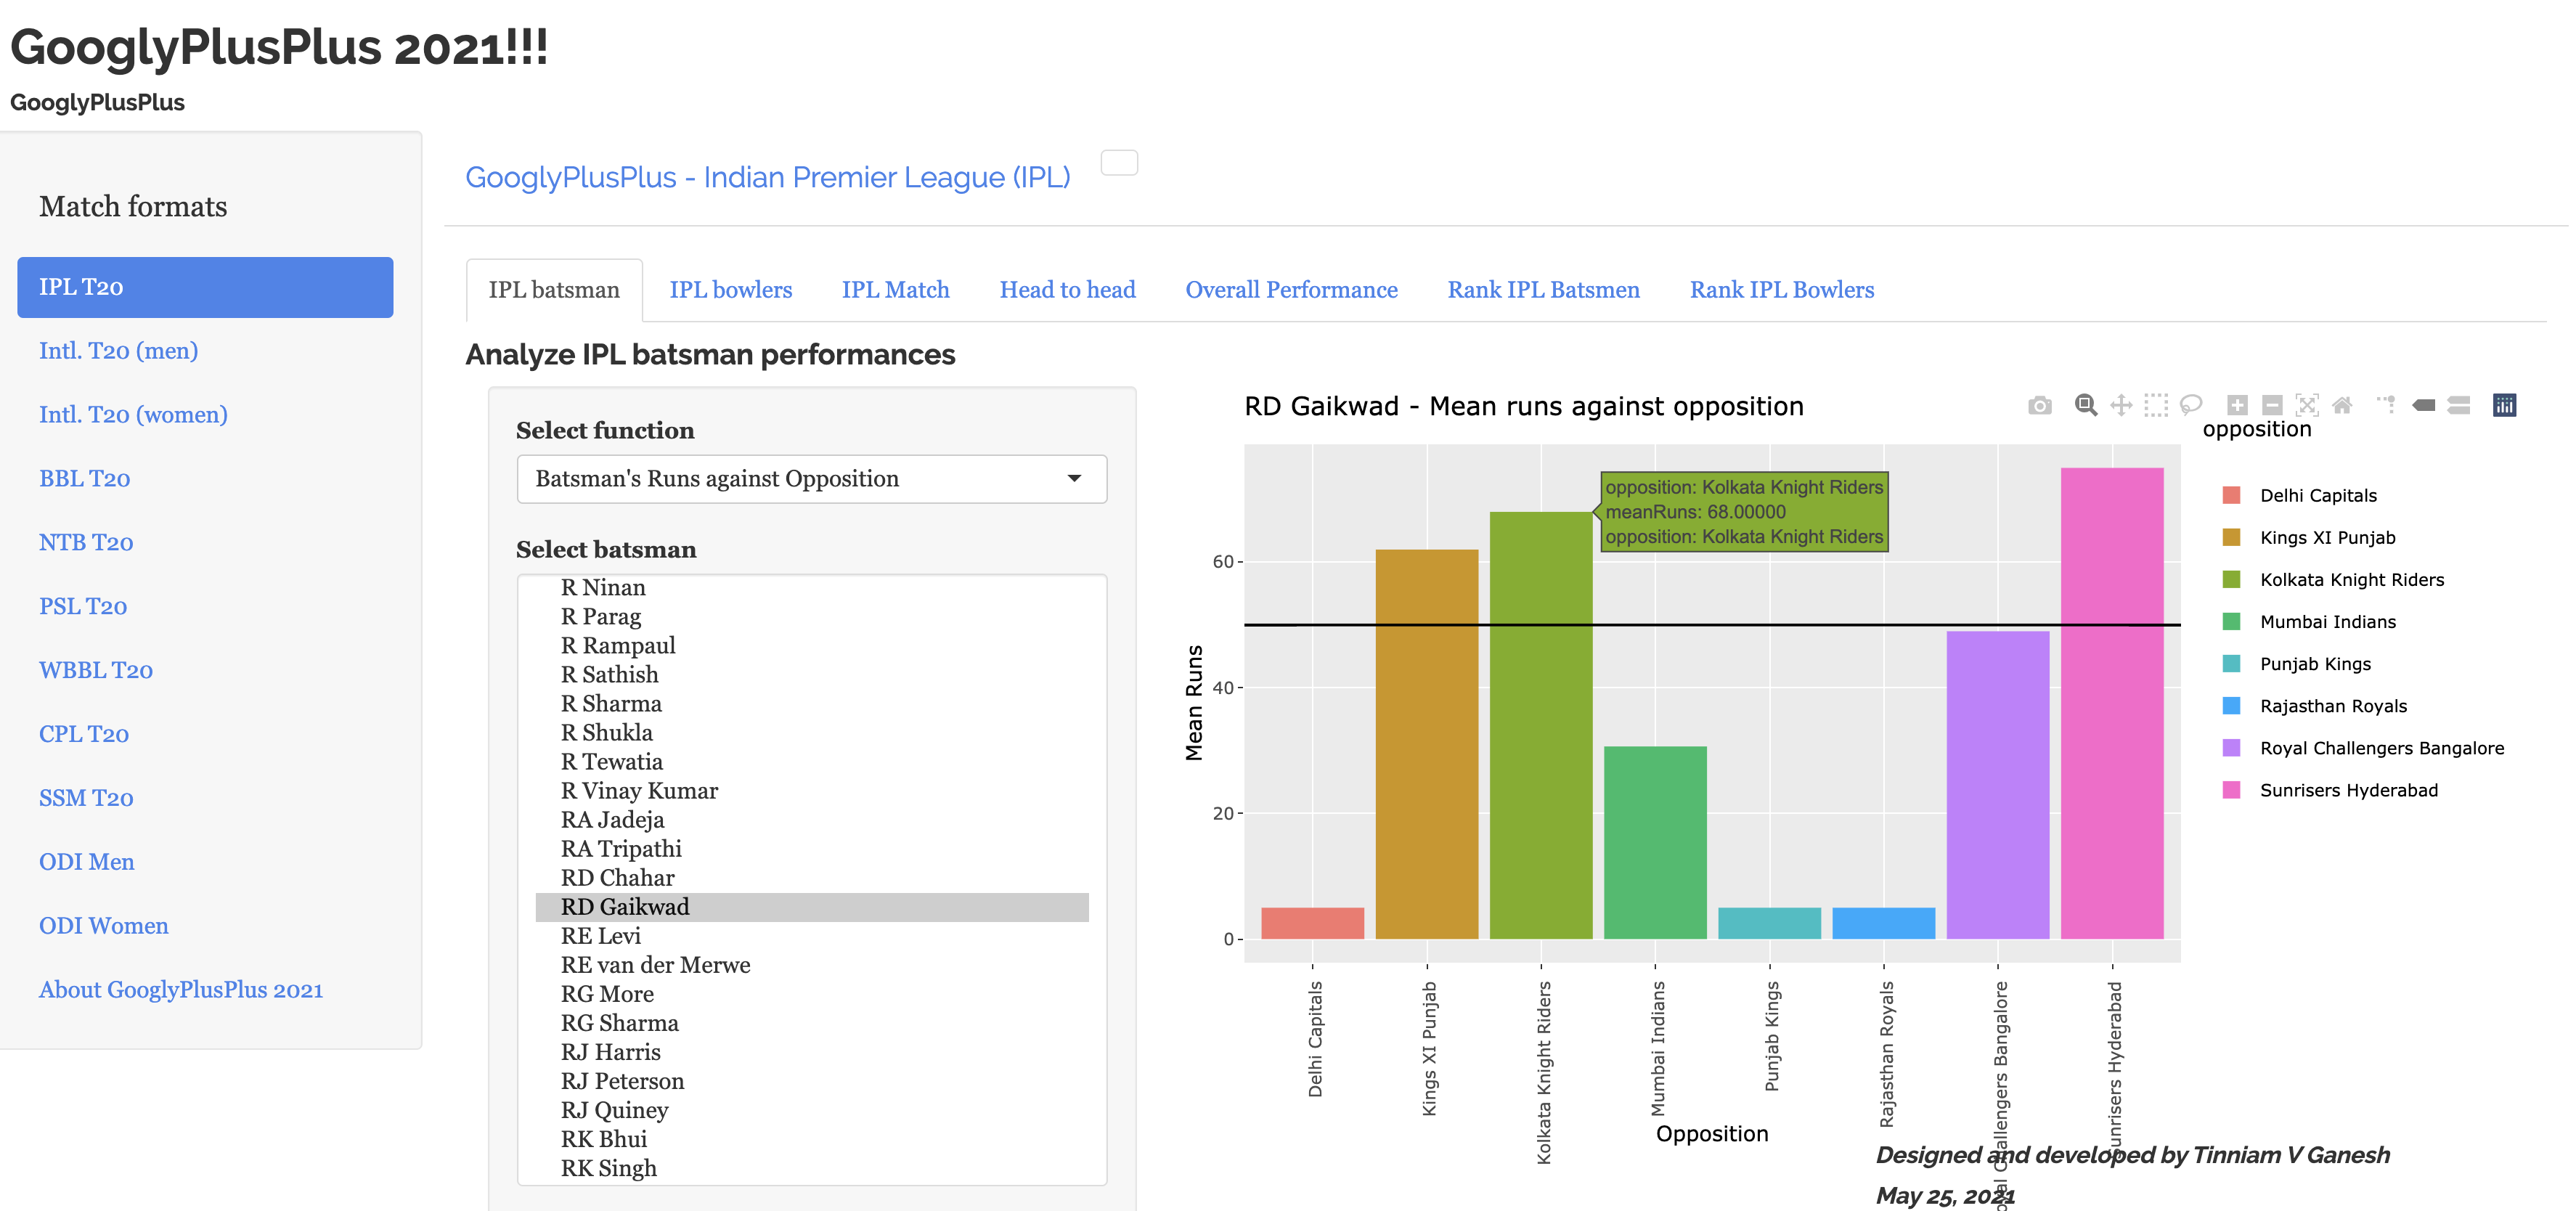
b) Babar Azam’s Runs against opposition since 2019
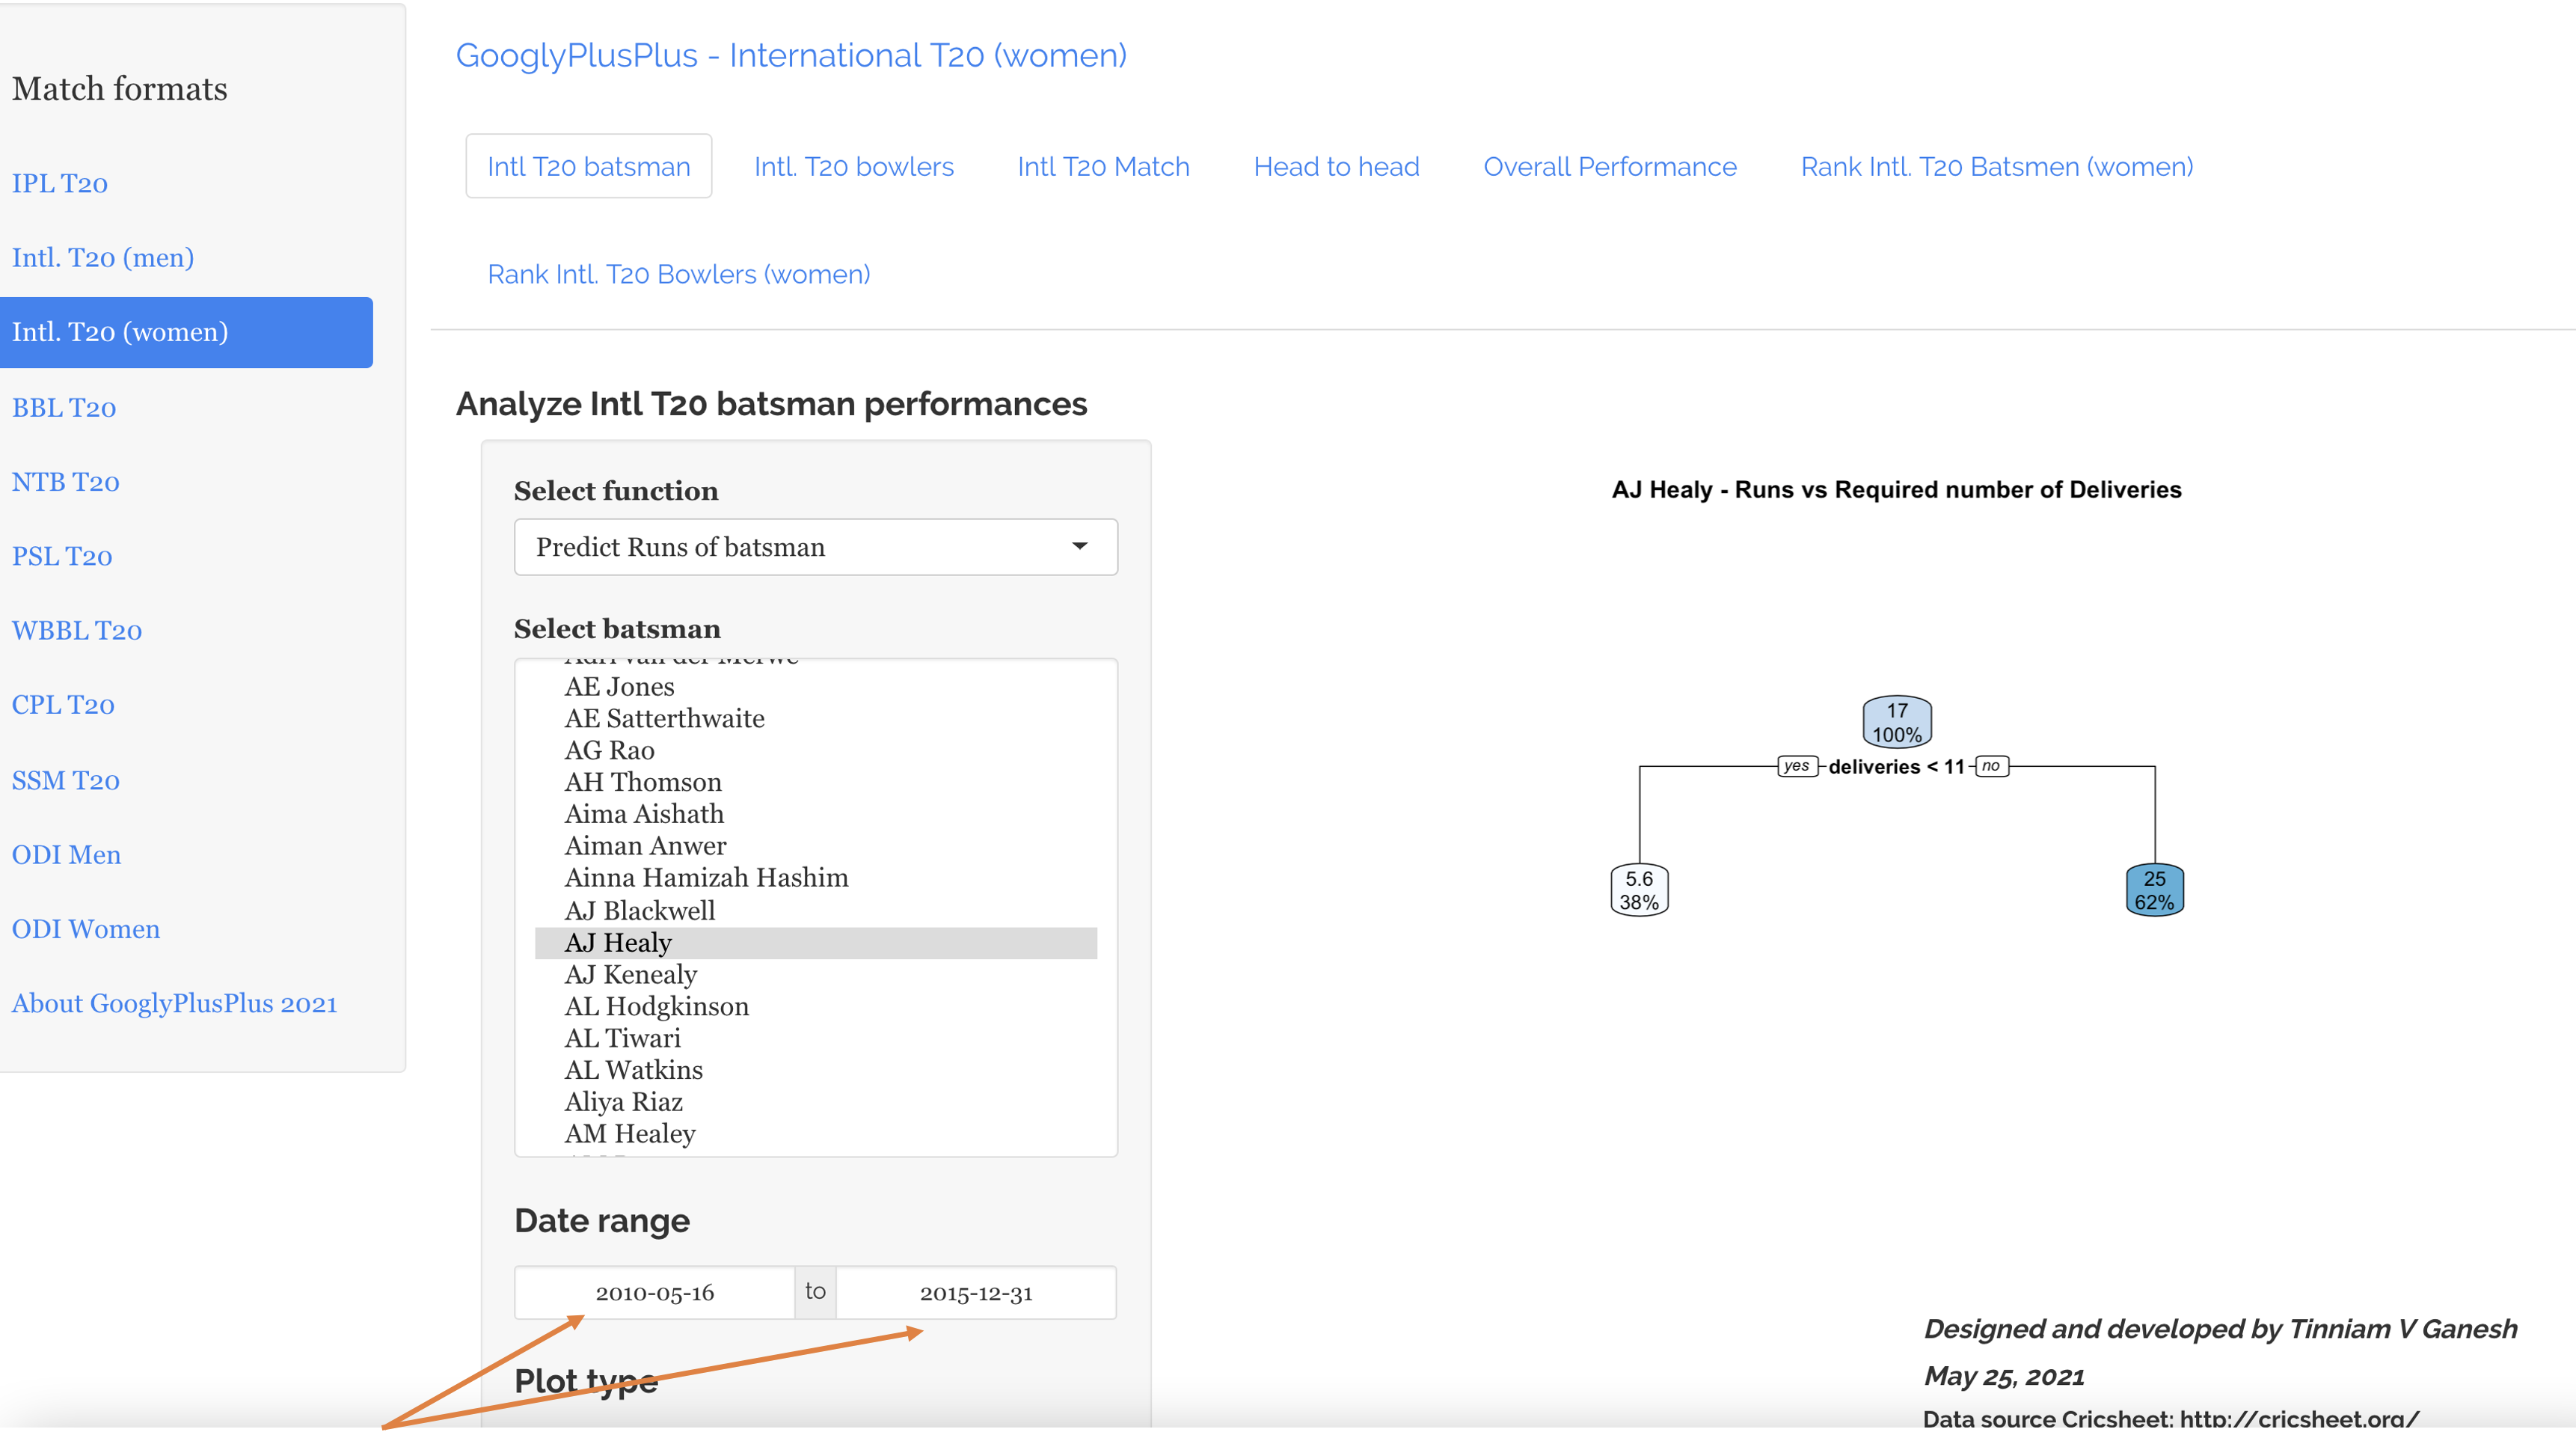
Note: Intl. T20 (women) data available upto Mar 2020 from Cricsheet
a) A J Healy performance between 2010 – 2015
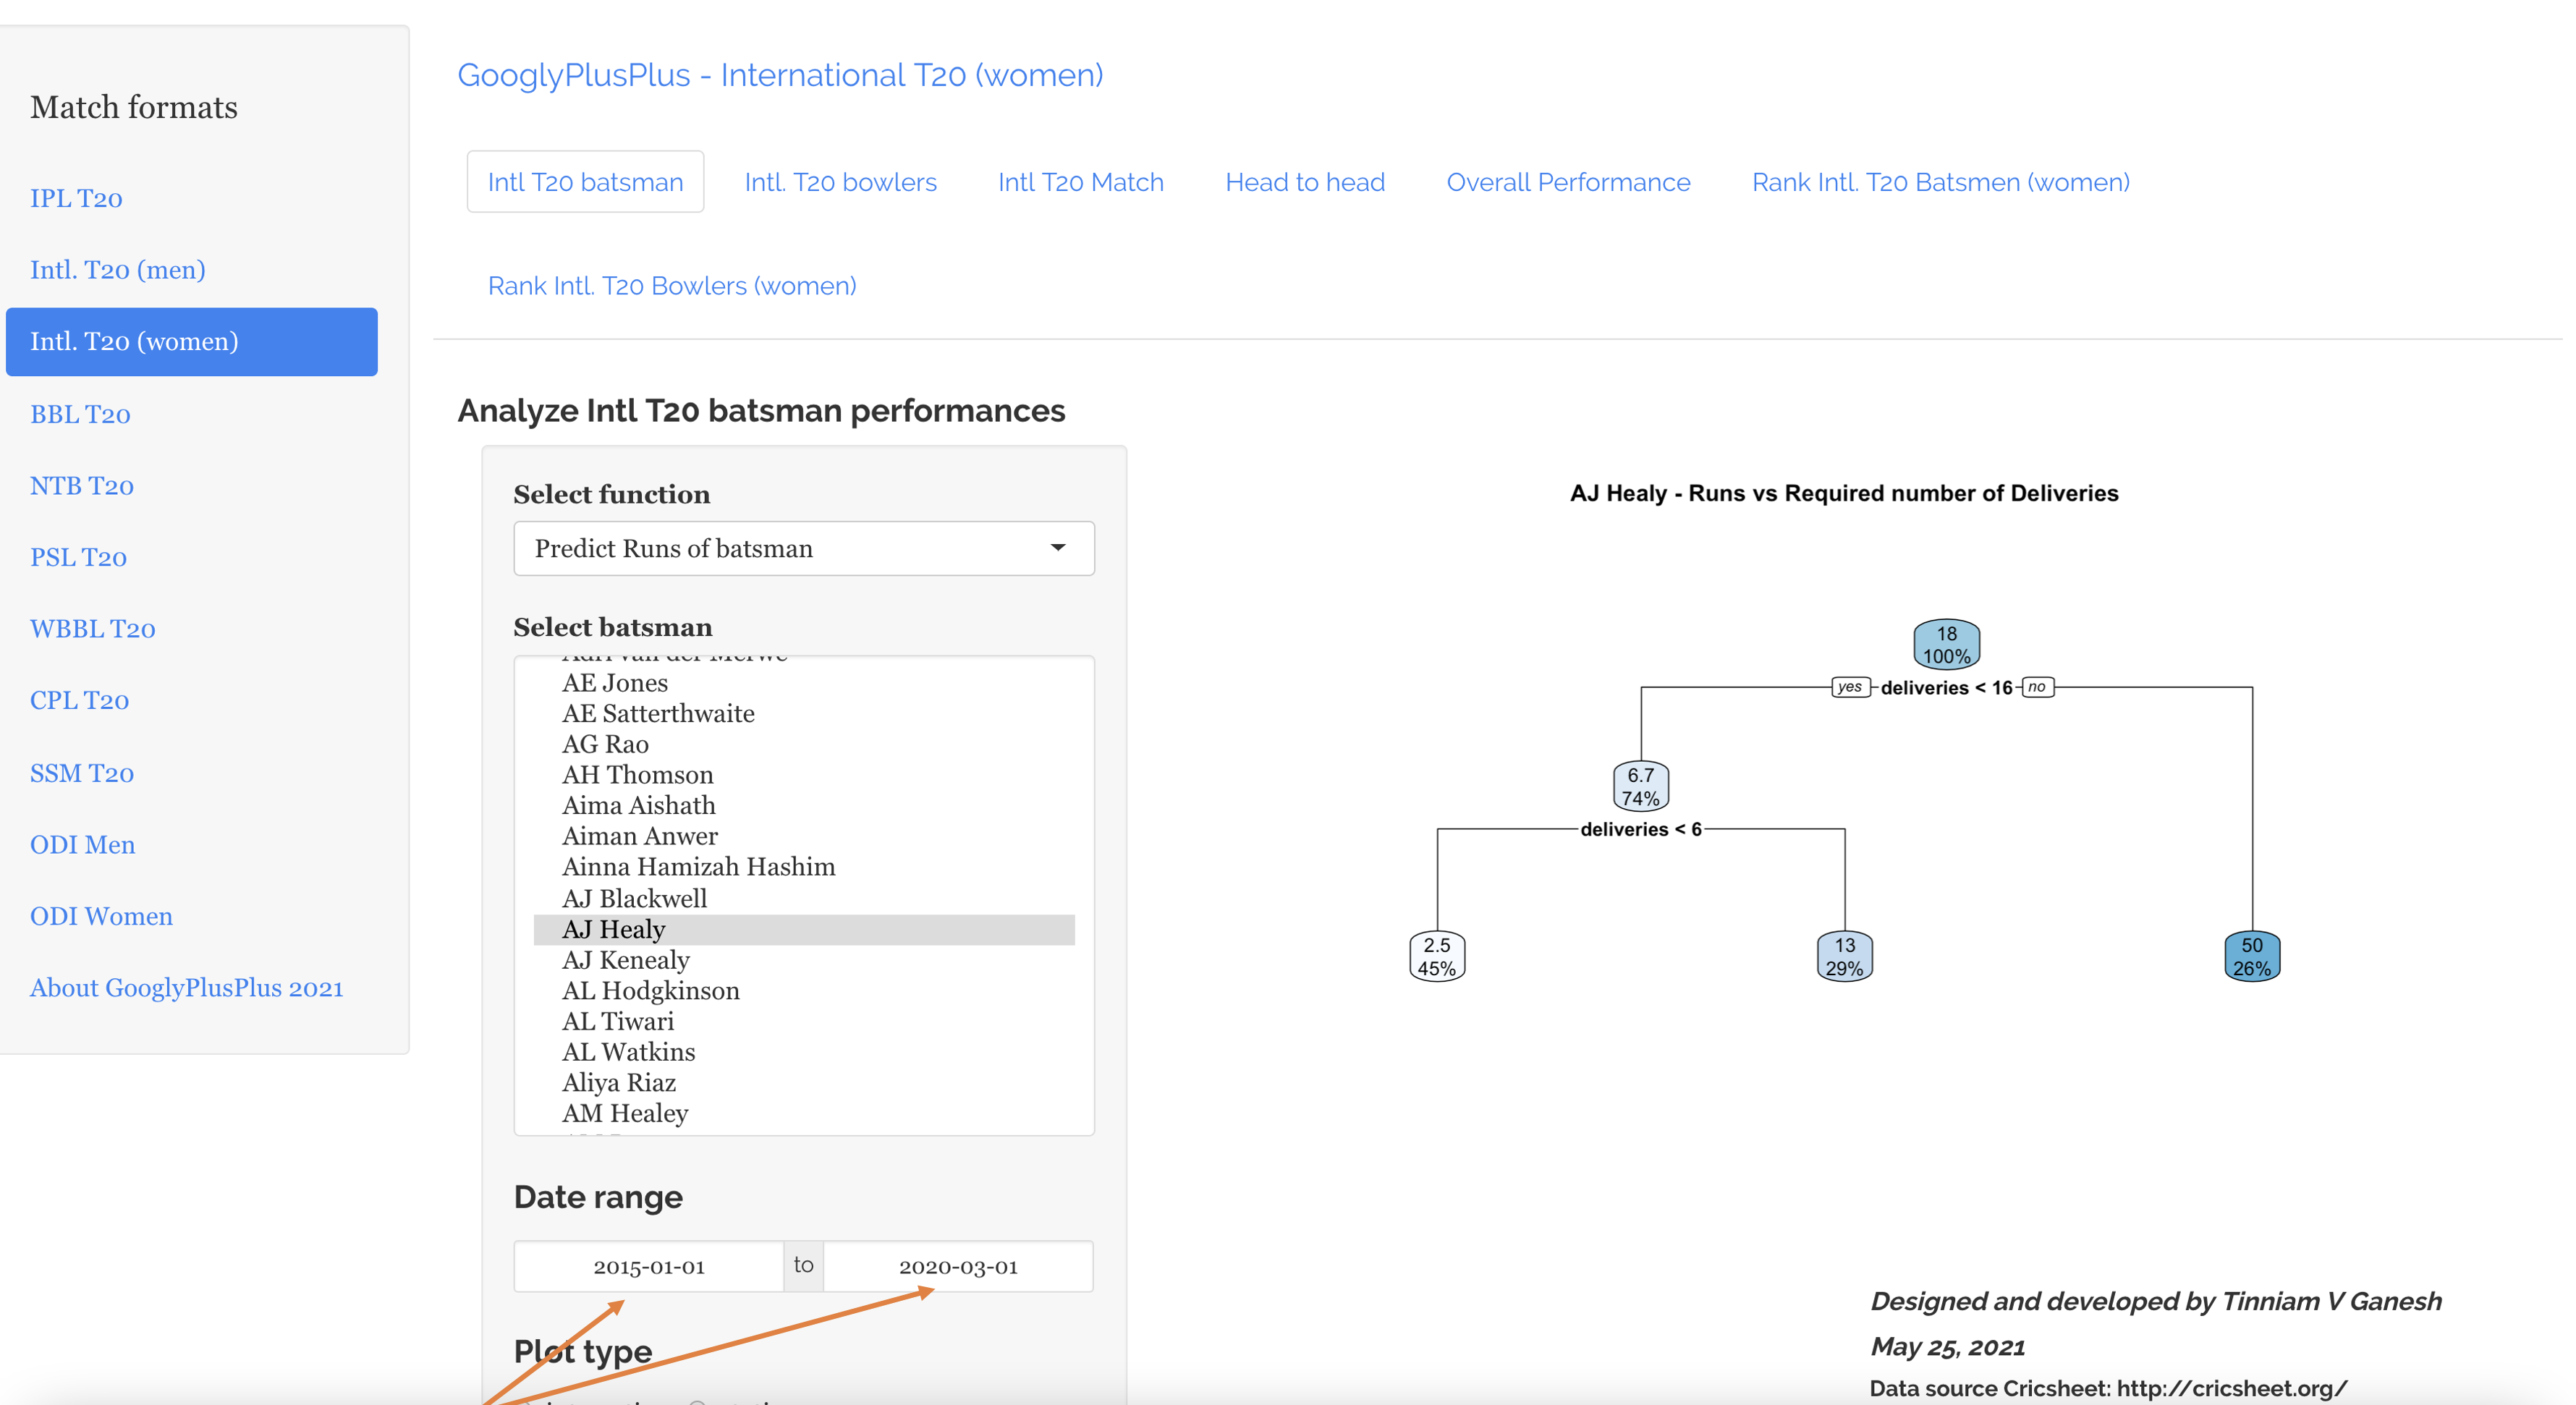
b) A J Healy performance between 2015 – 2020
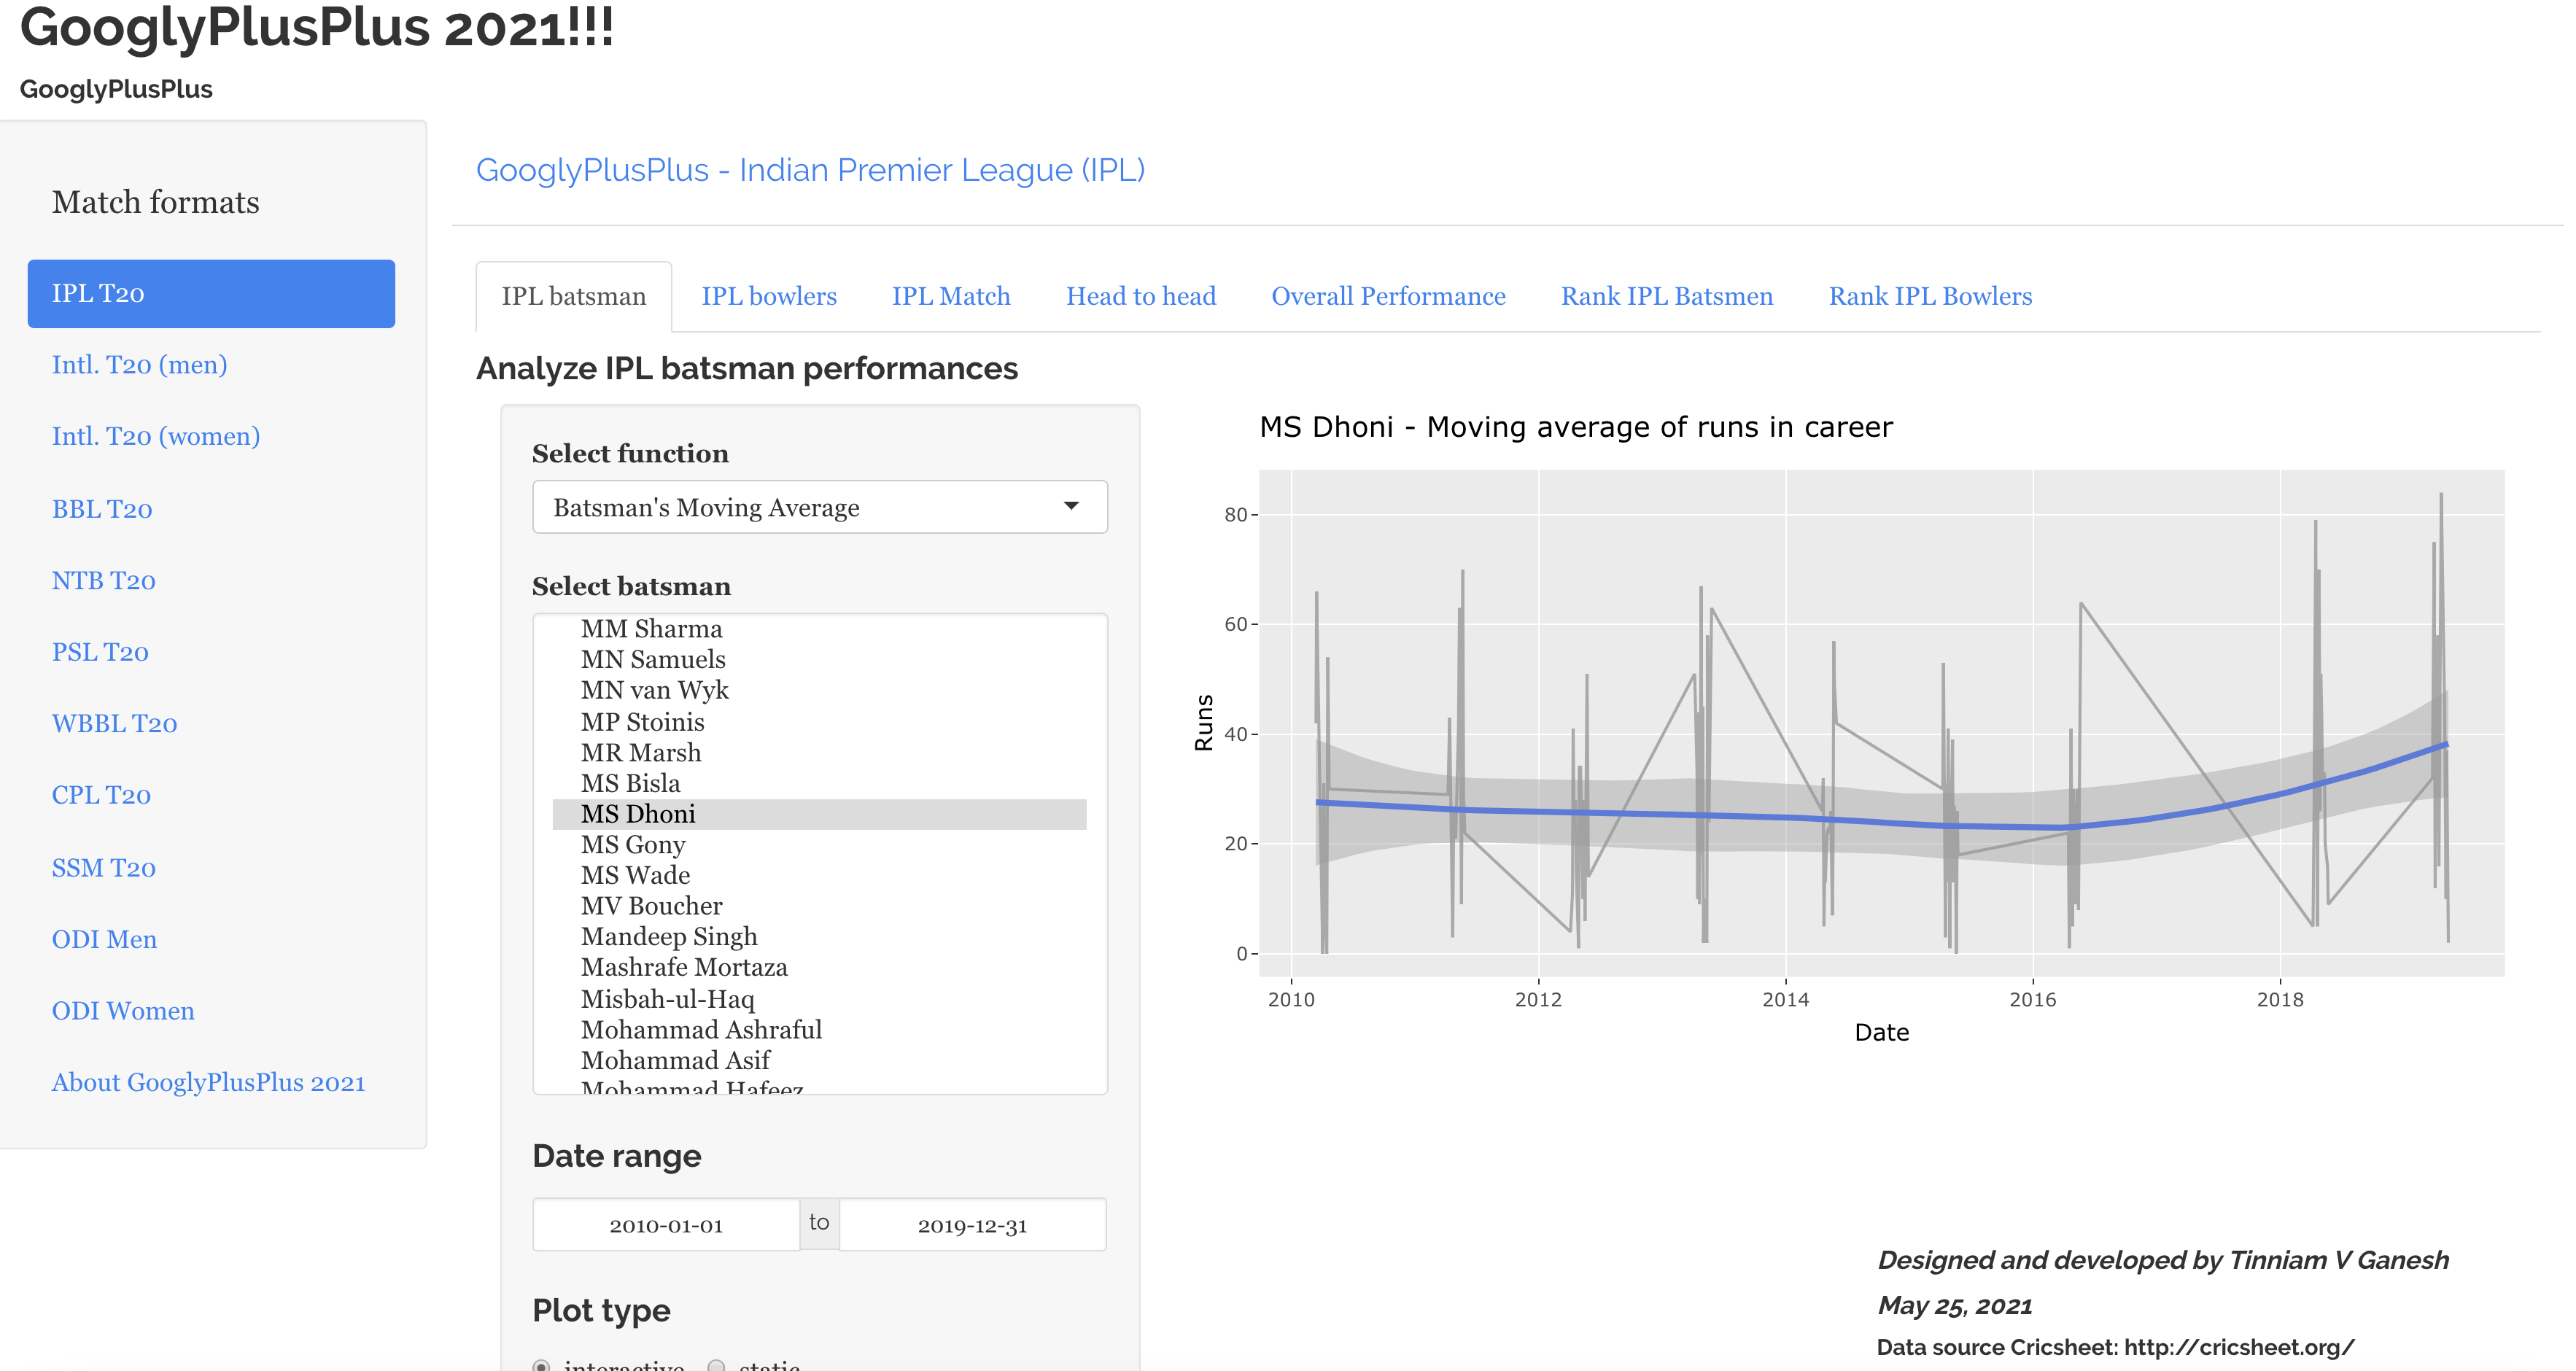
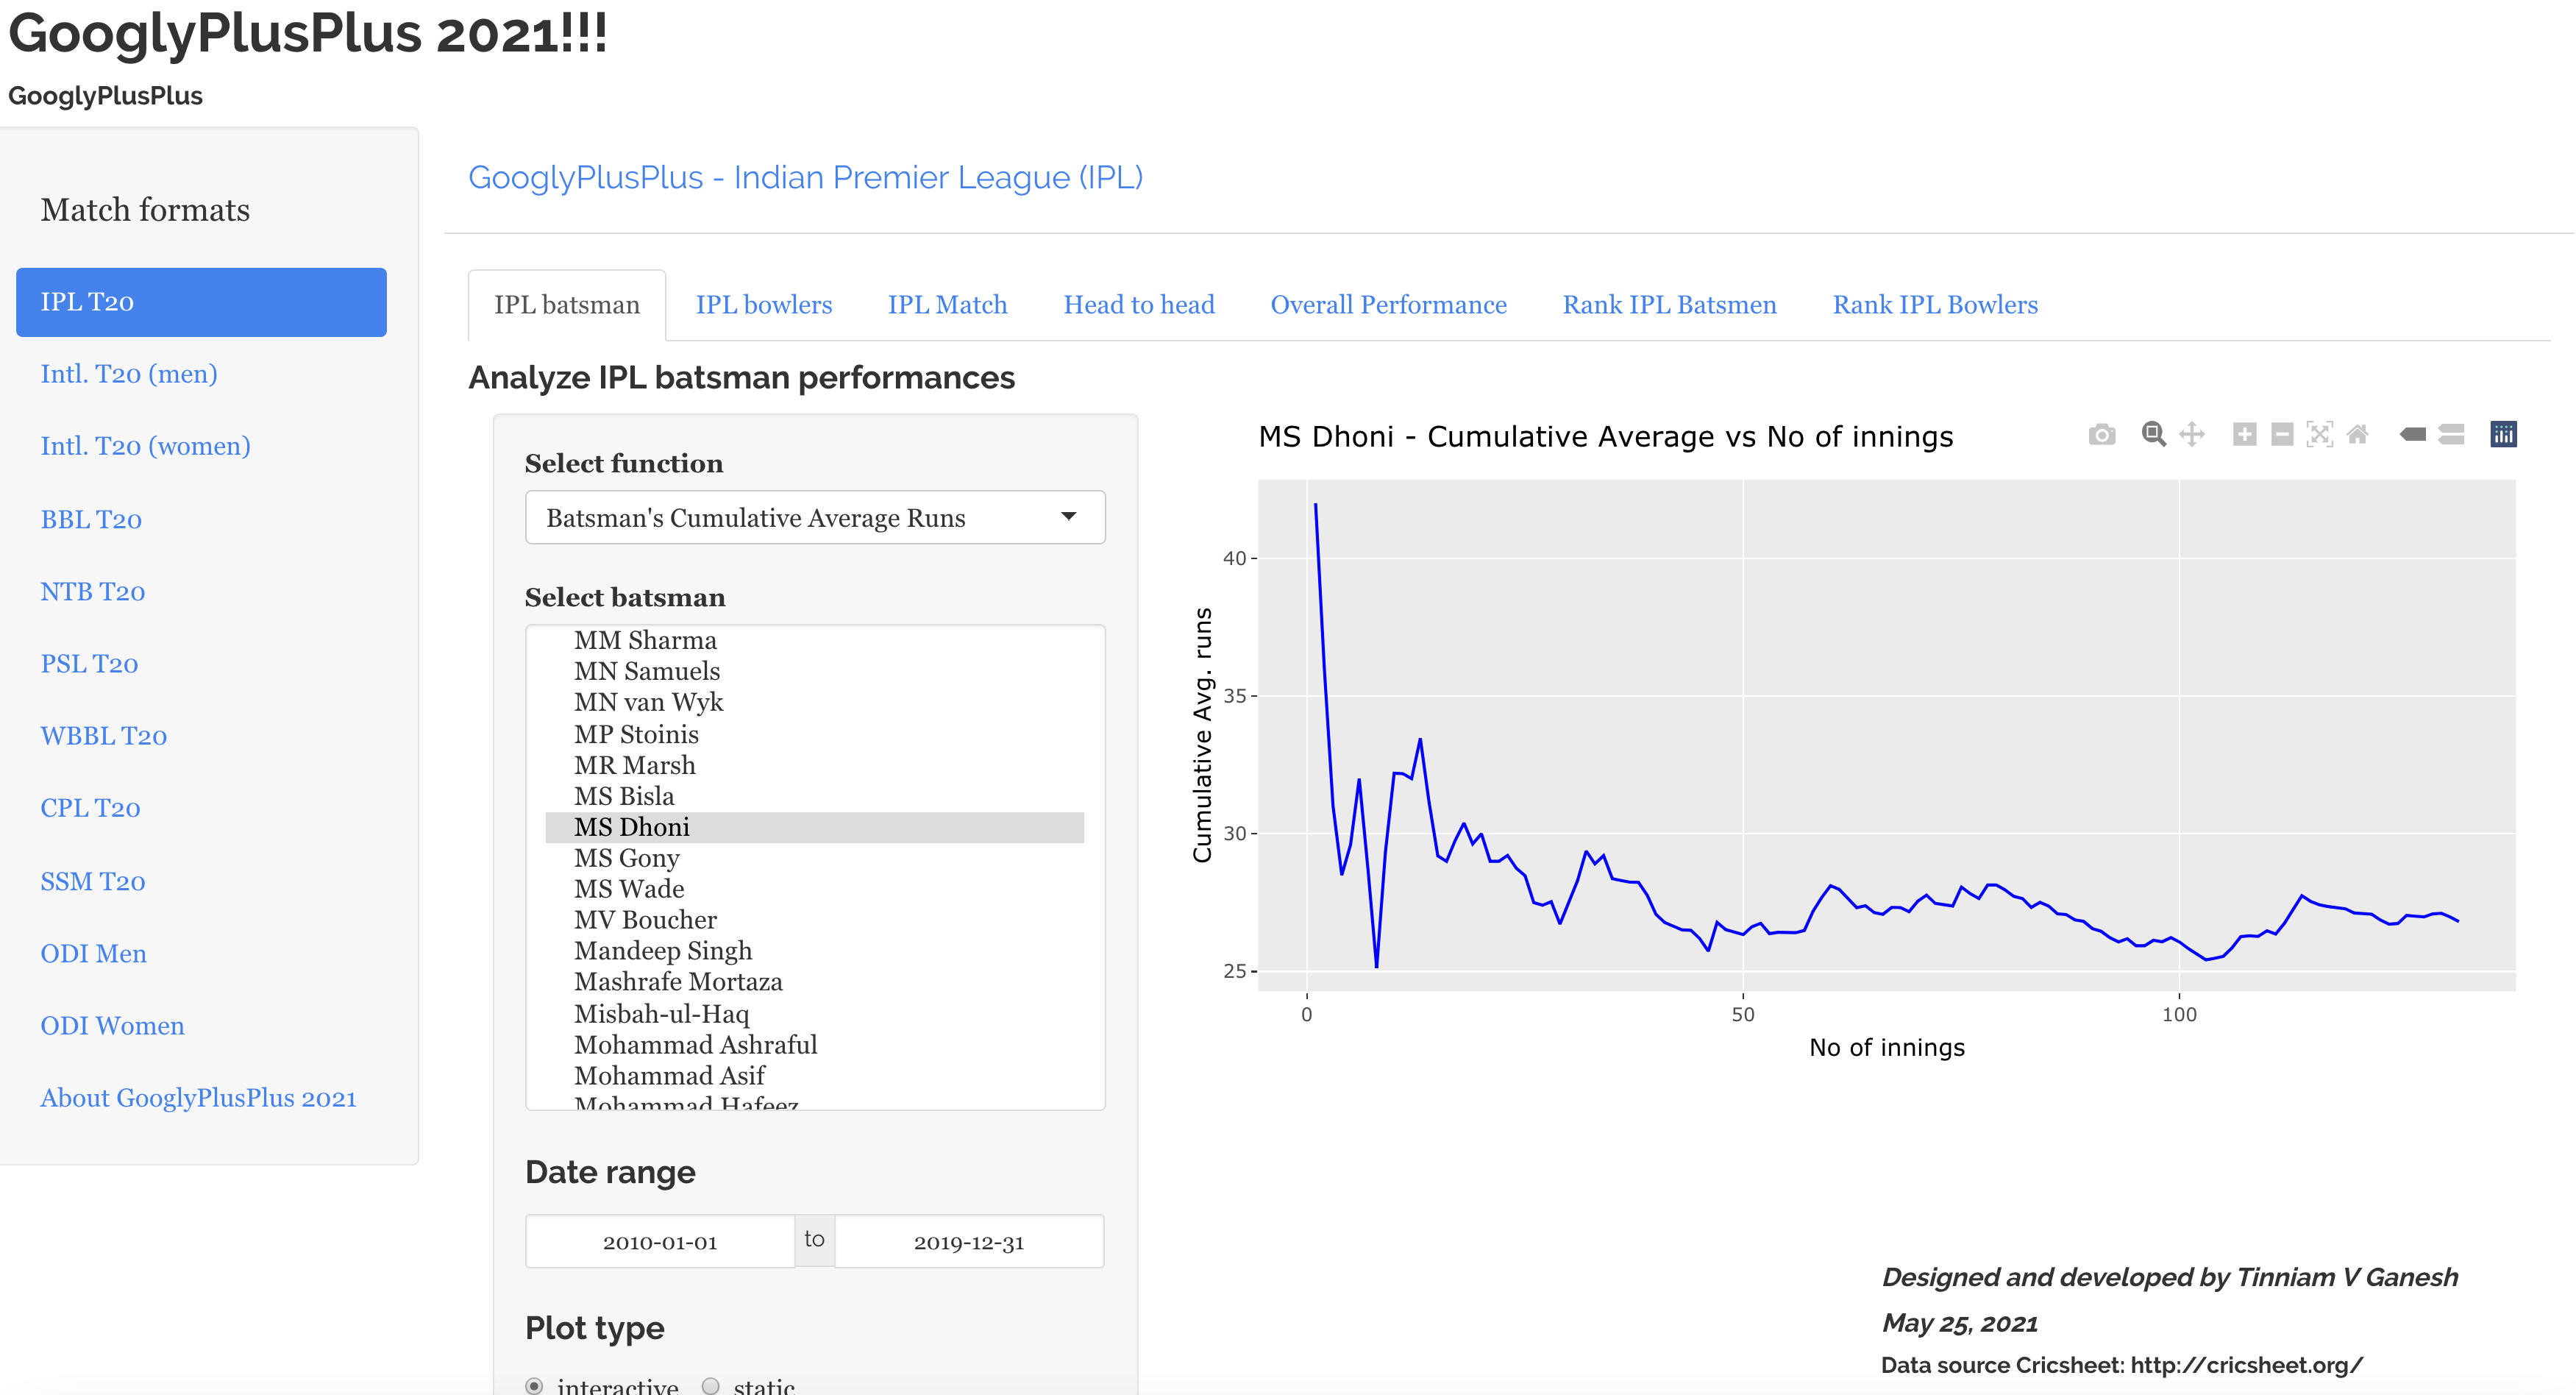
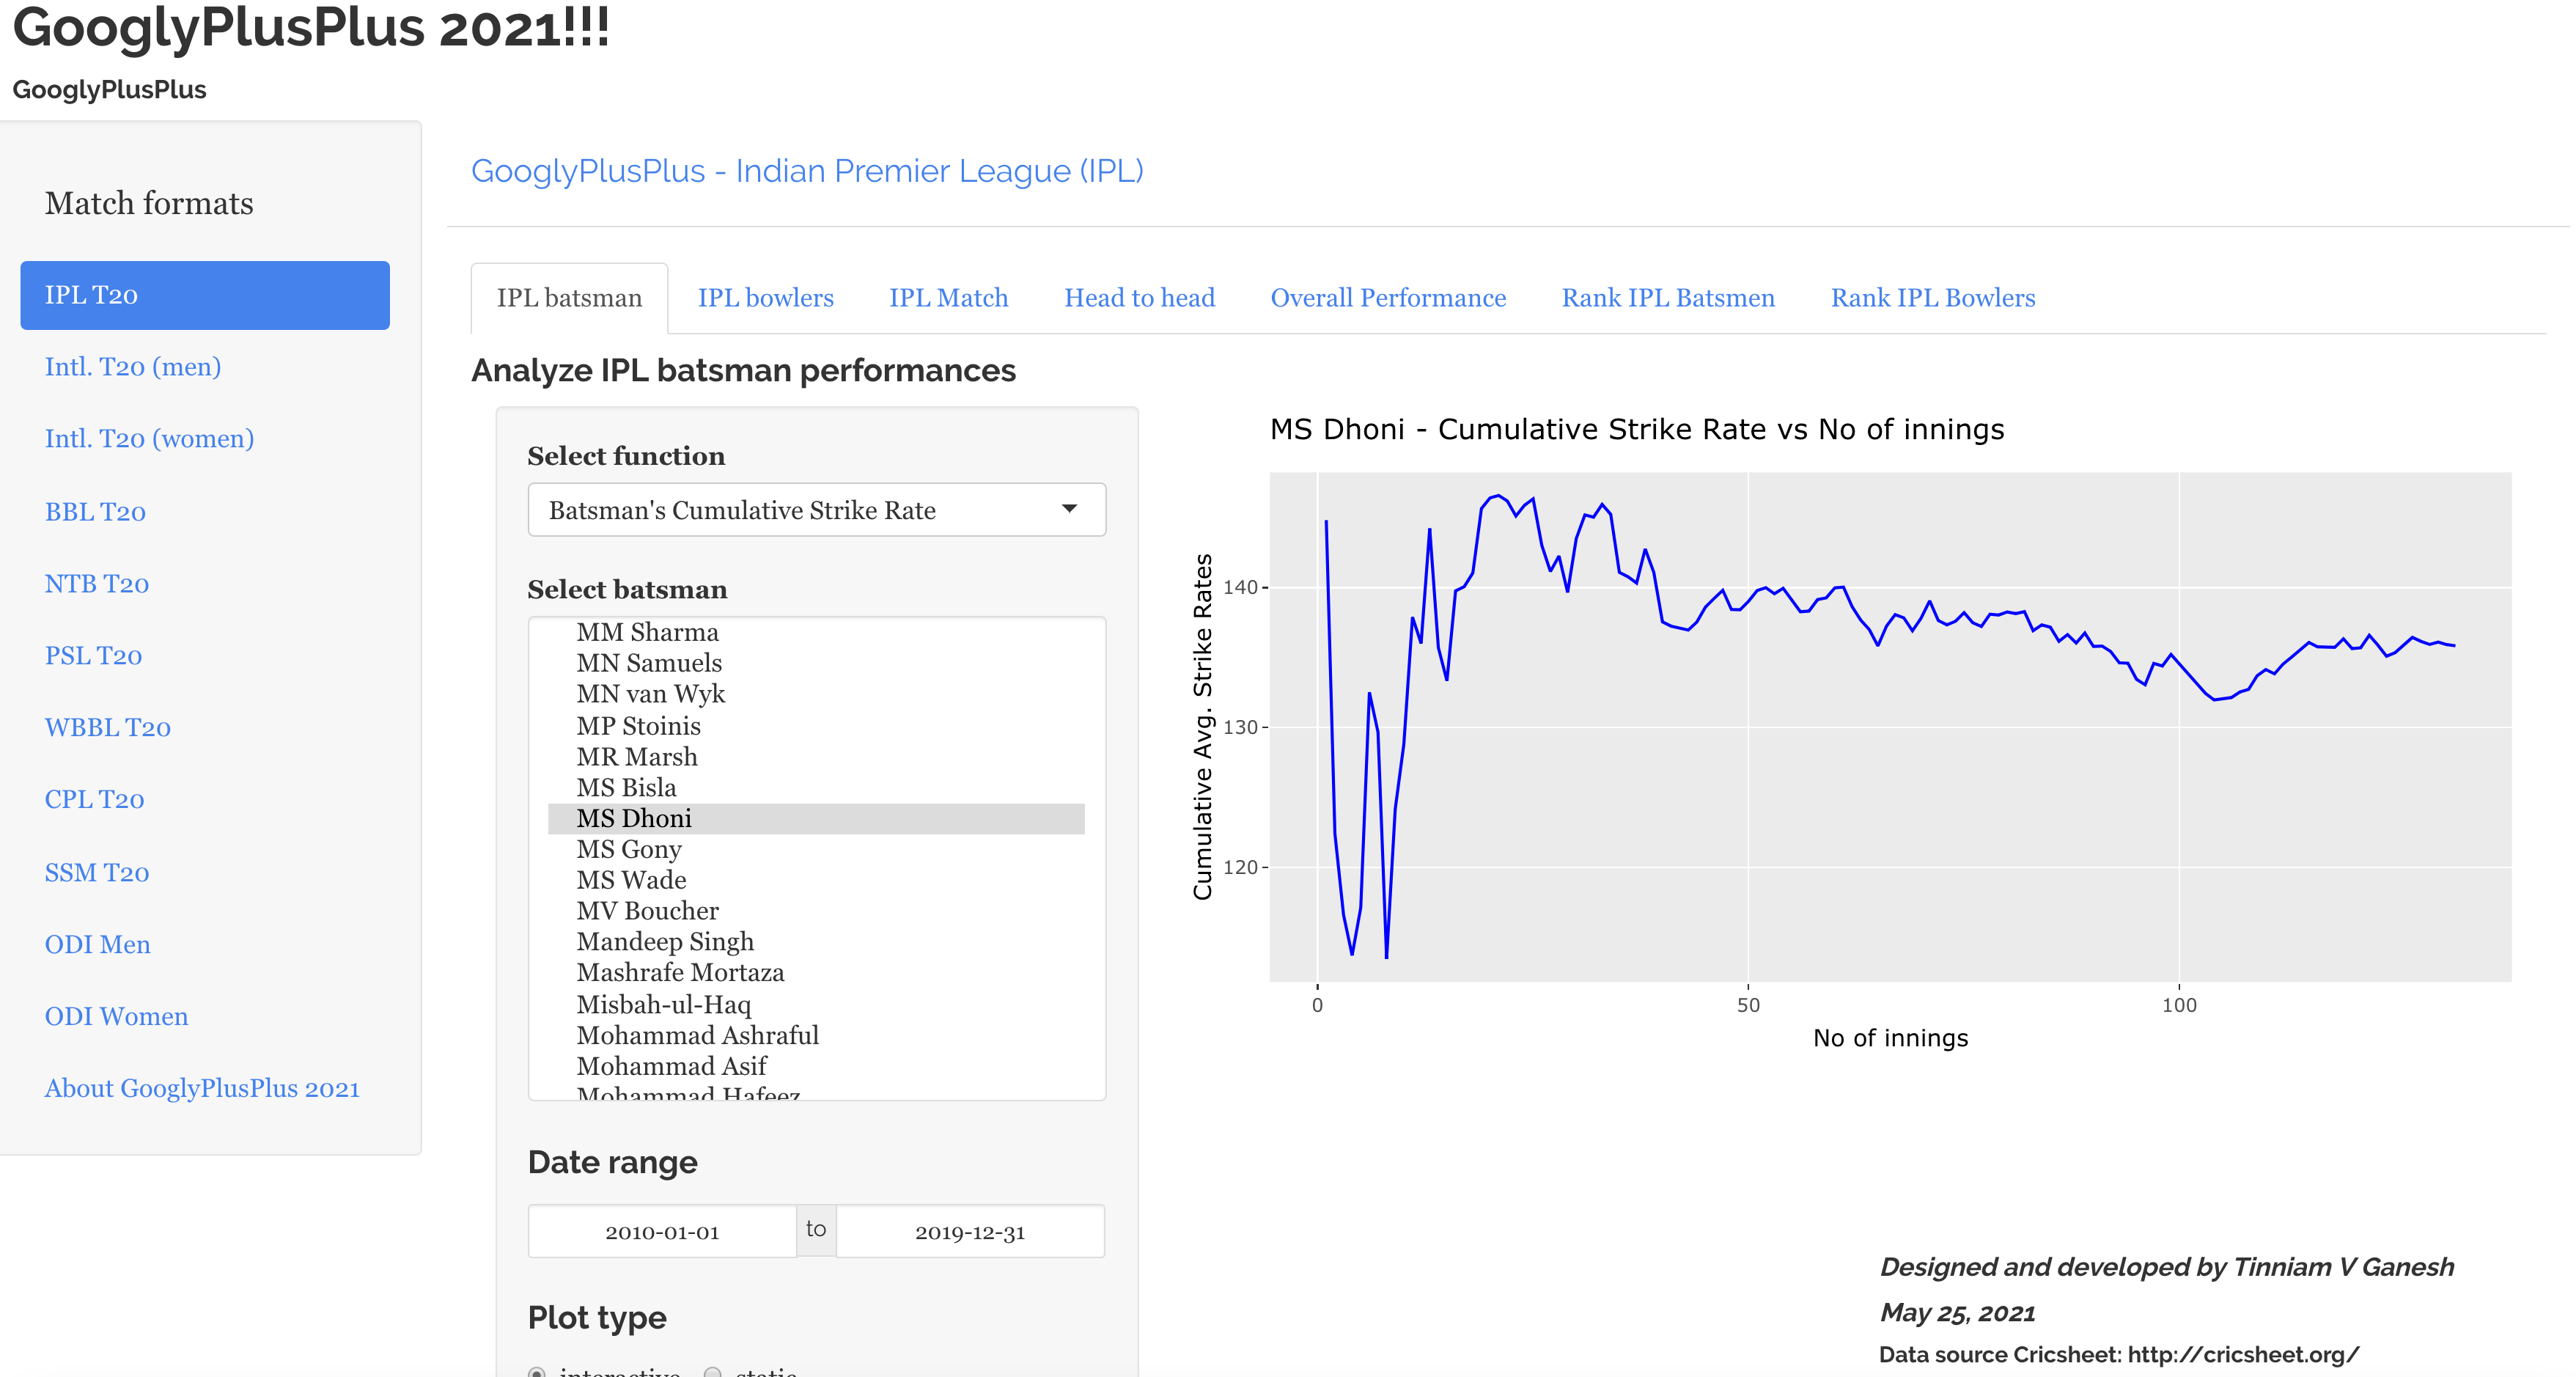
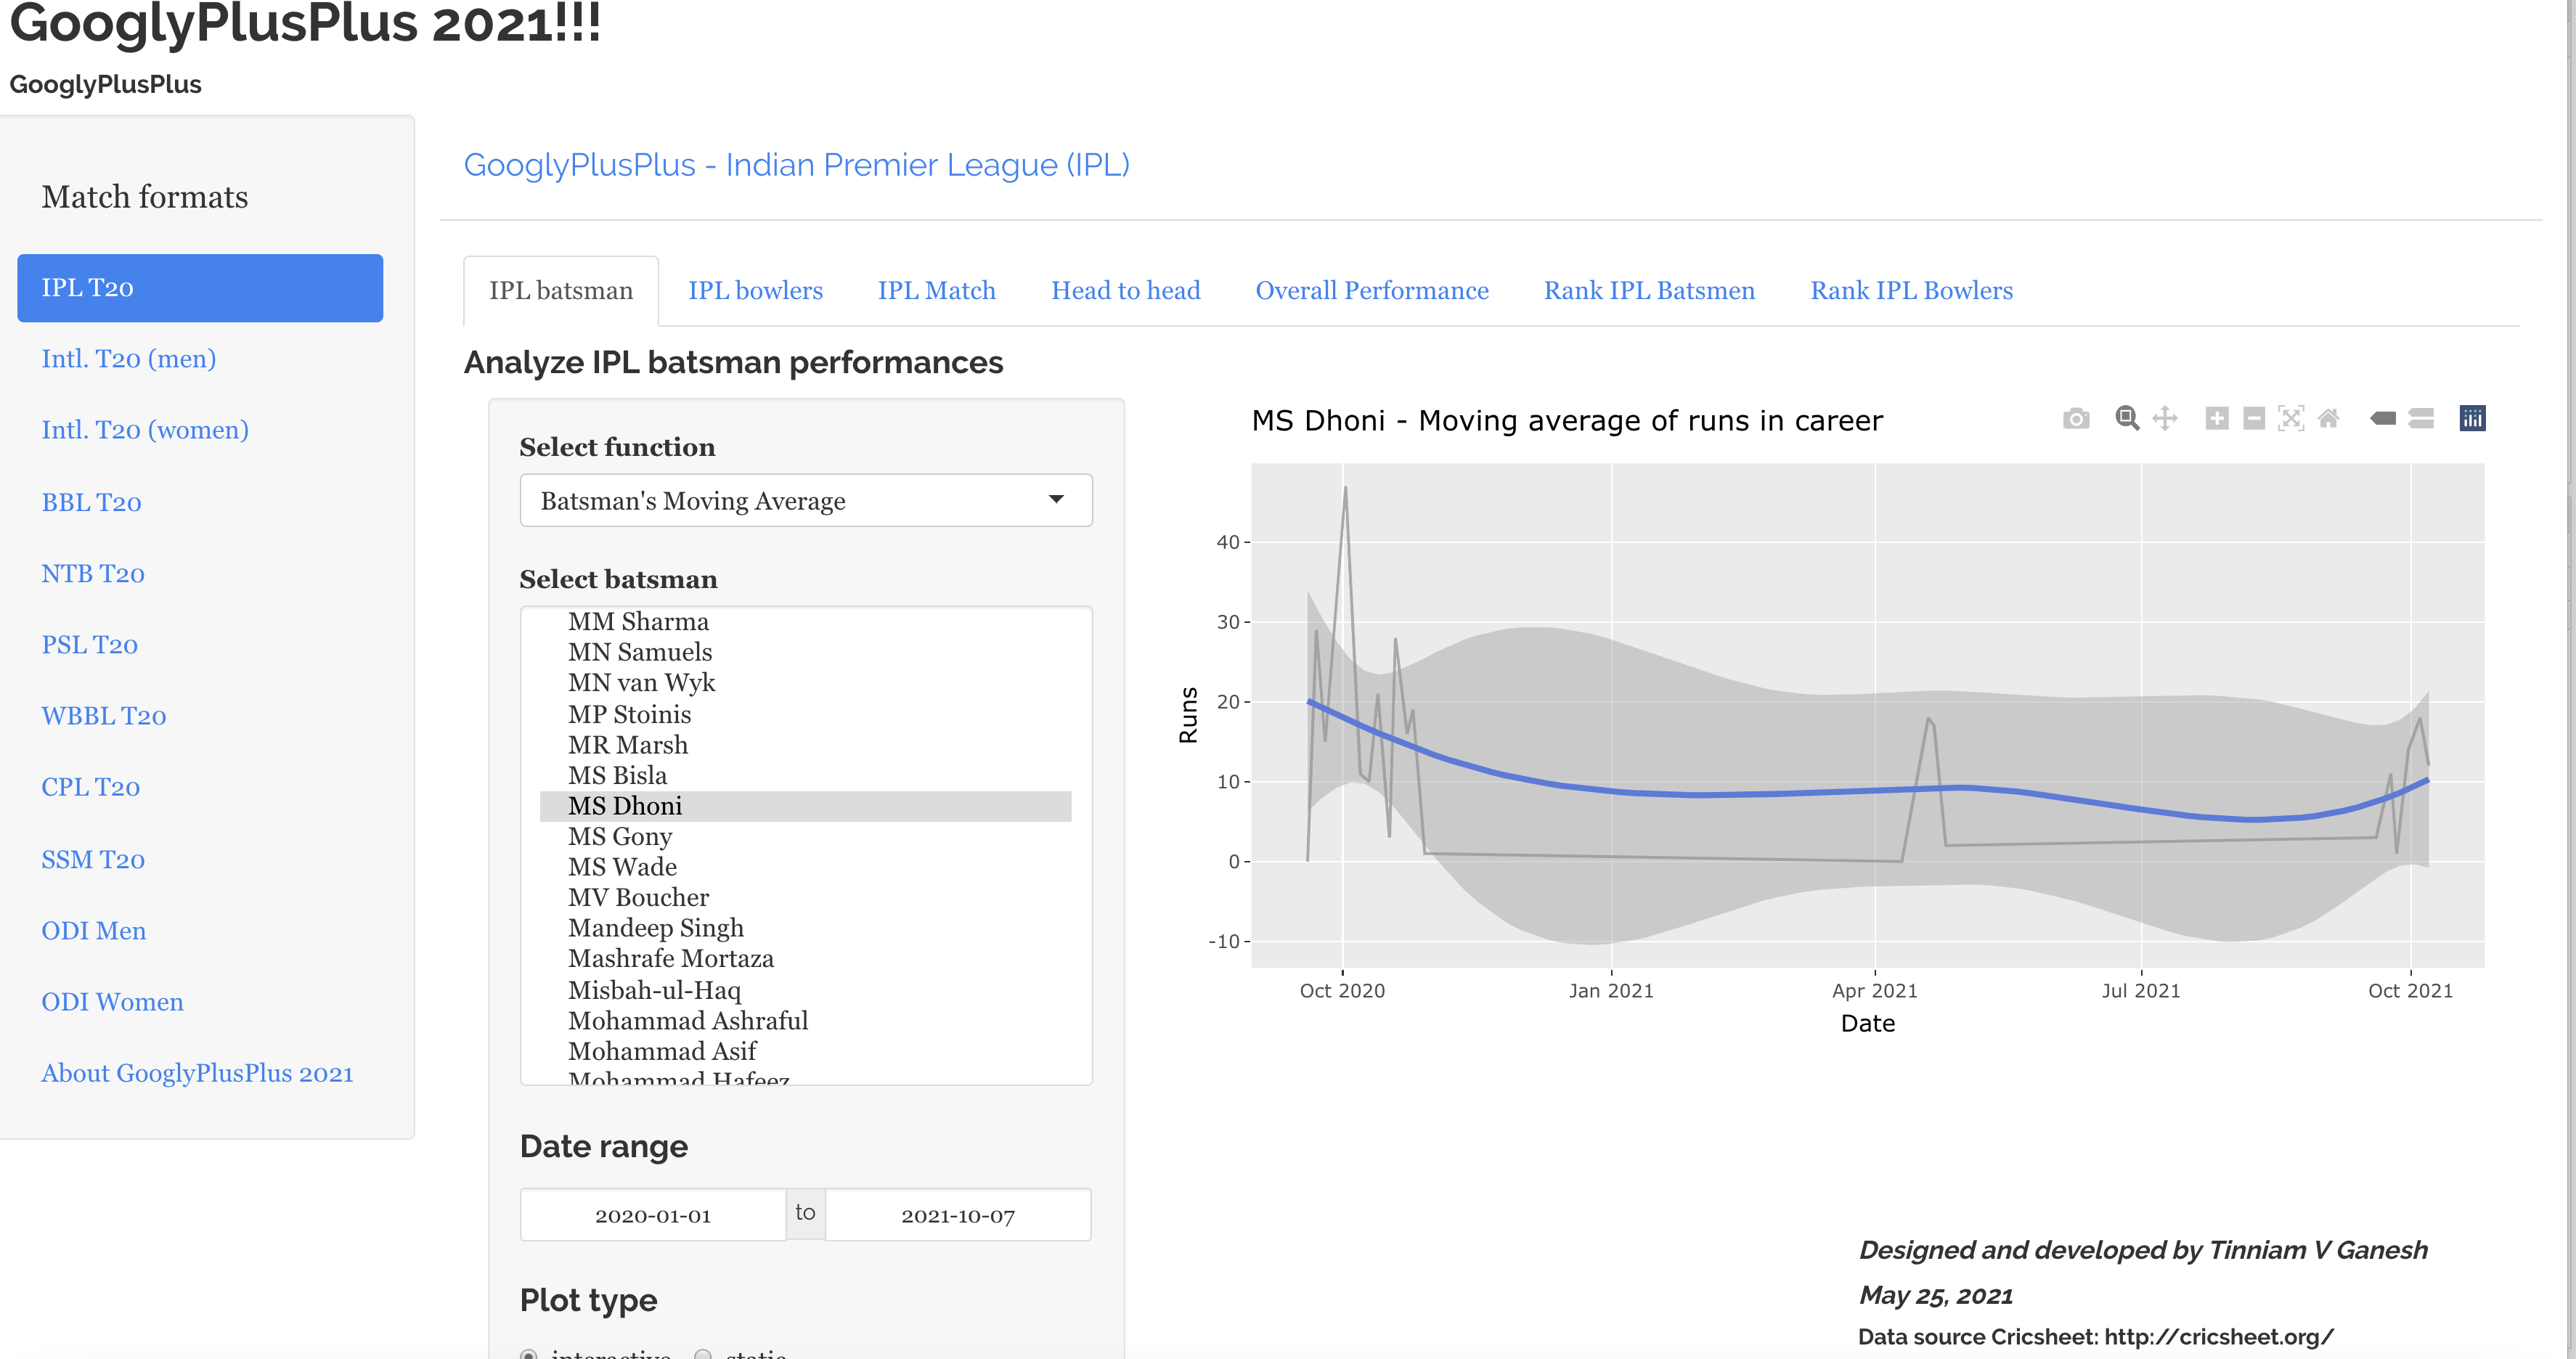
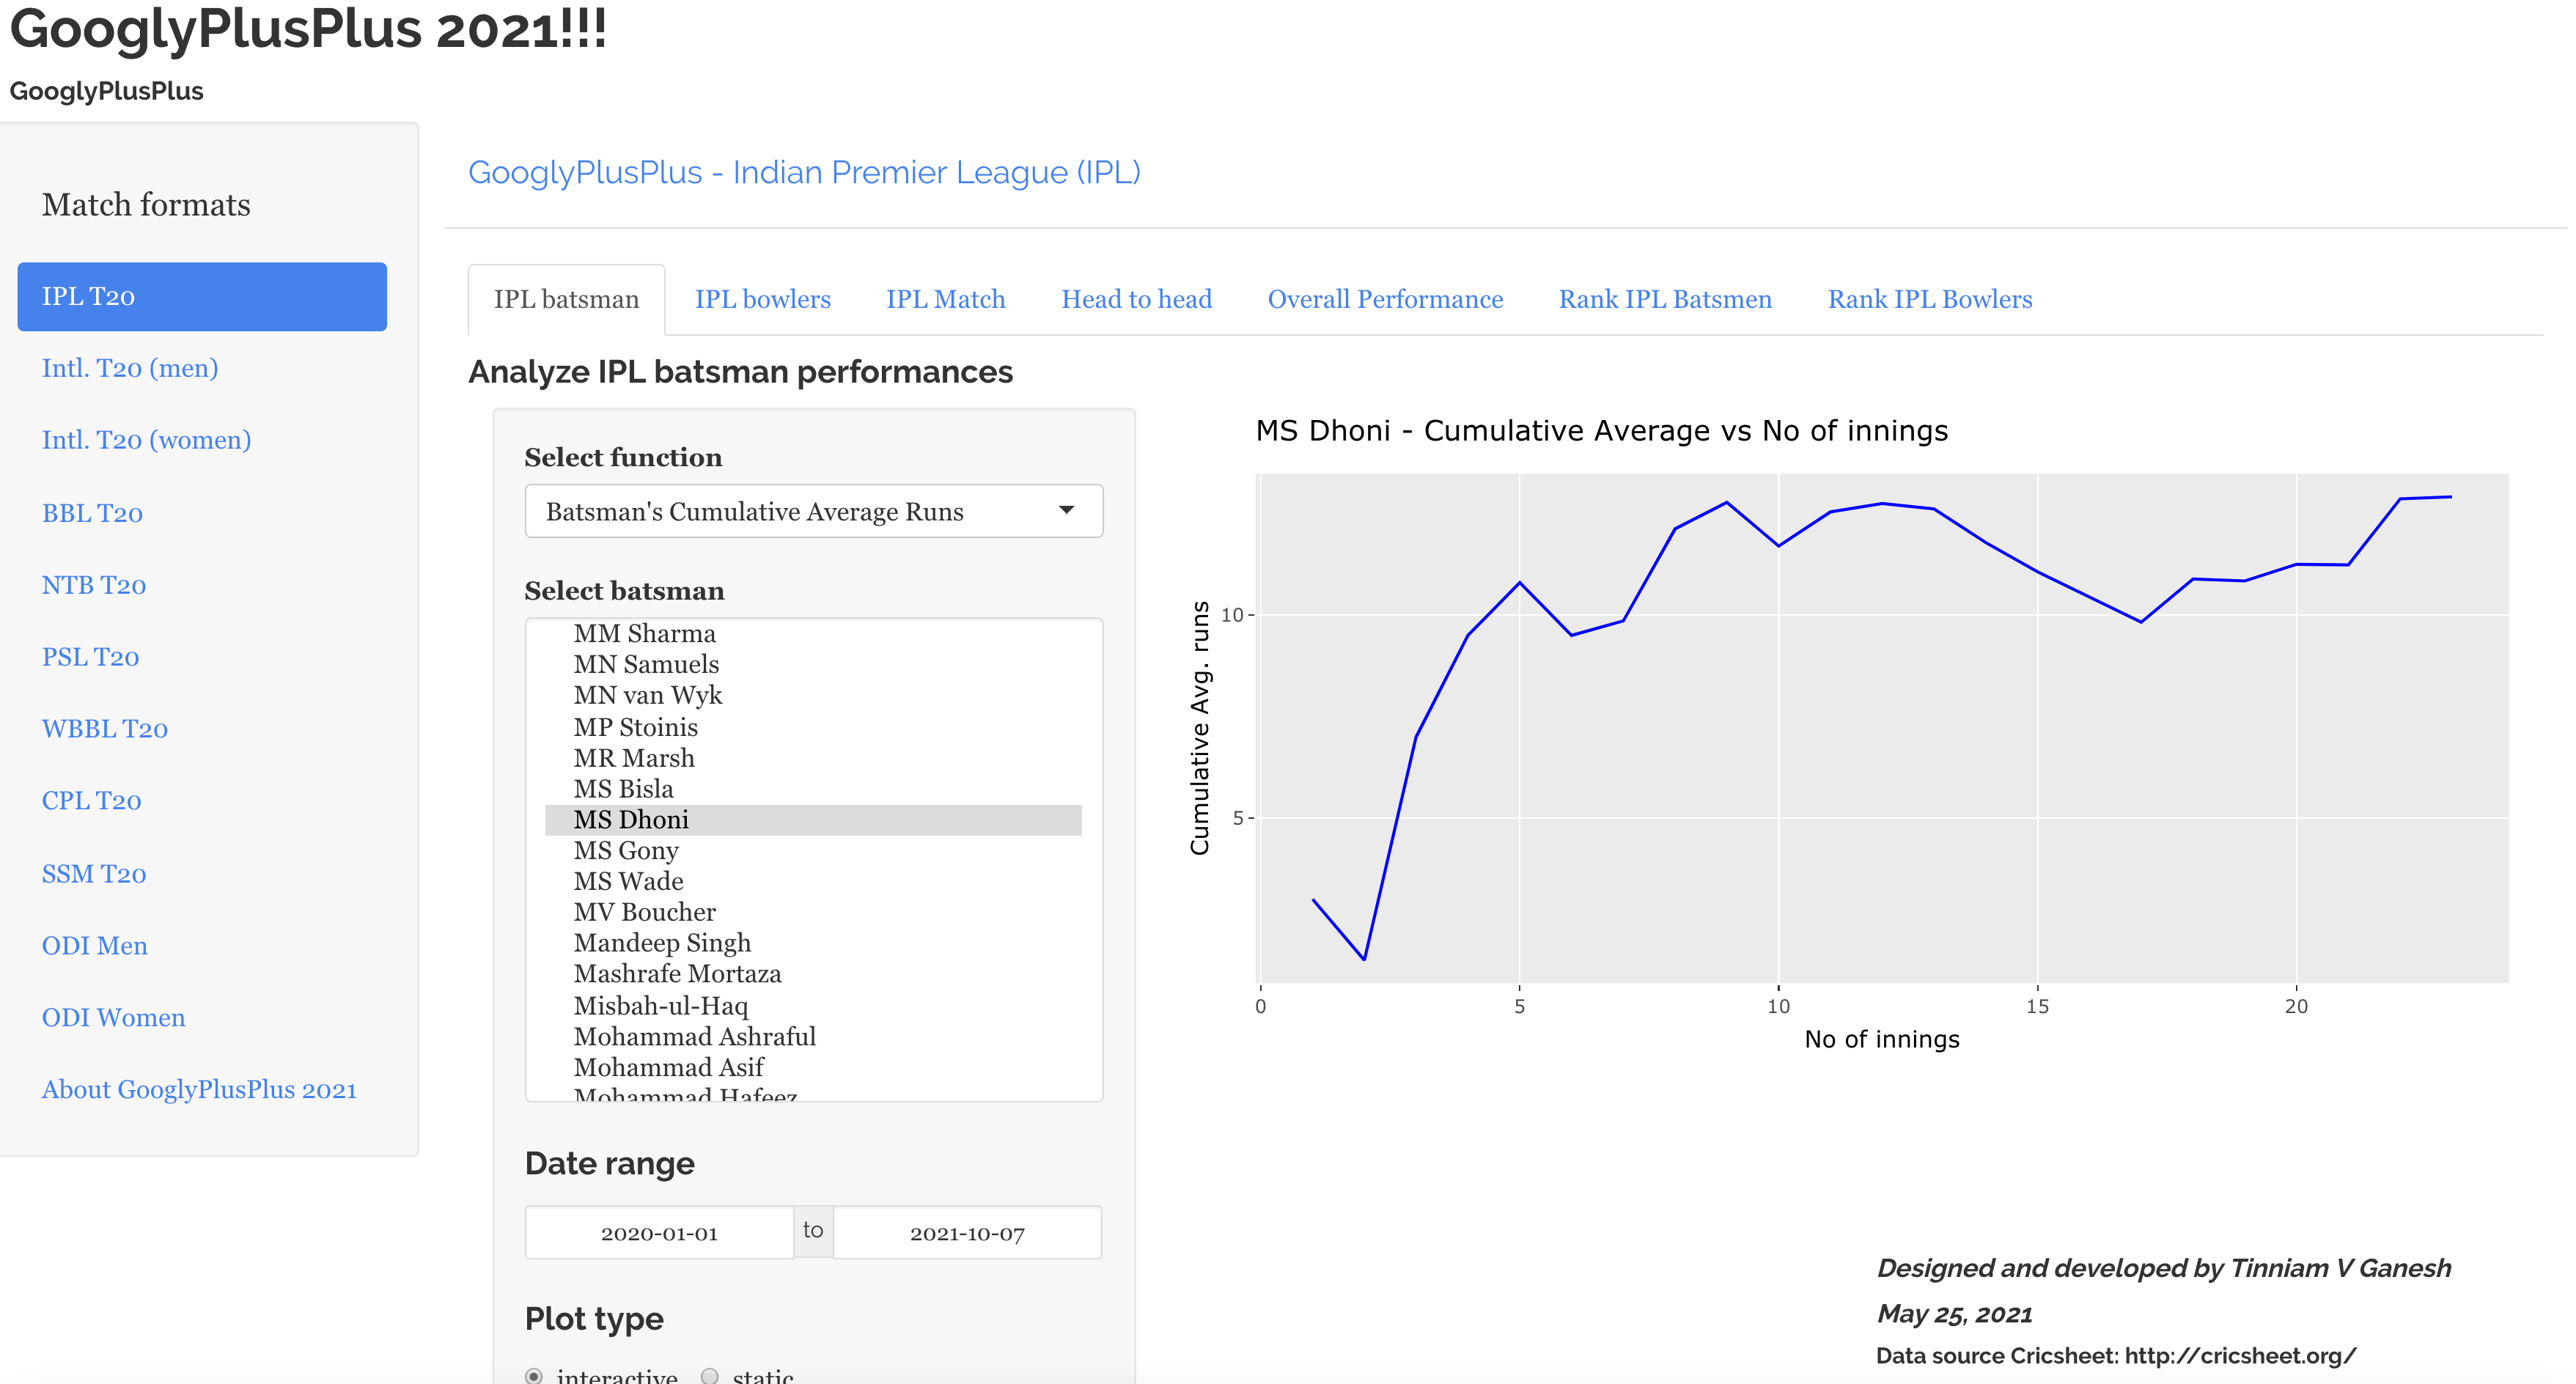
D) M S Dhoni’s performance with the bat pre-2020 and post 2020
There has been a significant decline in Dhoni’s performance in the last couple of years
I) Dhoni’s performance from Jan 2010 to Dec 2019
a) Moving average at 25+(Dhoni before)
The moving average actually moves up…
b) Cumulative average at 25+(Dhoni before)
c) Cumulative Strike rate 140+ (Dhoni before)
d) Dhoni’s moving average is ~10-12 (post 2020)
e) Dhoni’s cumulative average (post 2020)
f) Dhoni’s strike rate ~80 (post 2020)
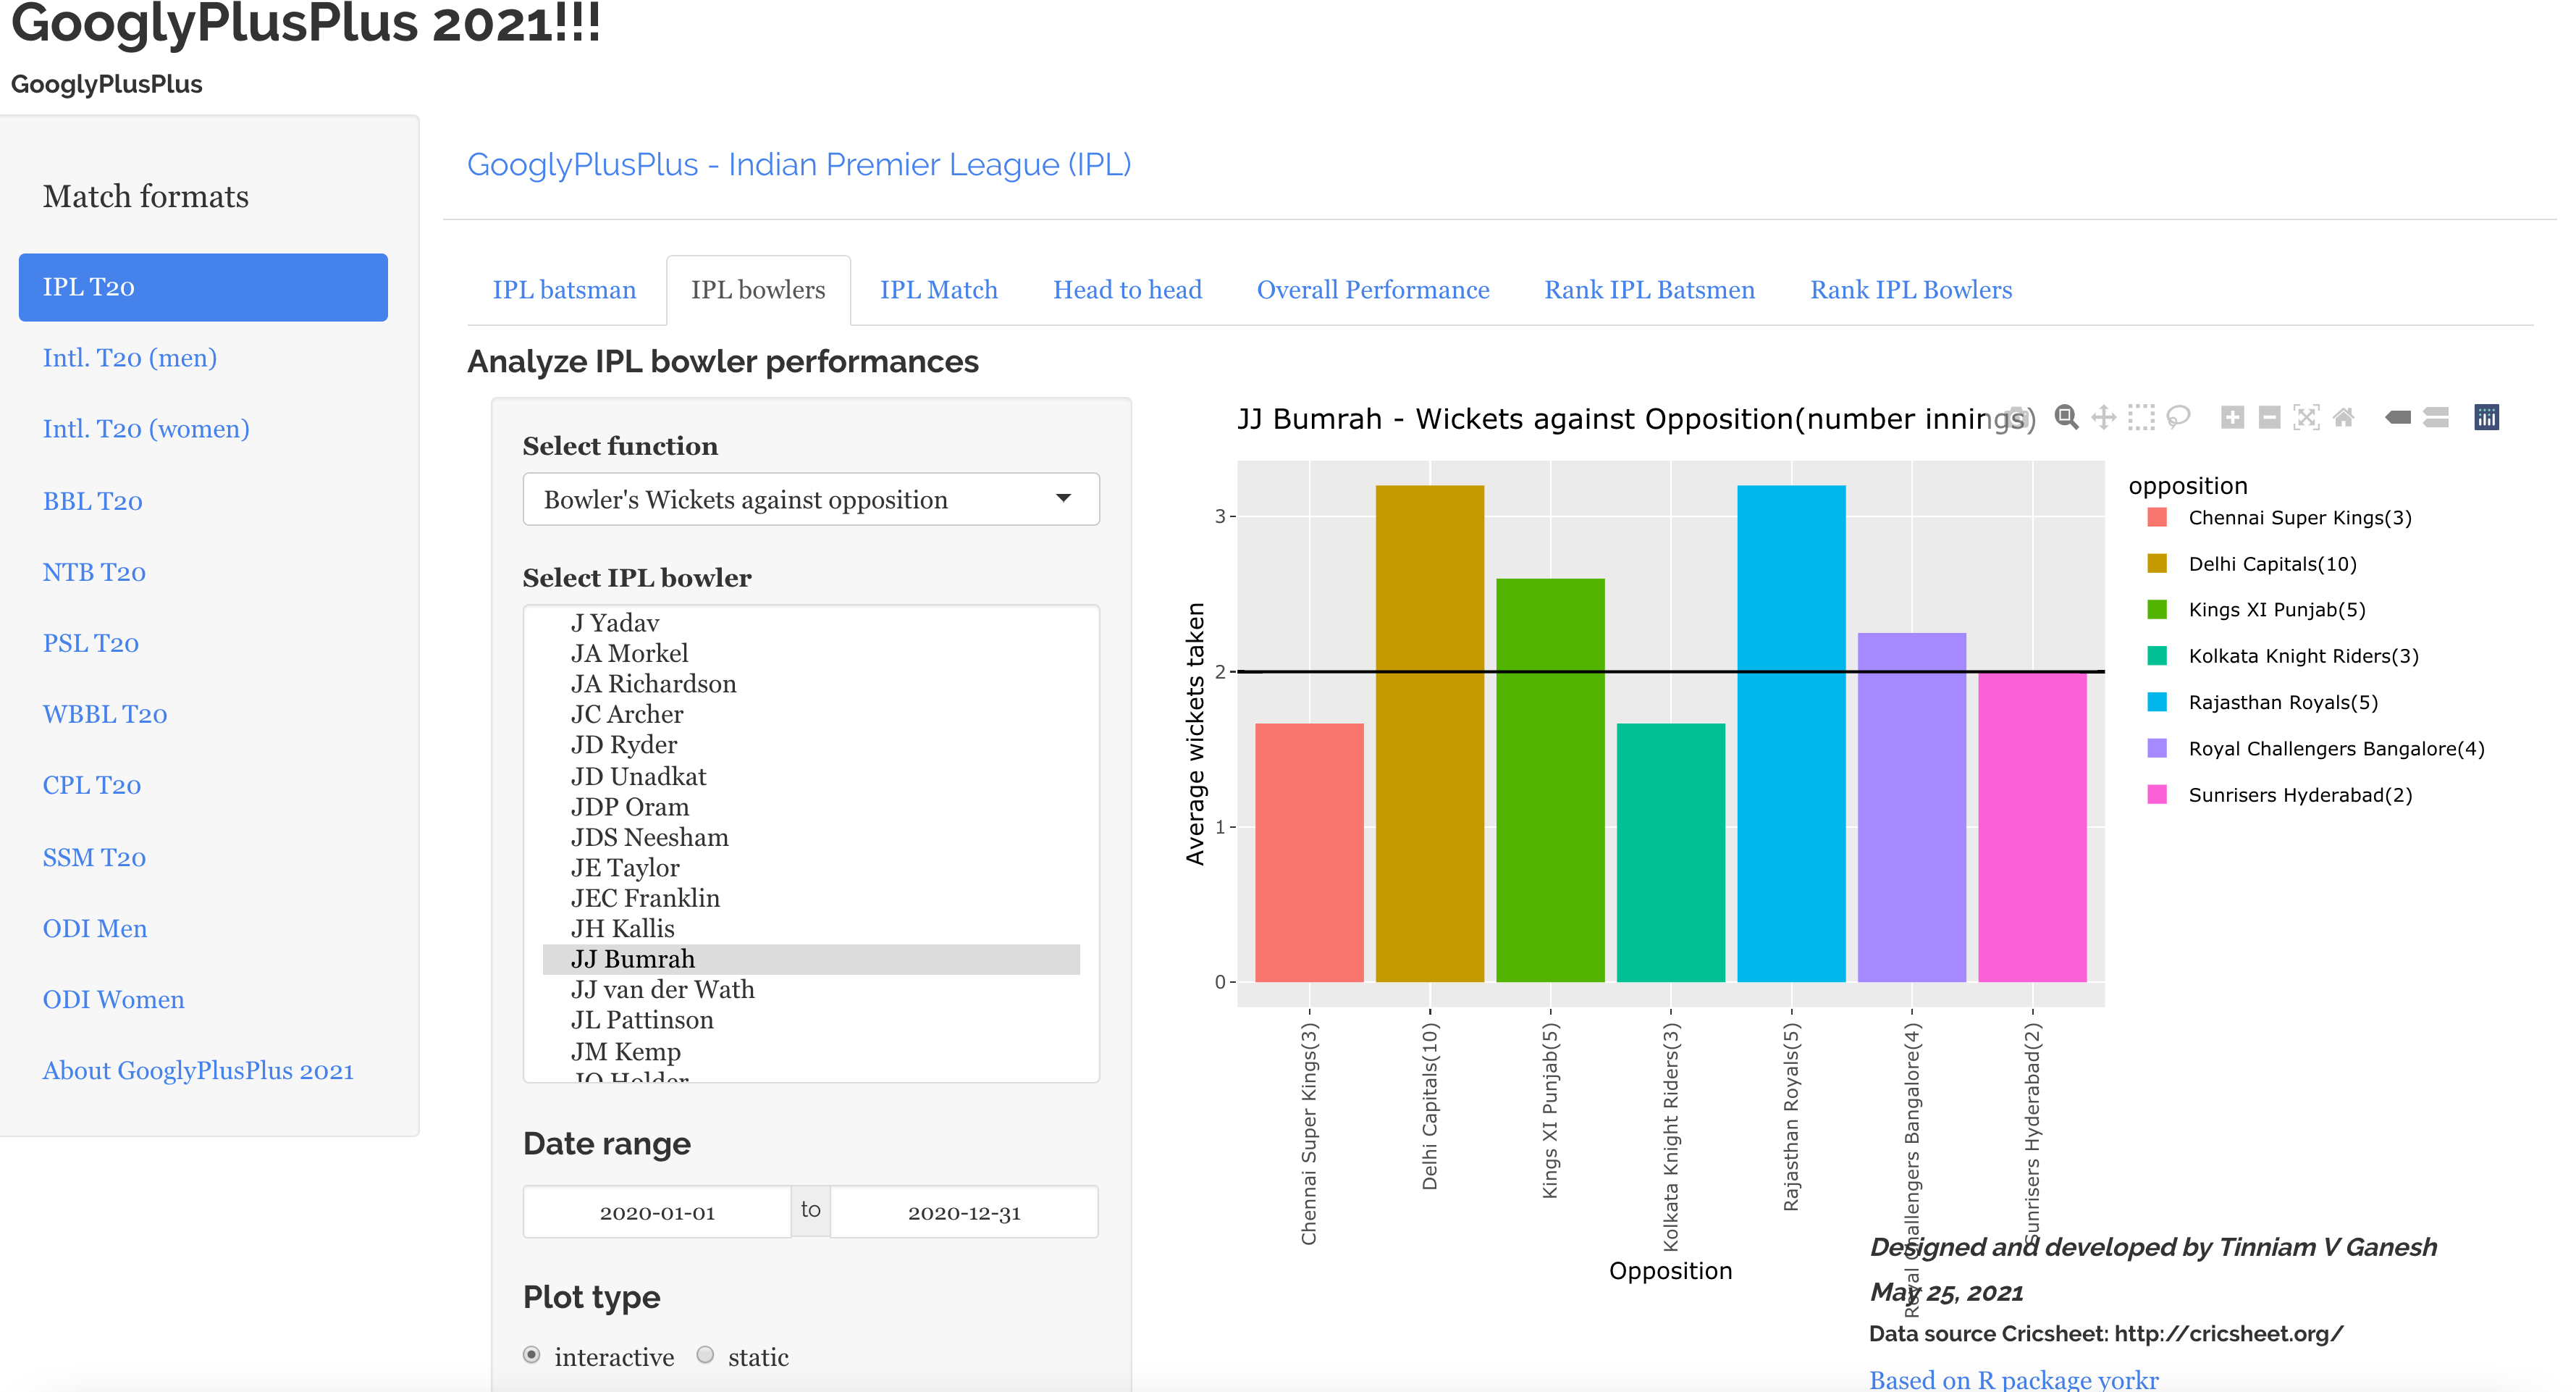
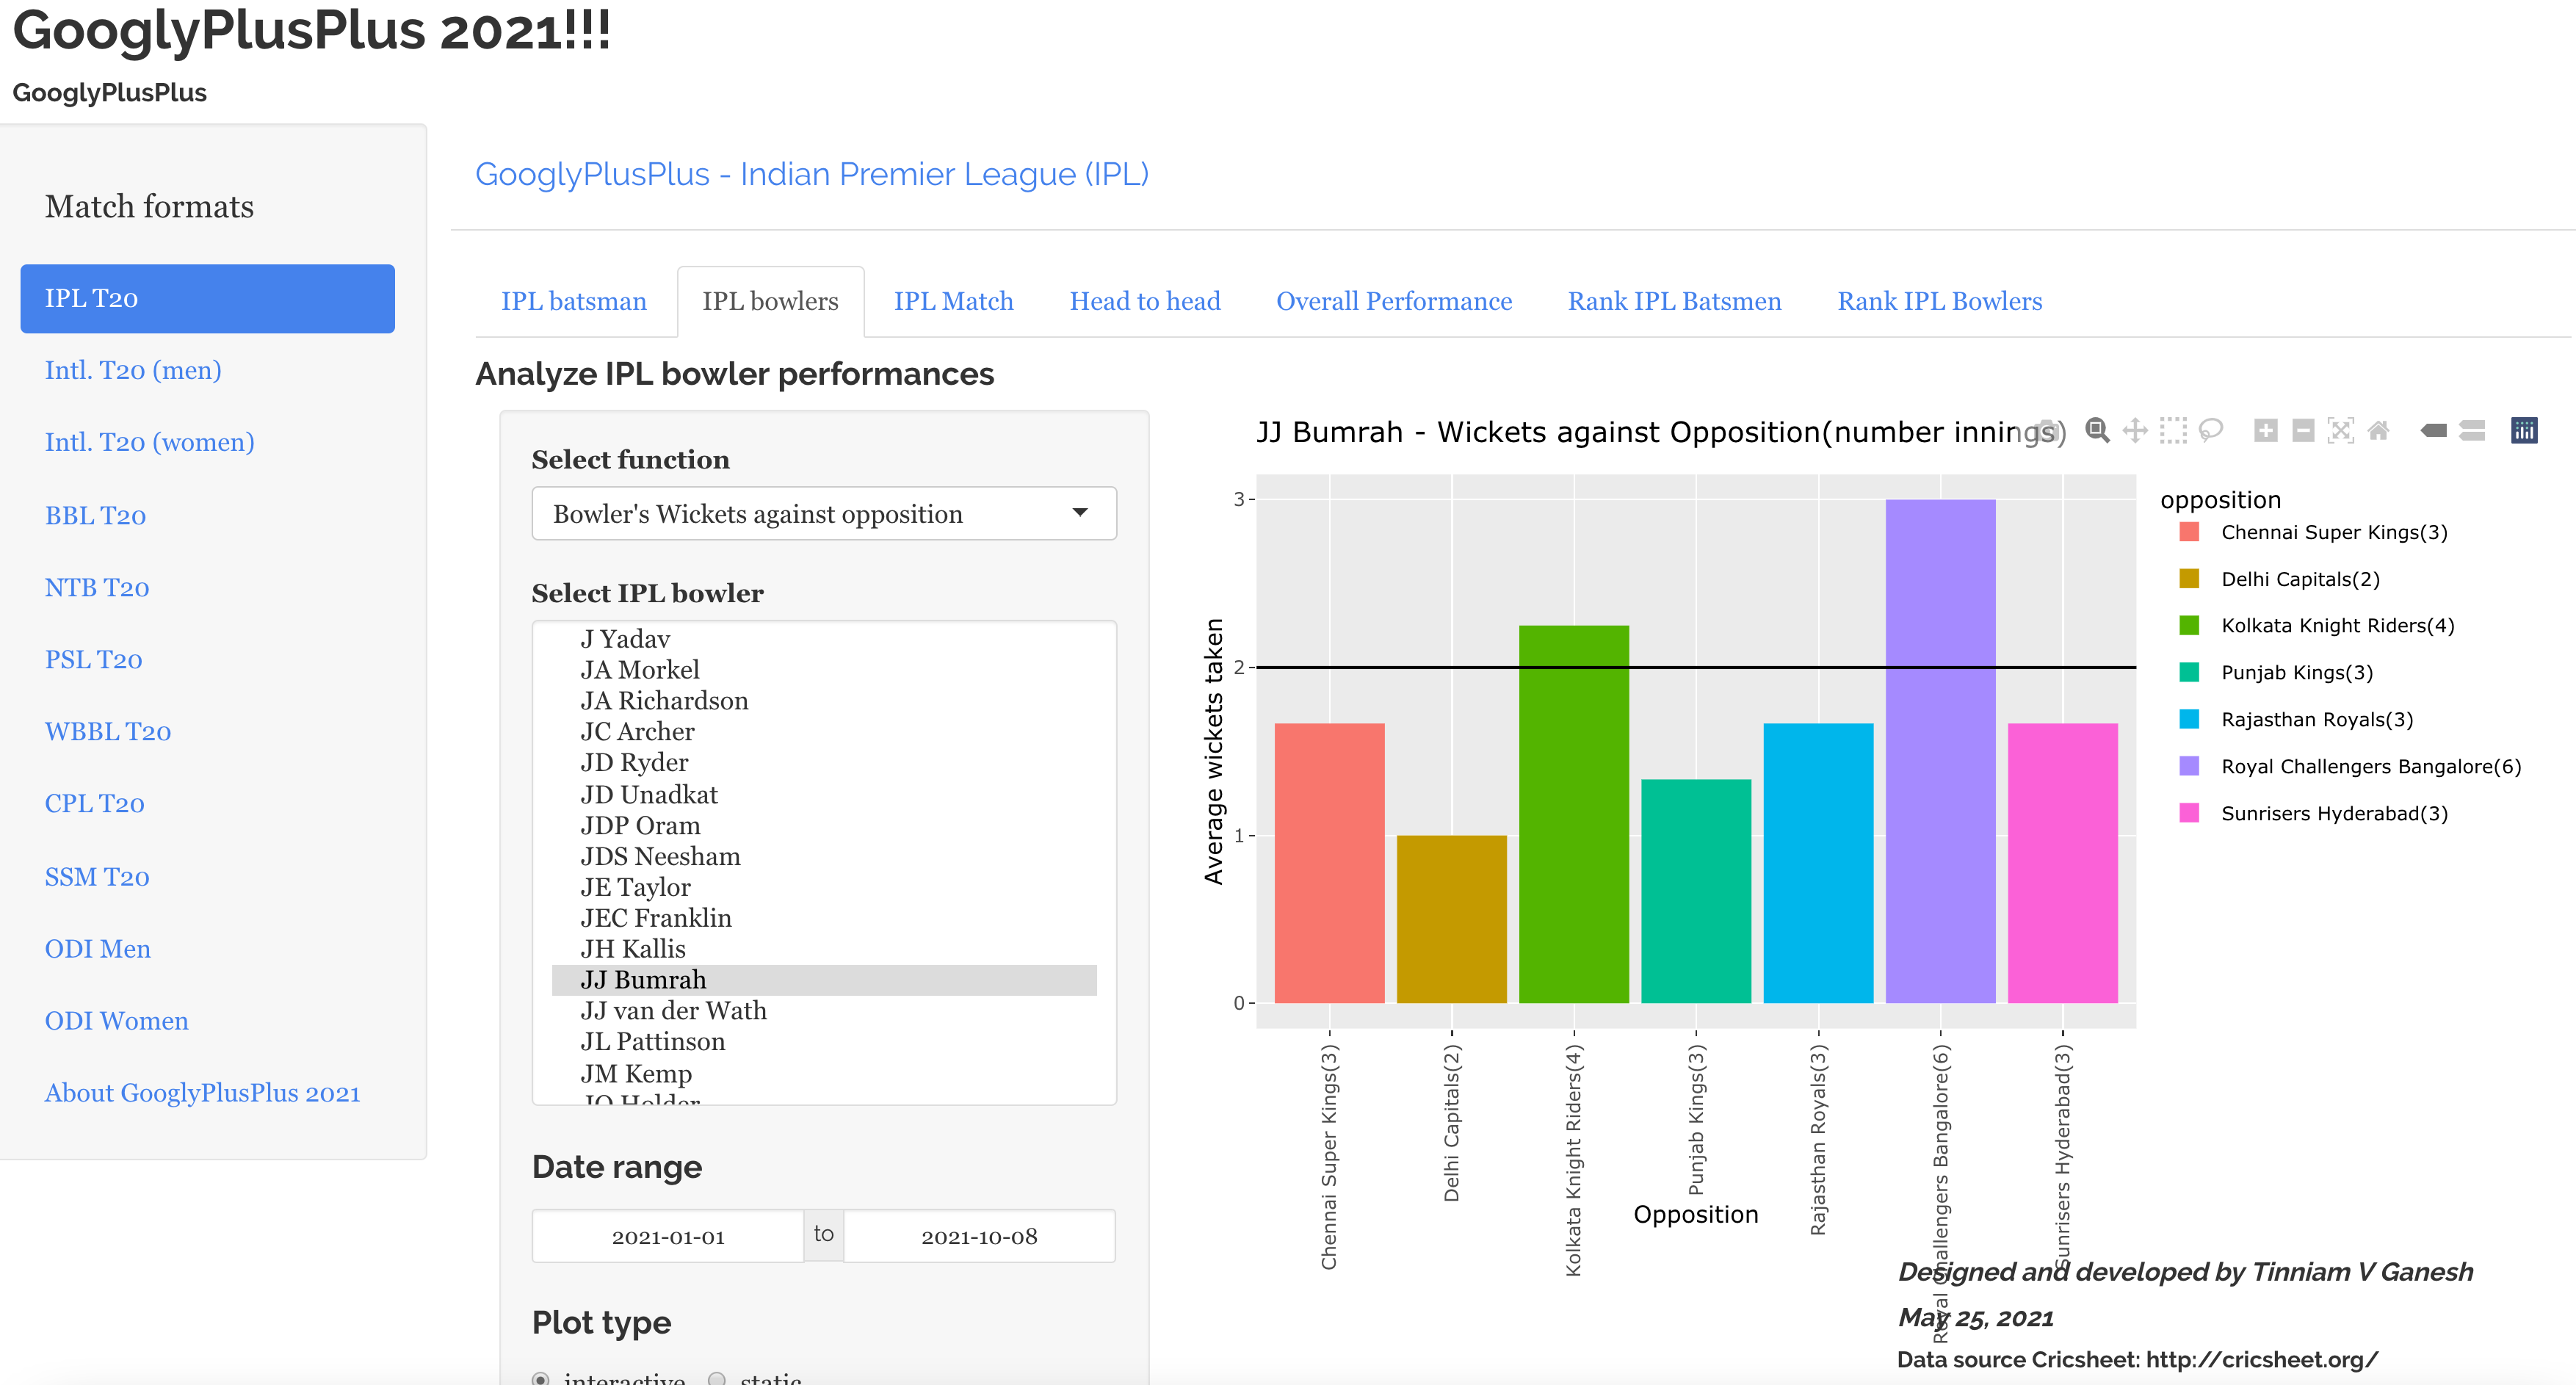
E) Bumrah’s performance in IPL
a) Bumrah’s performance in IPL 2020
b) Bumrah’s performance in IPL 2021
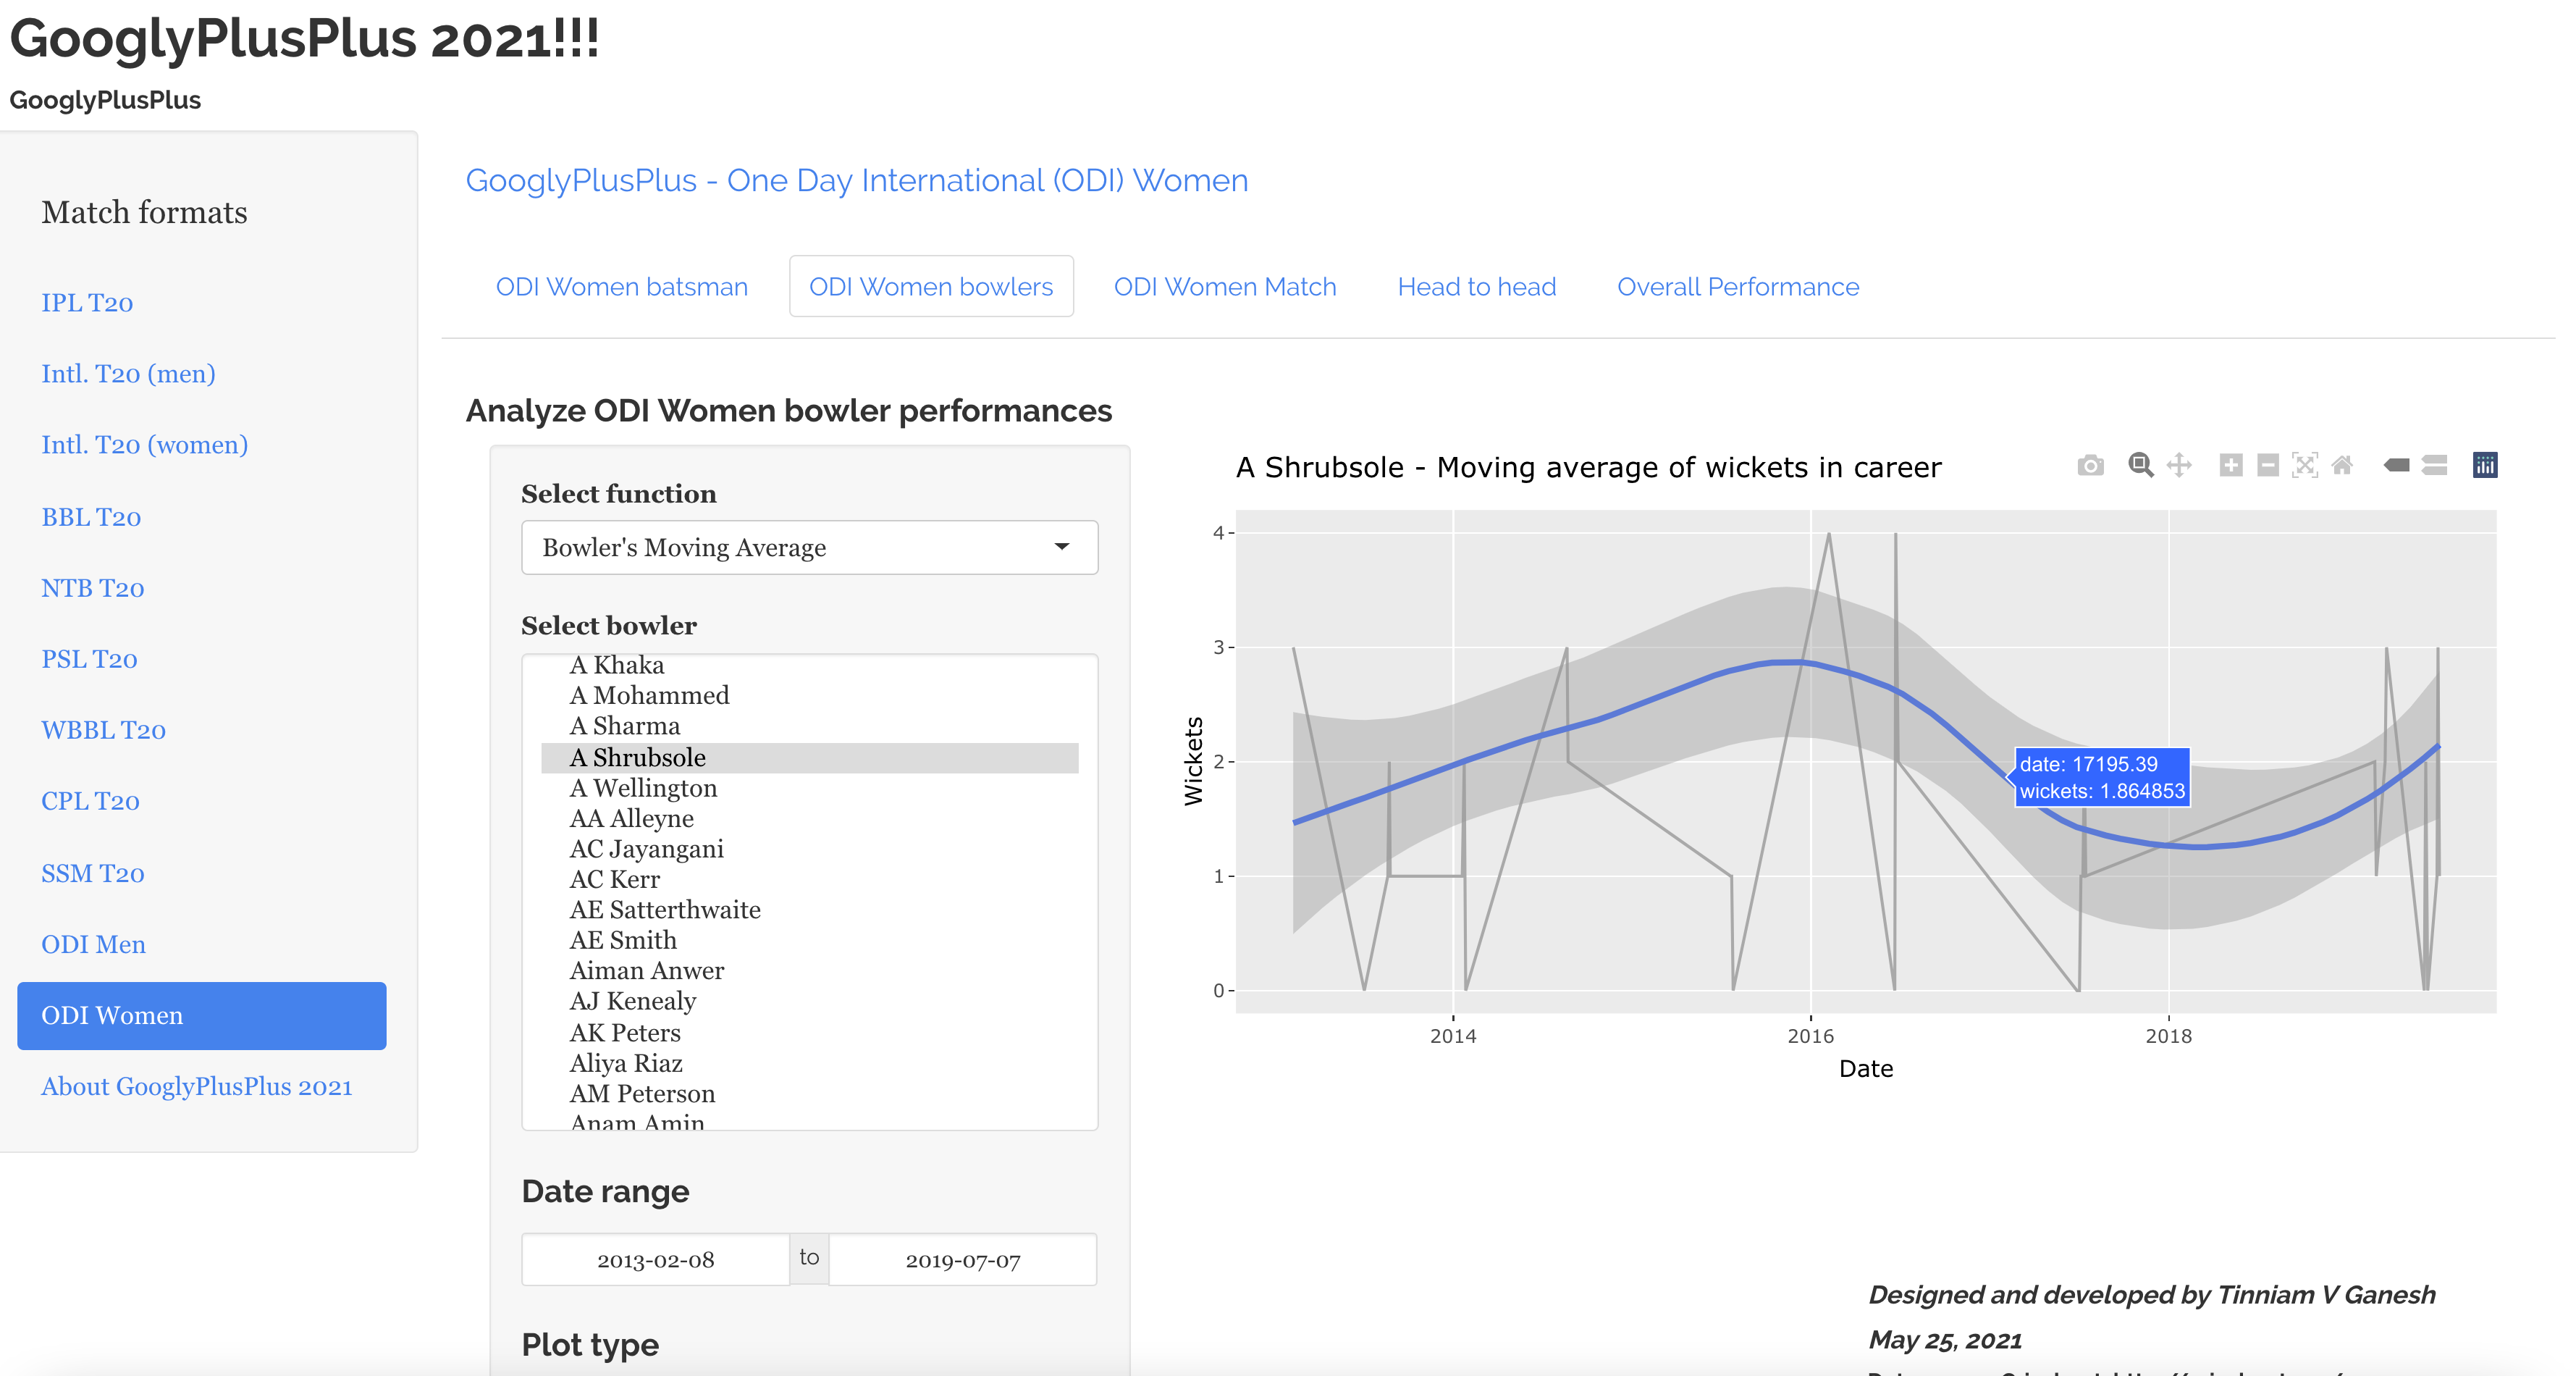
F) Moving average wickets for A. Shrubsole in ODI (women)
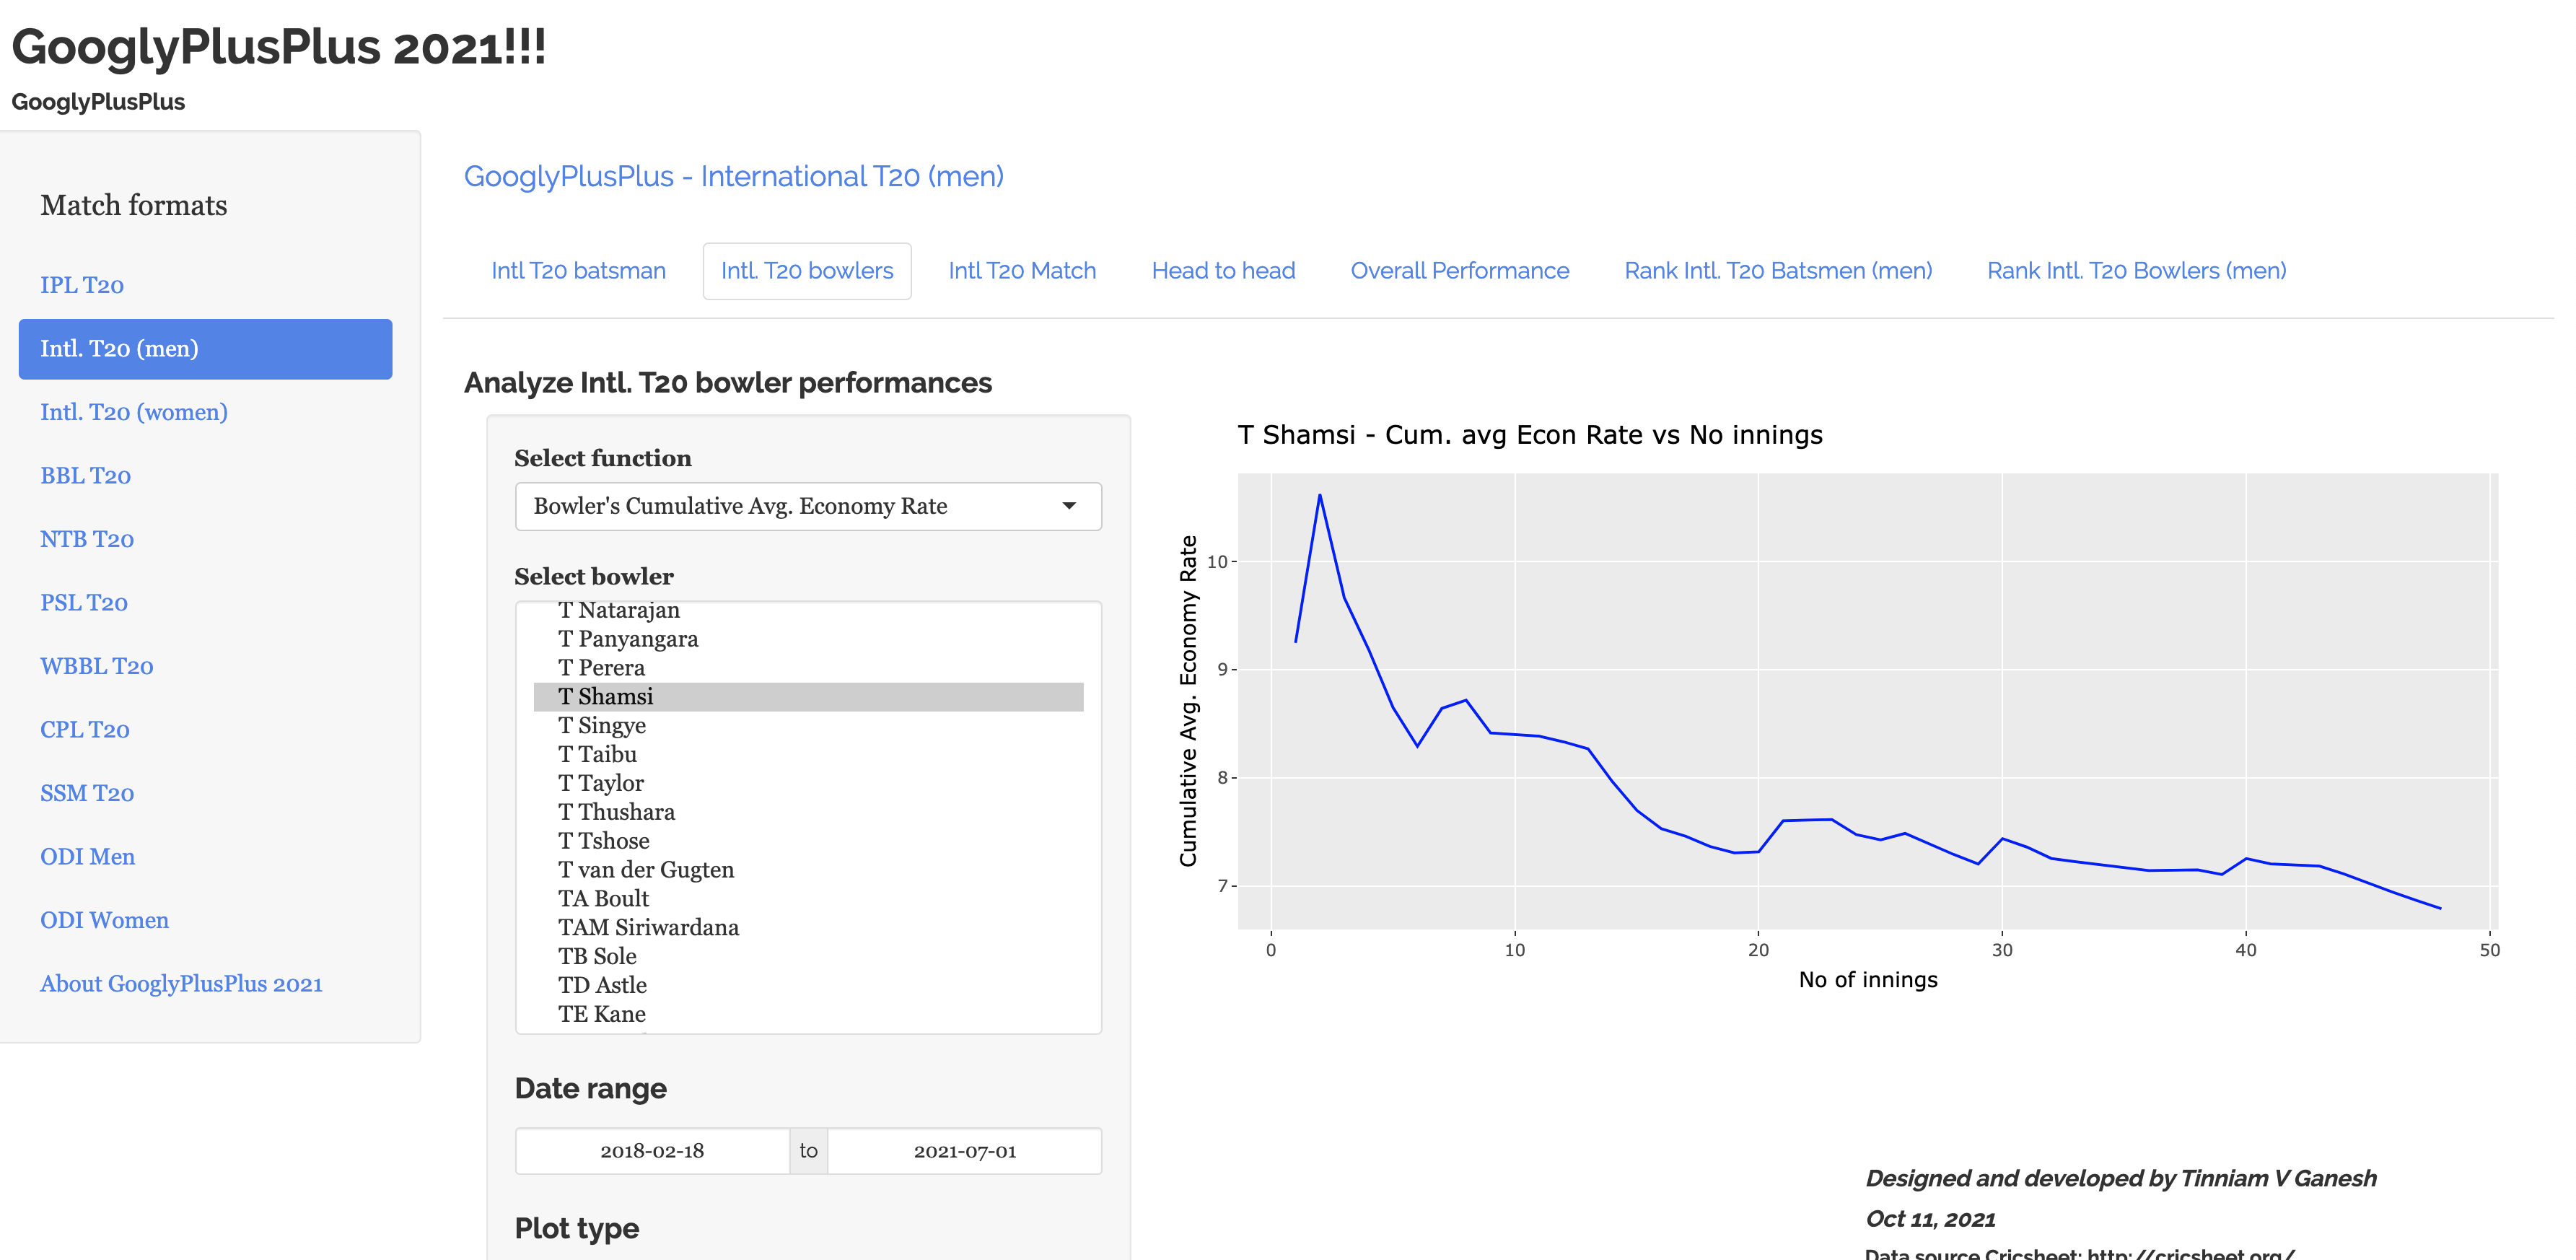
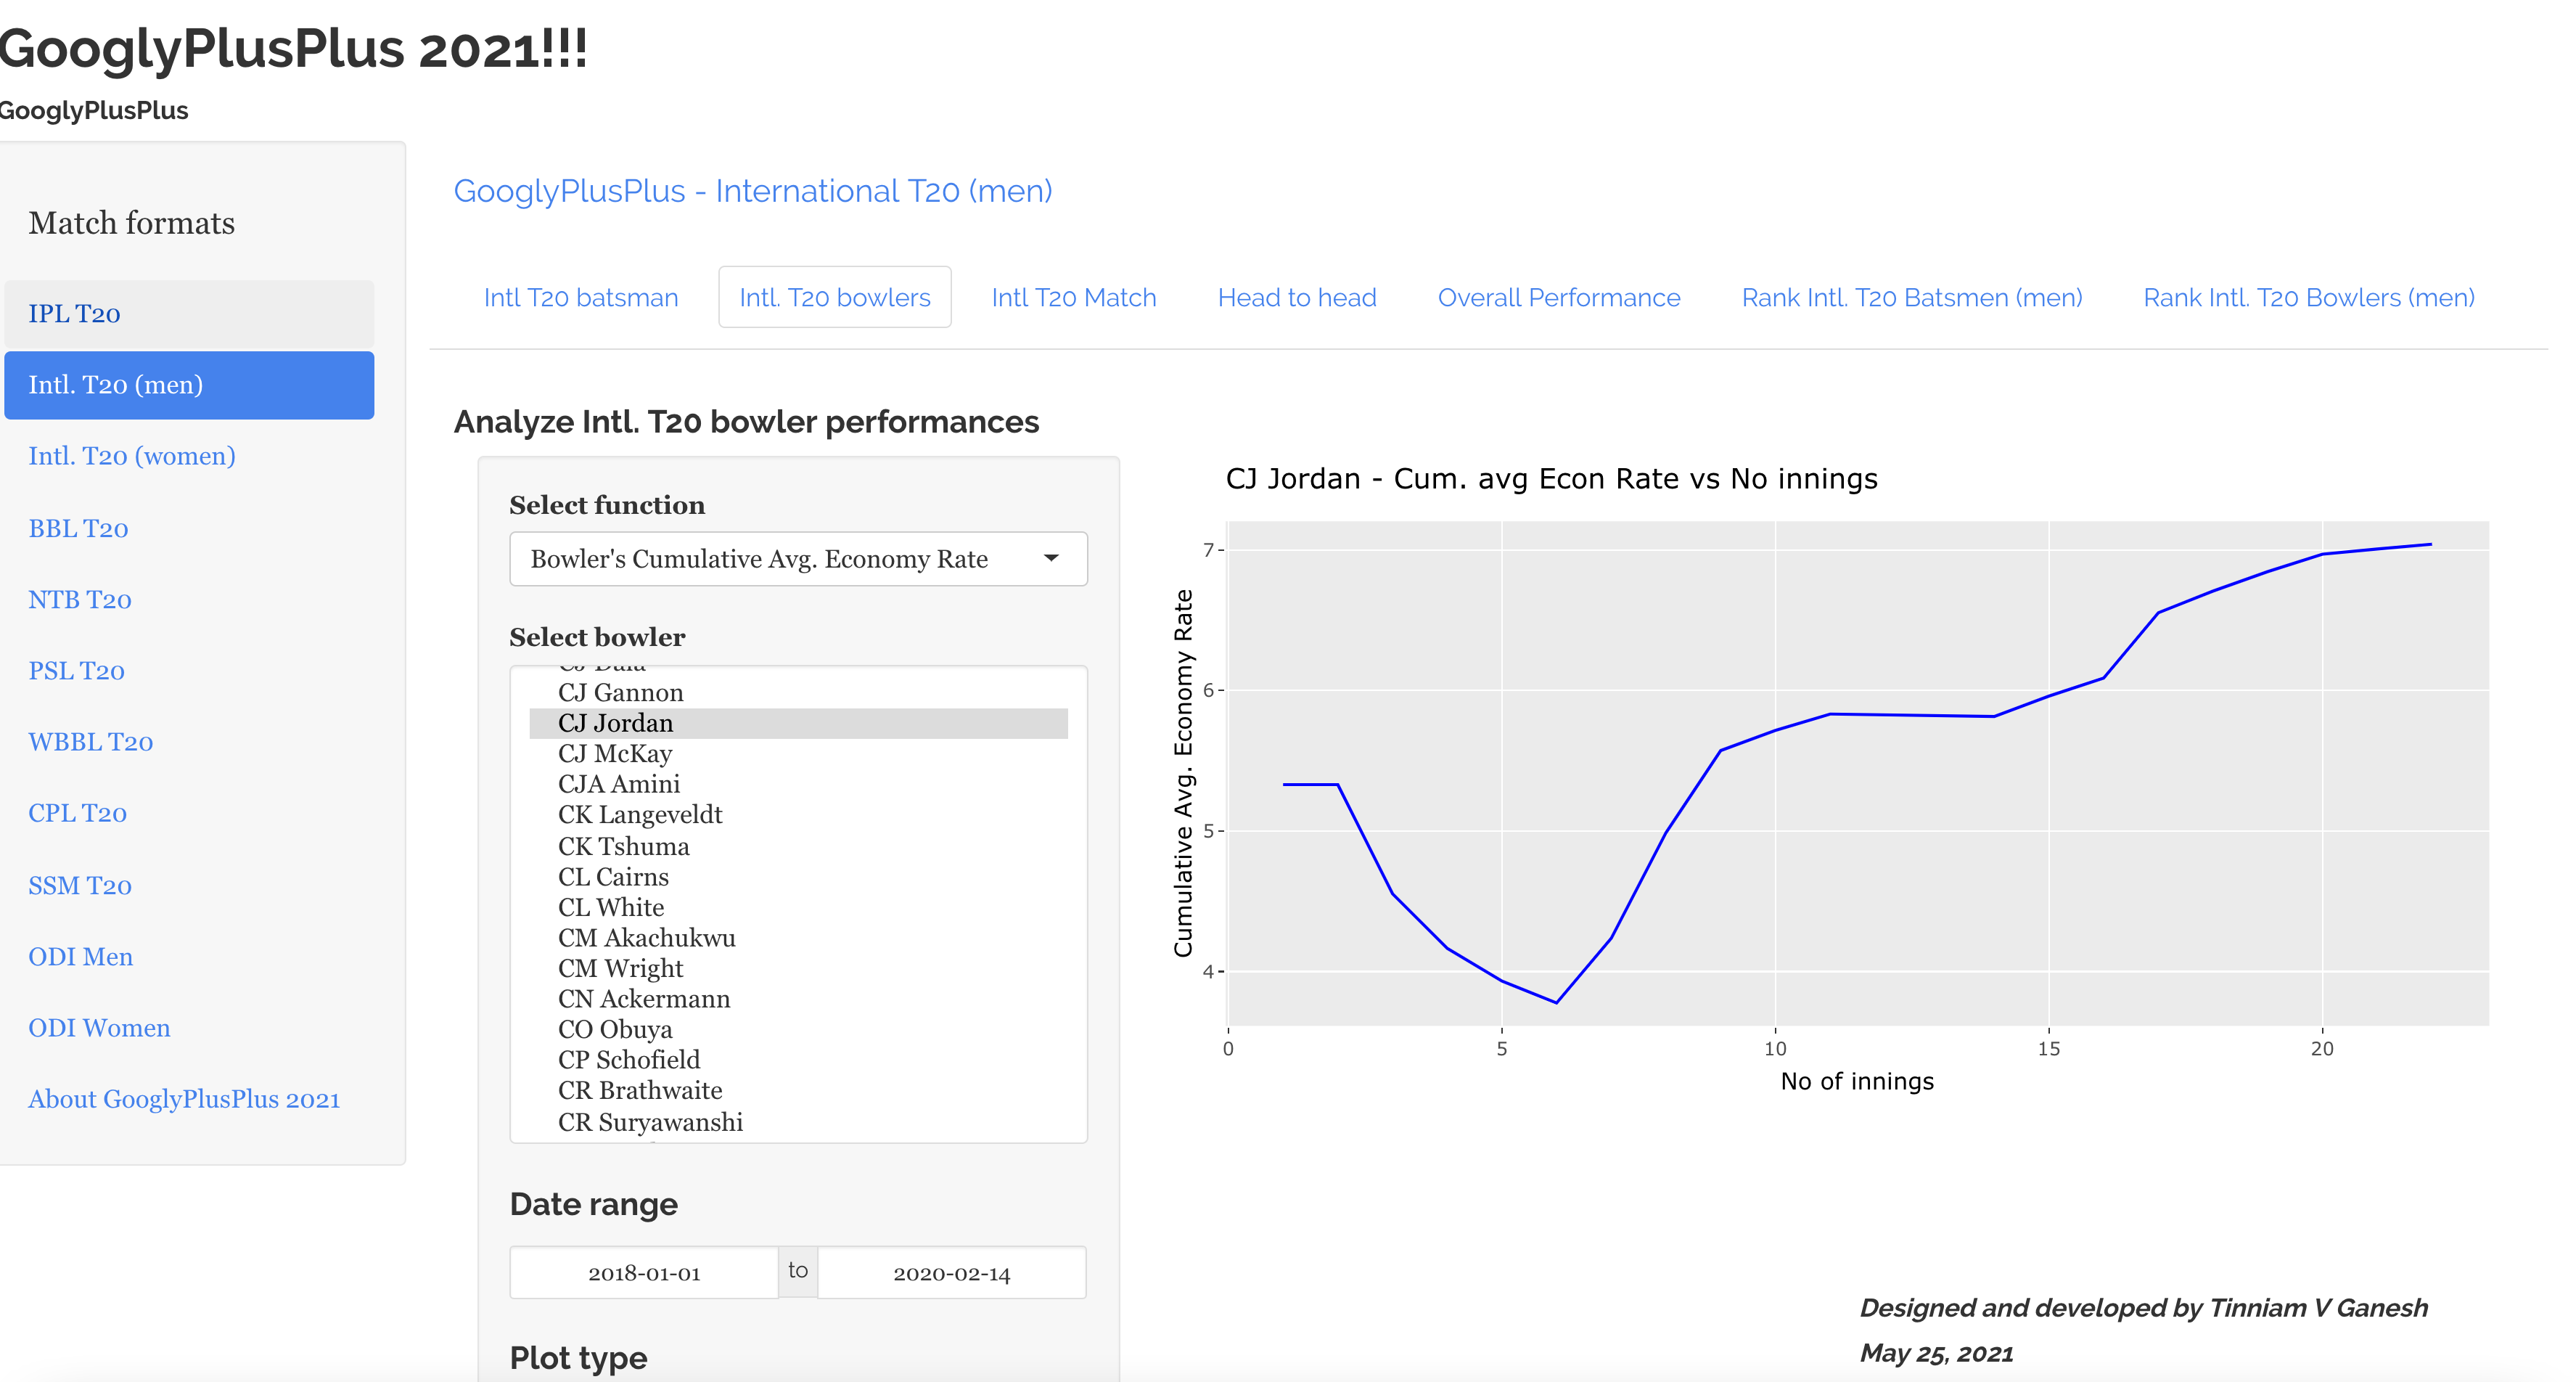
G) Chris Jordan’s cumulative economy rate
We can see that Jordan has become more expensive over the years
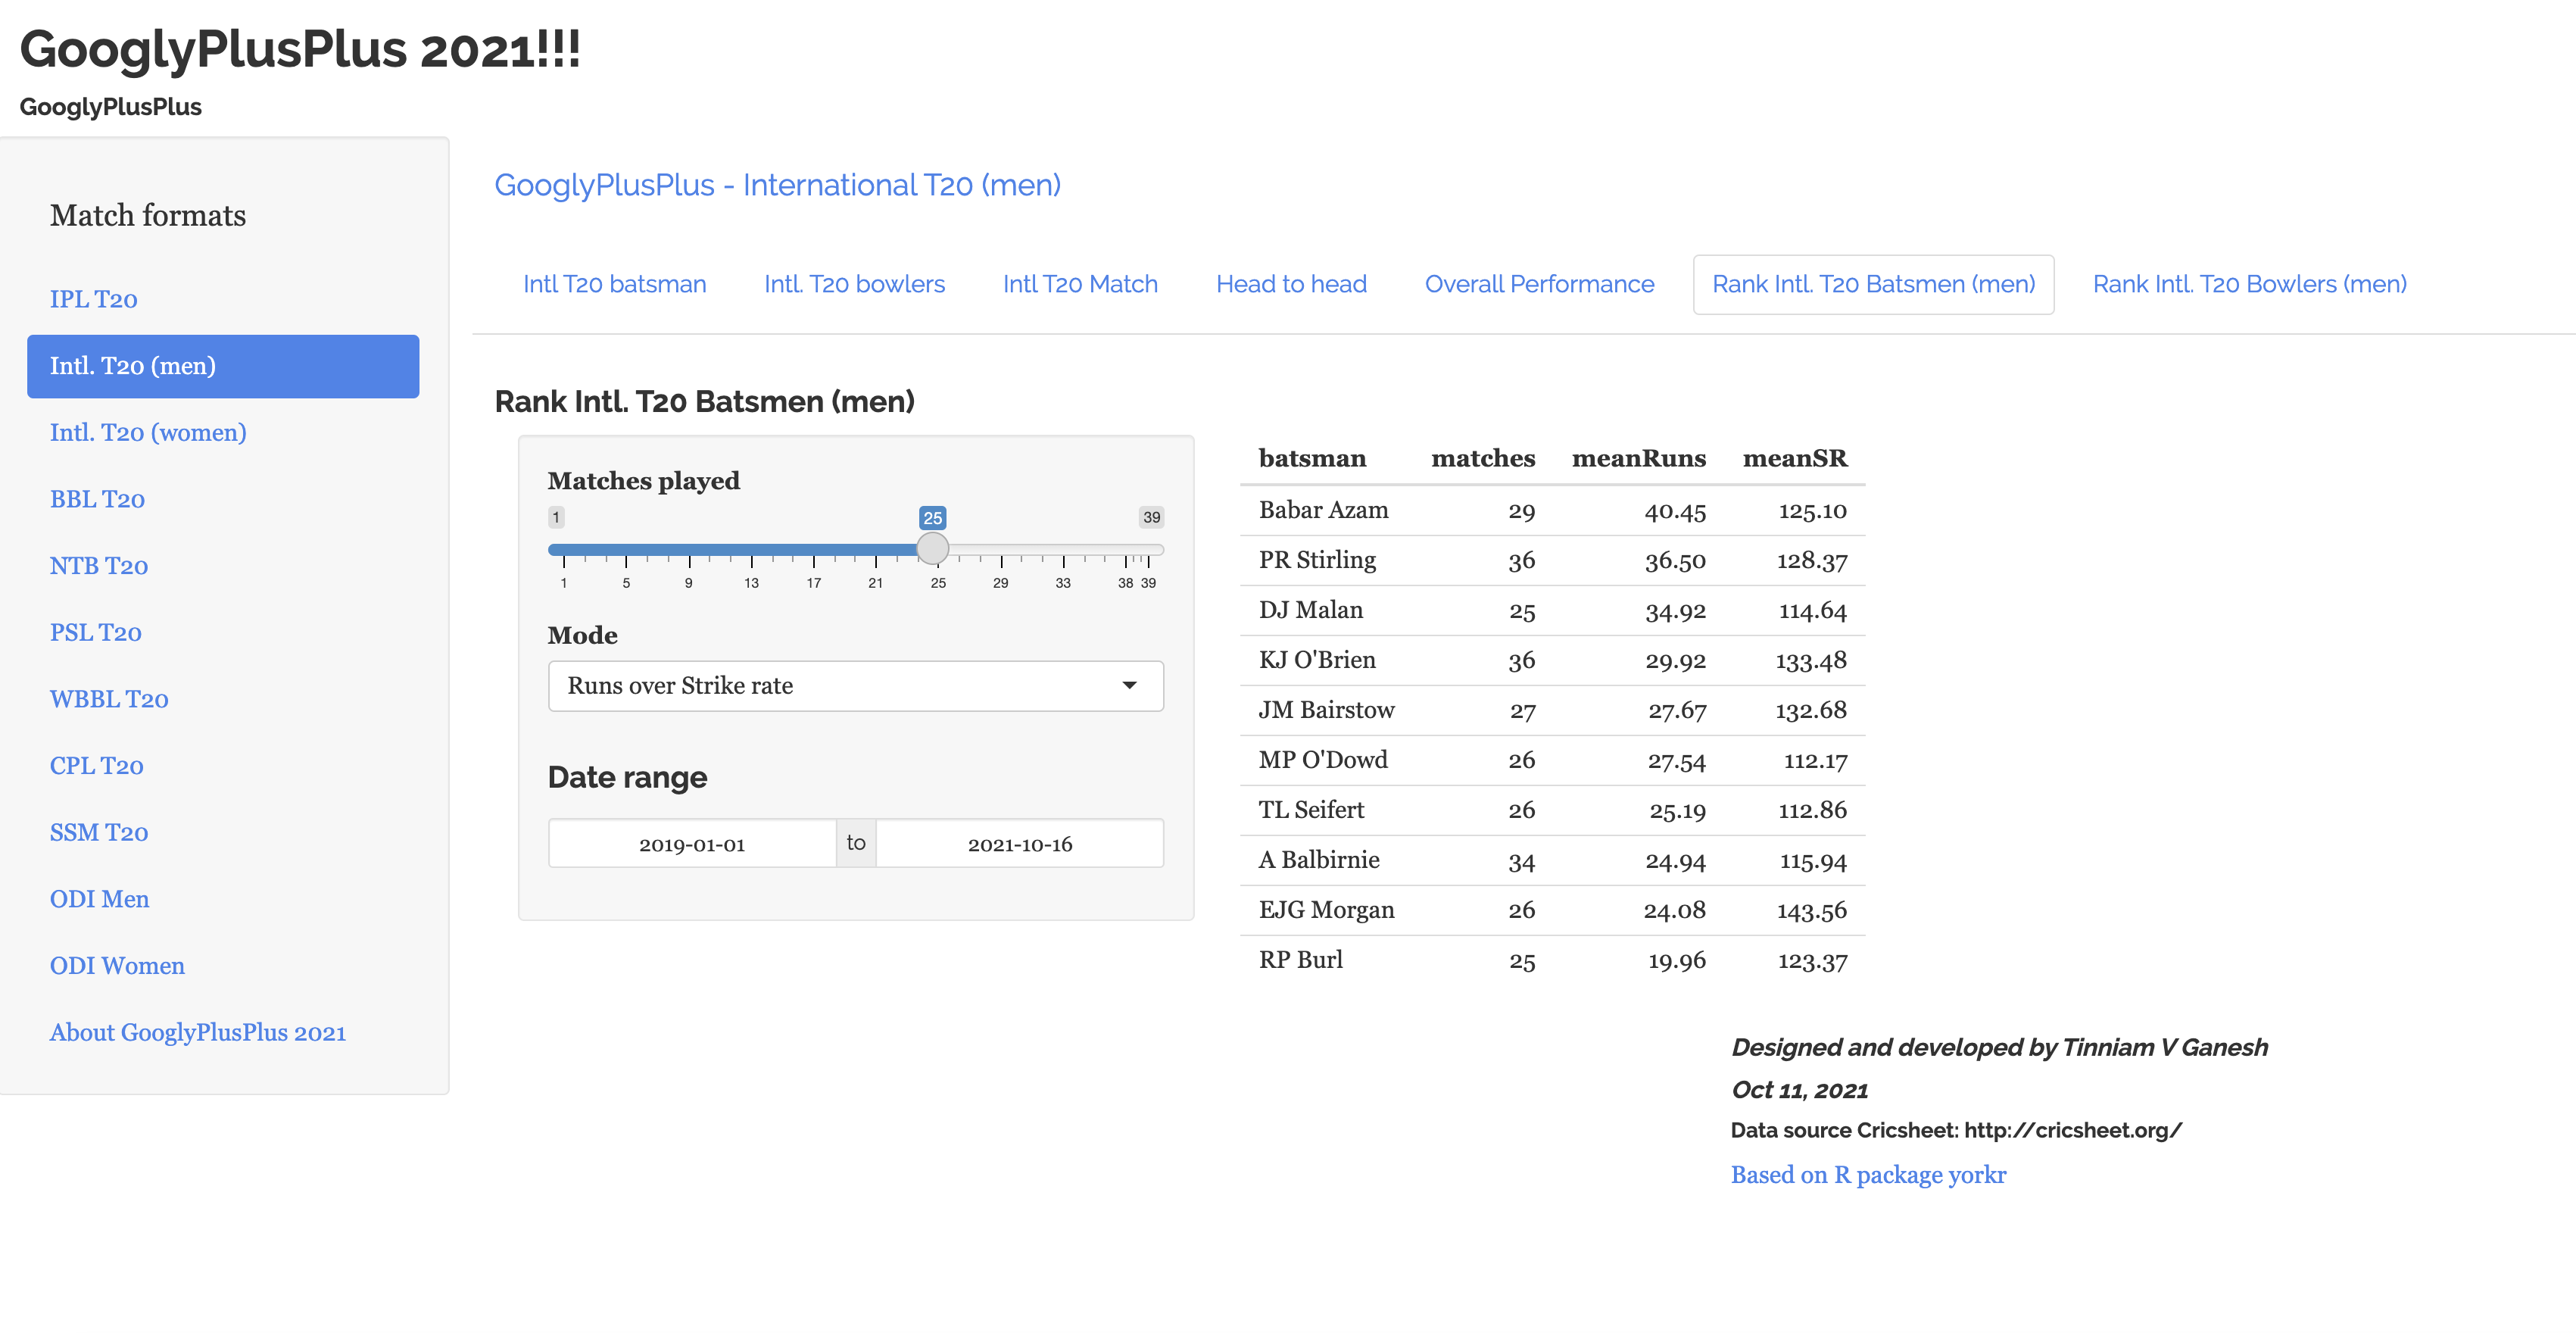
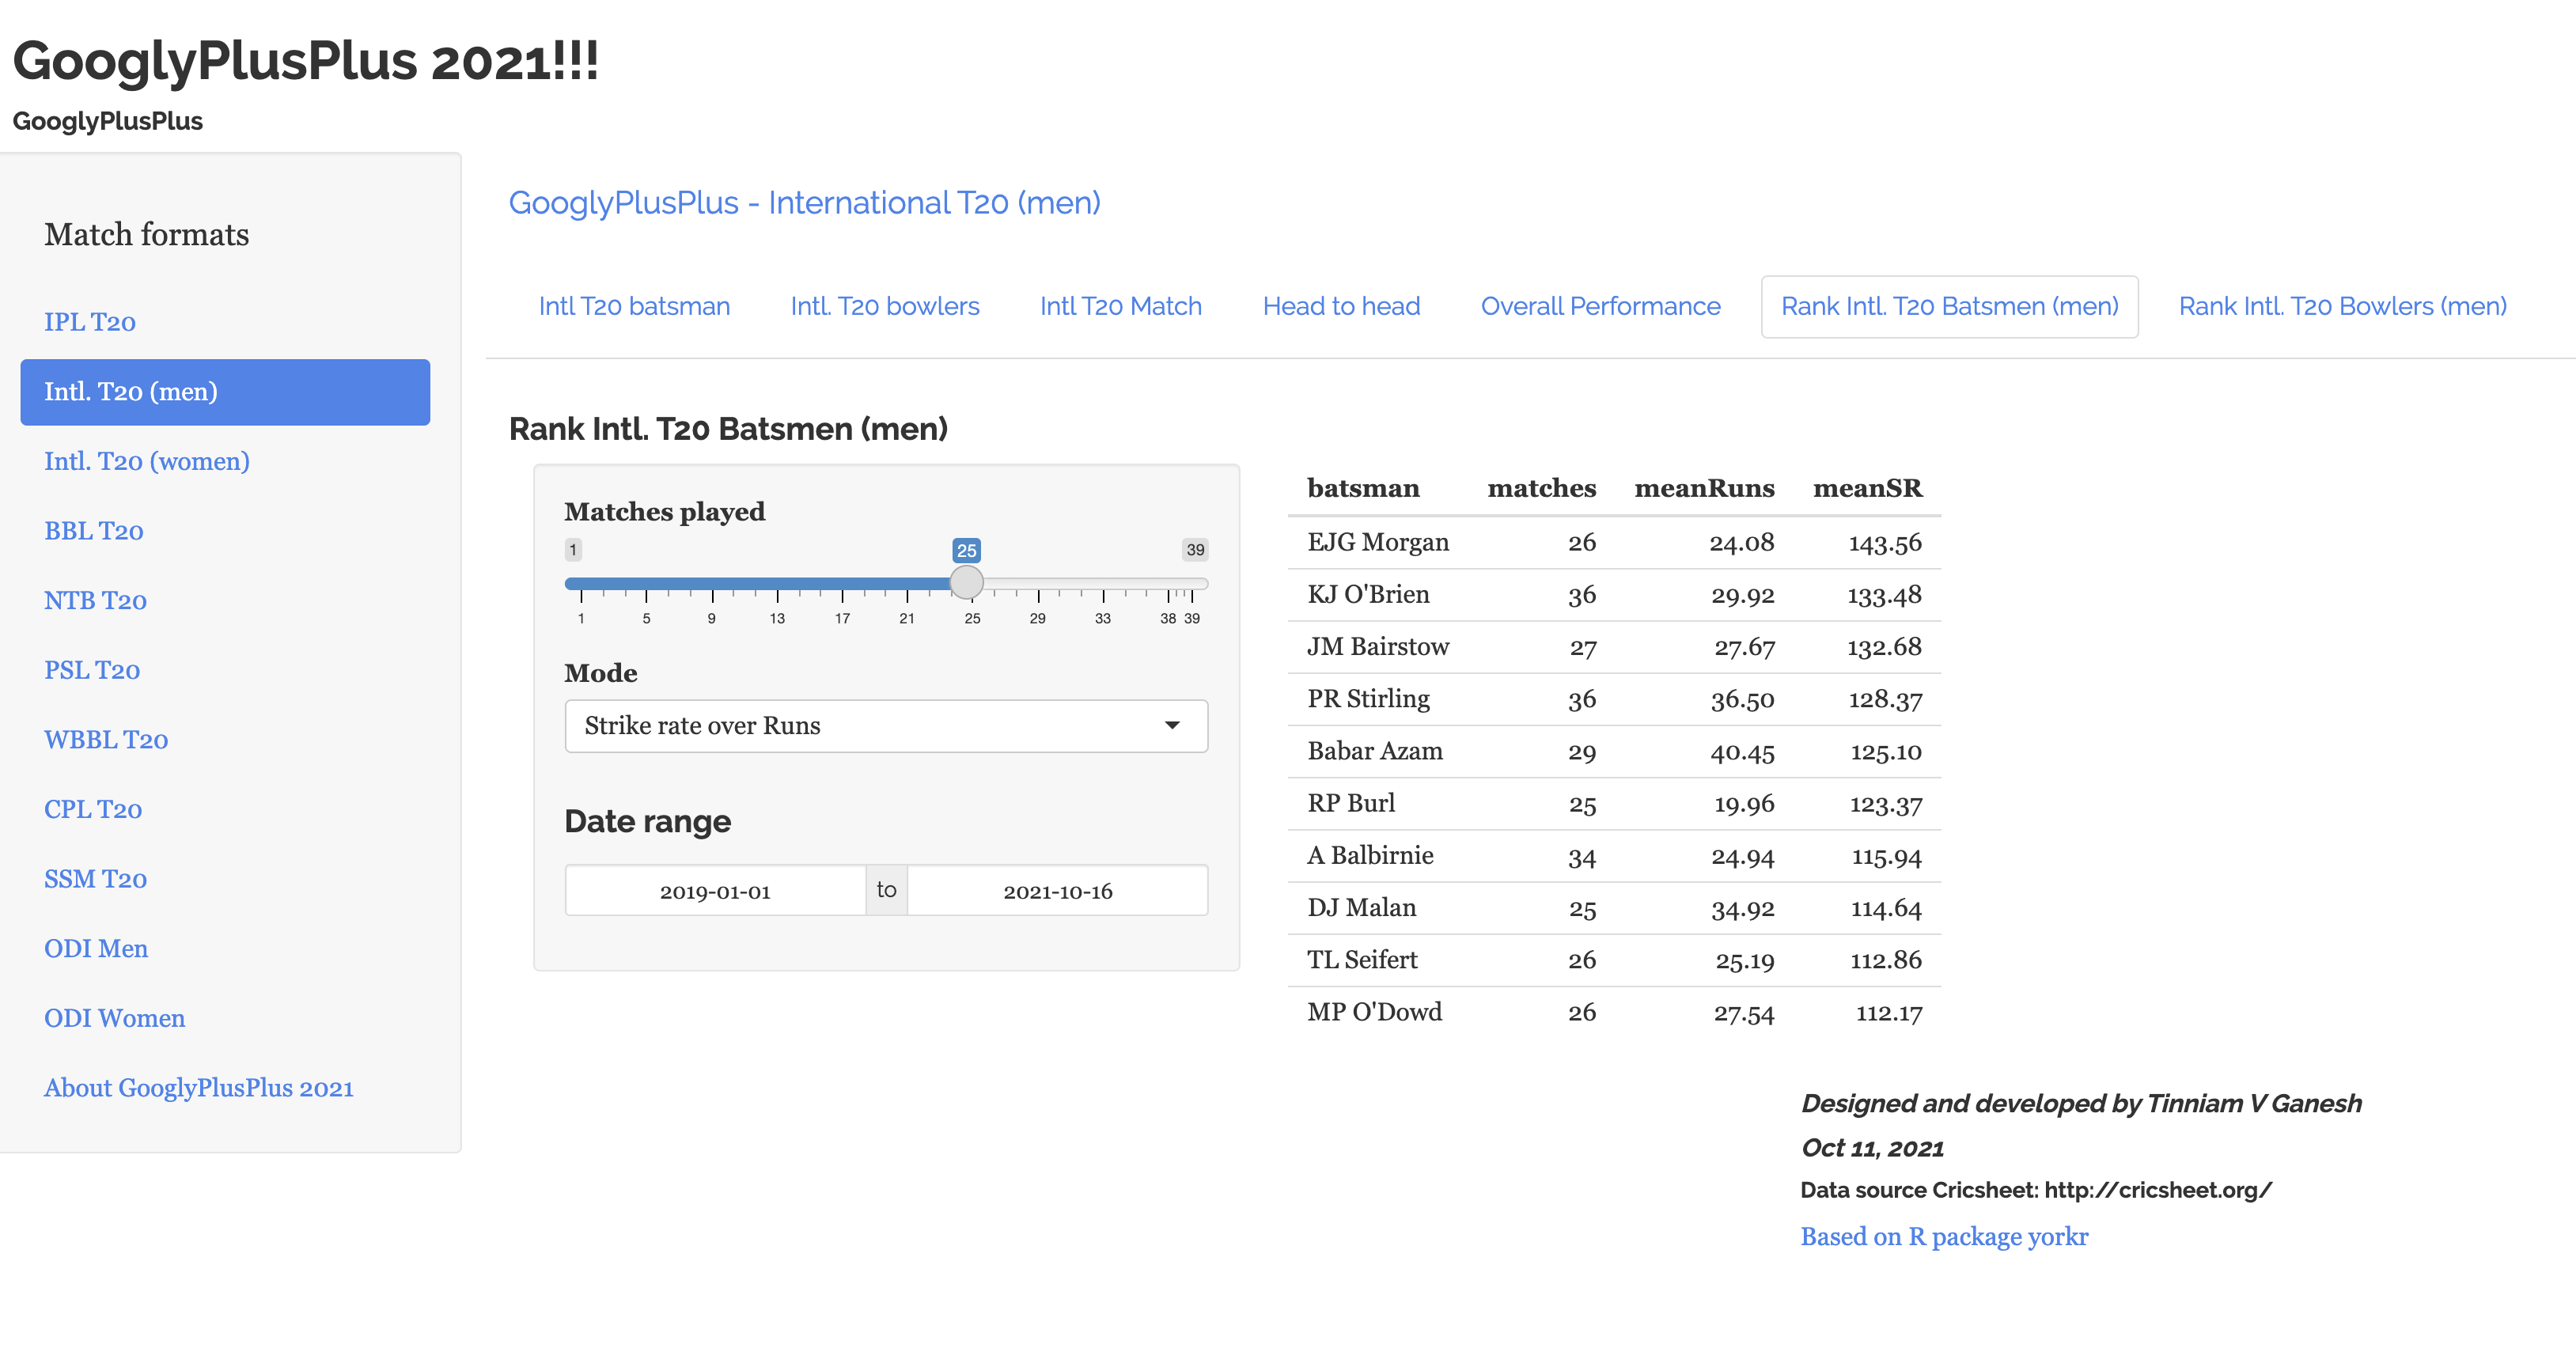
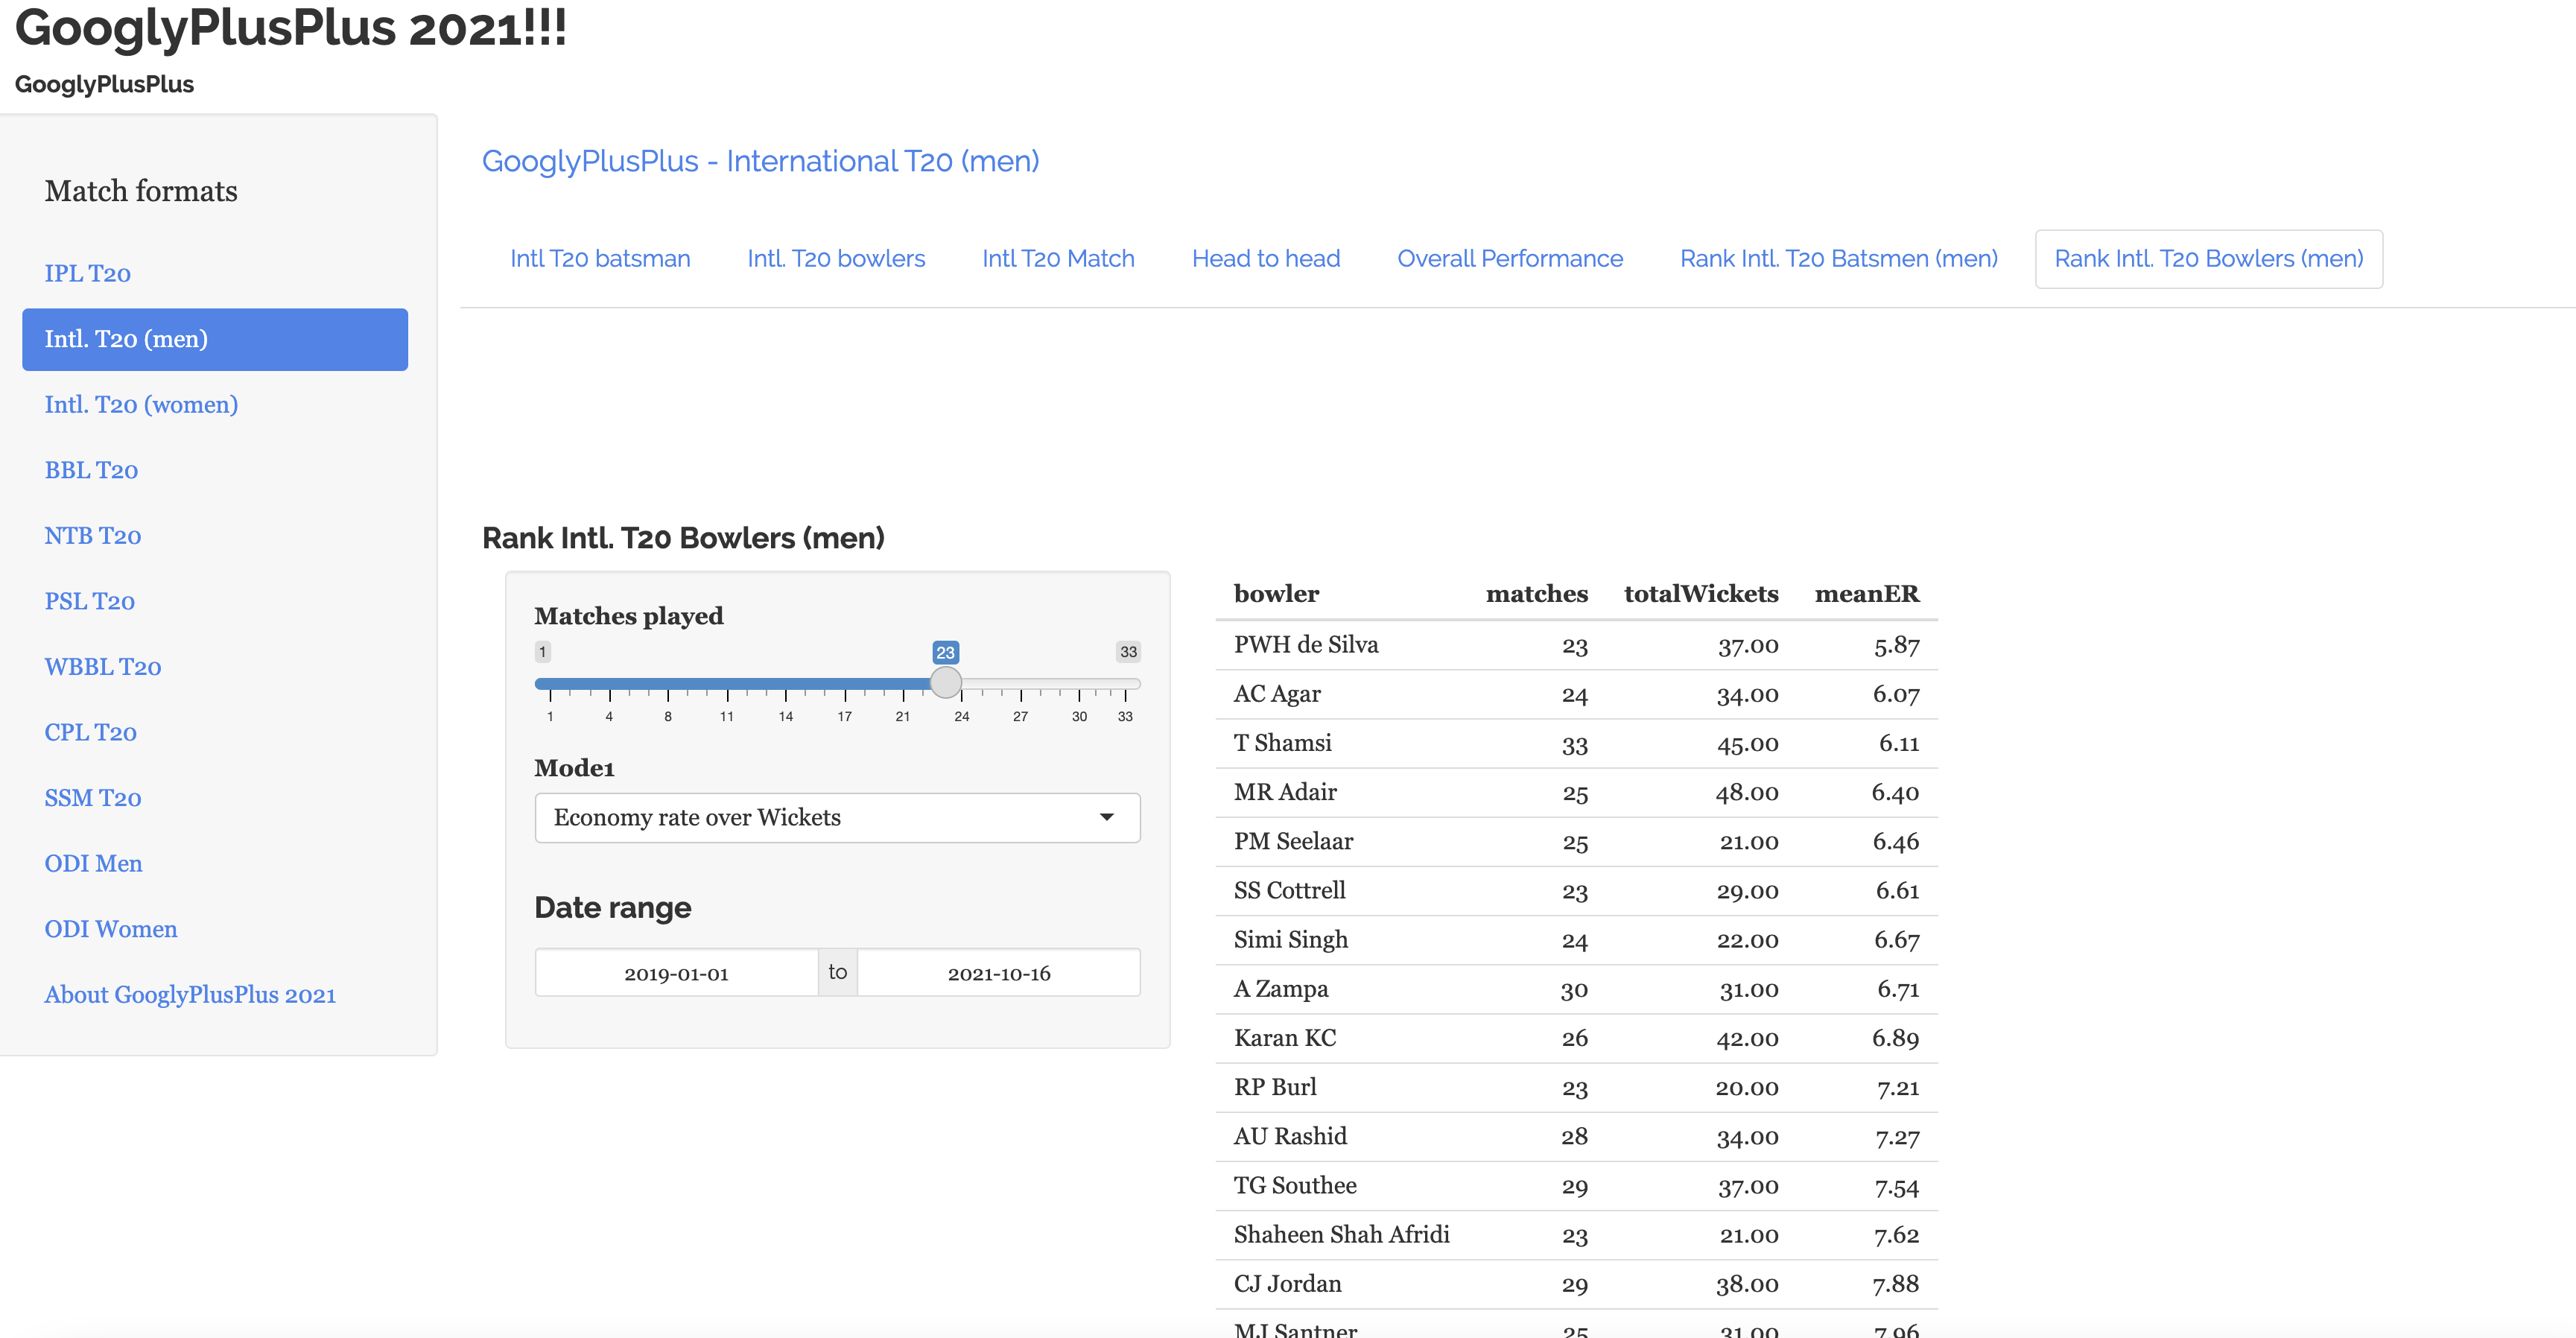
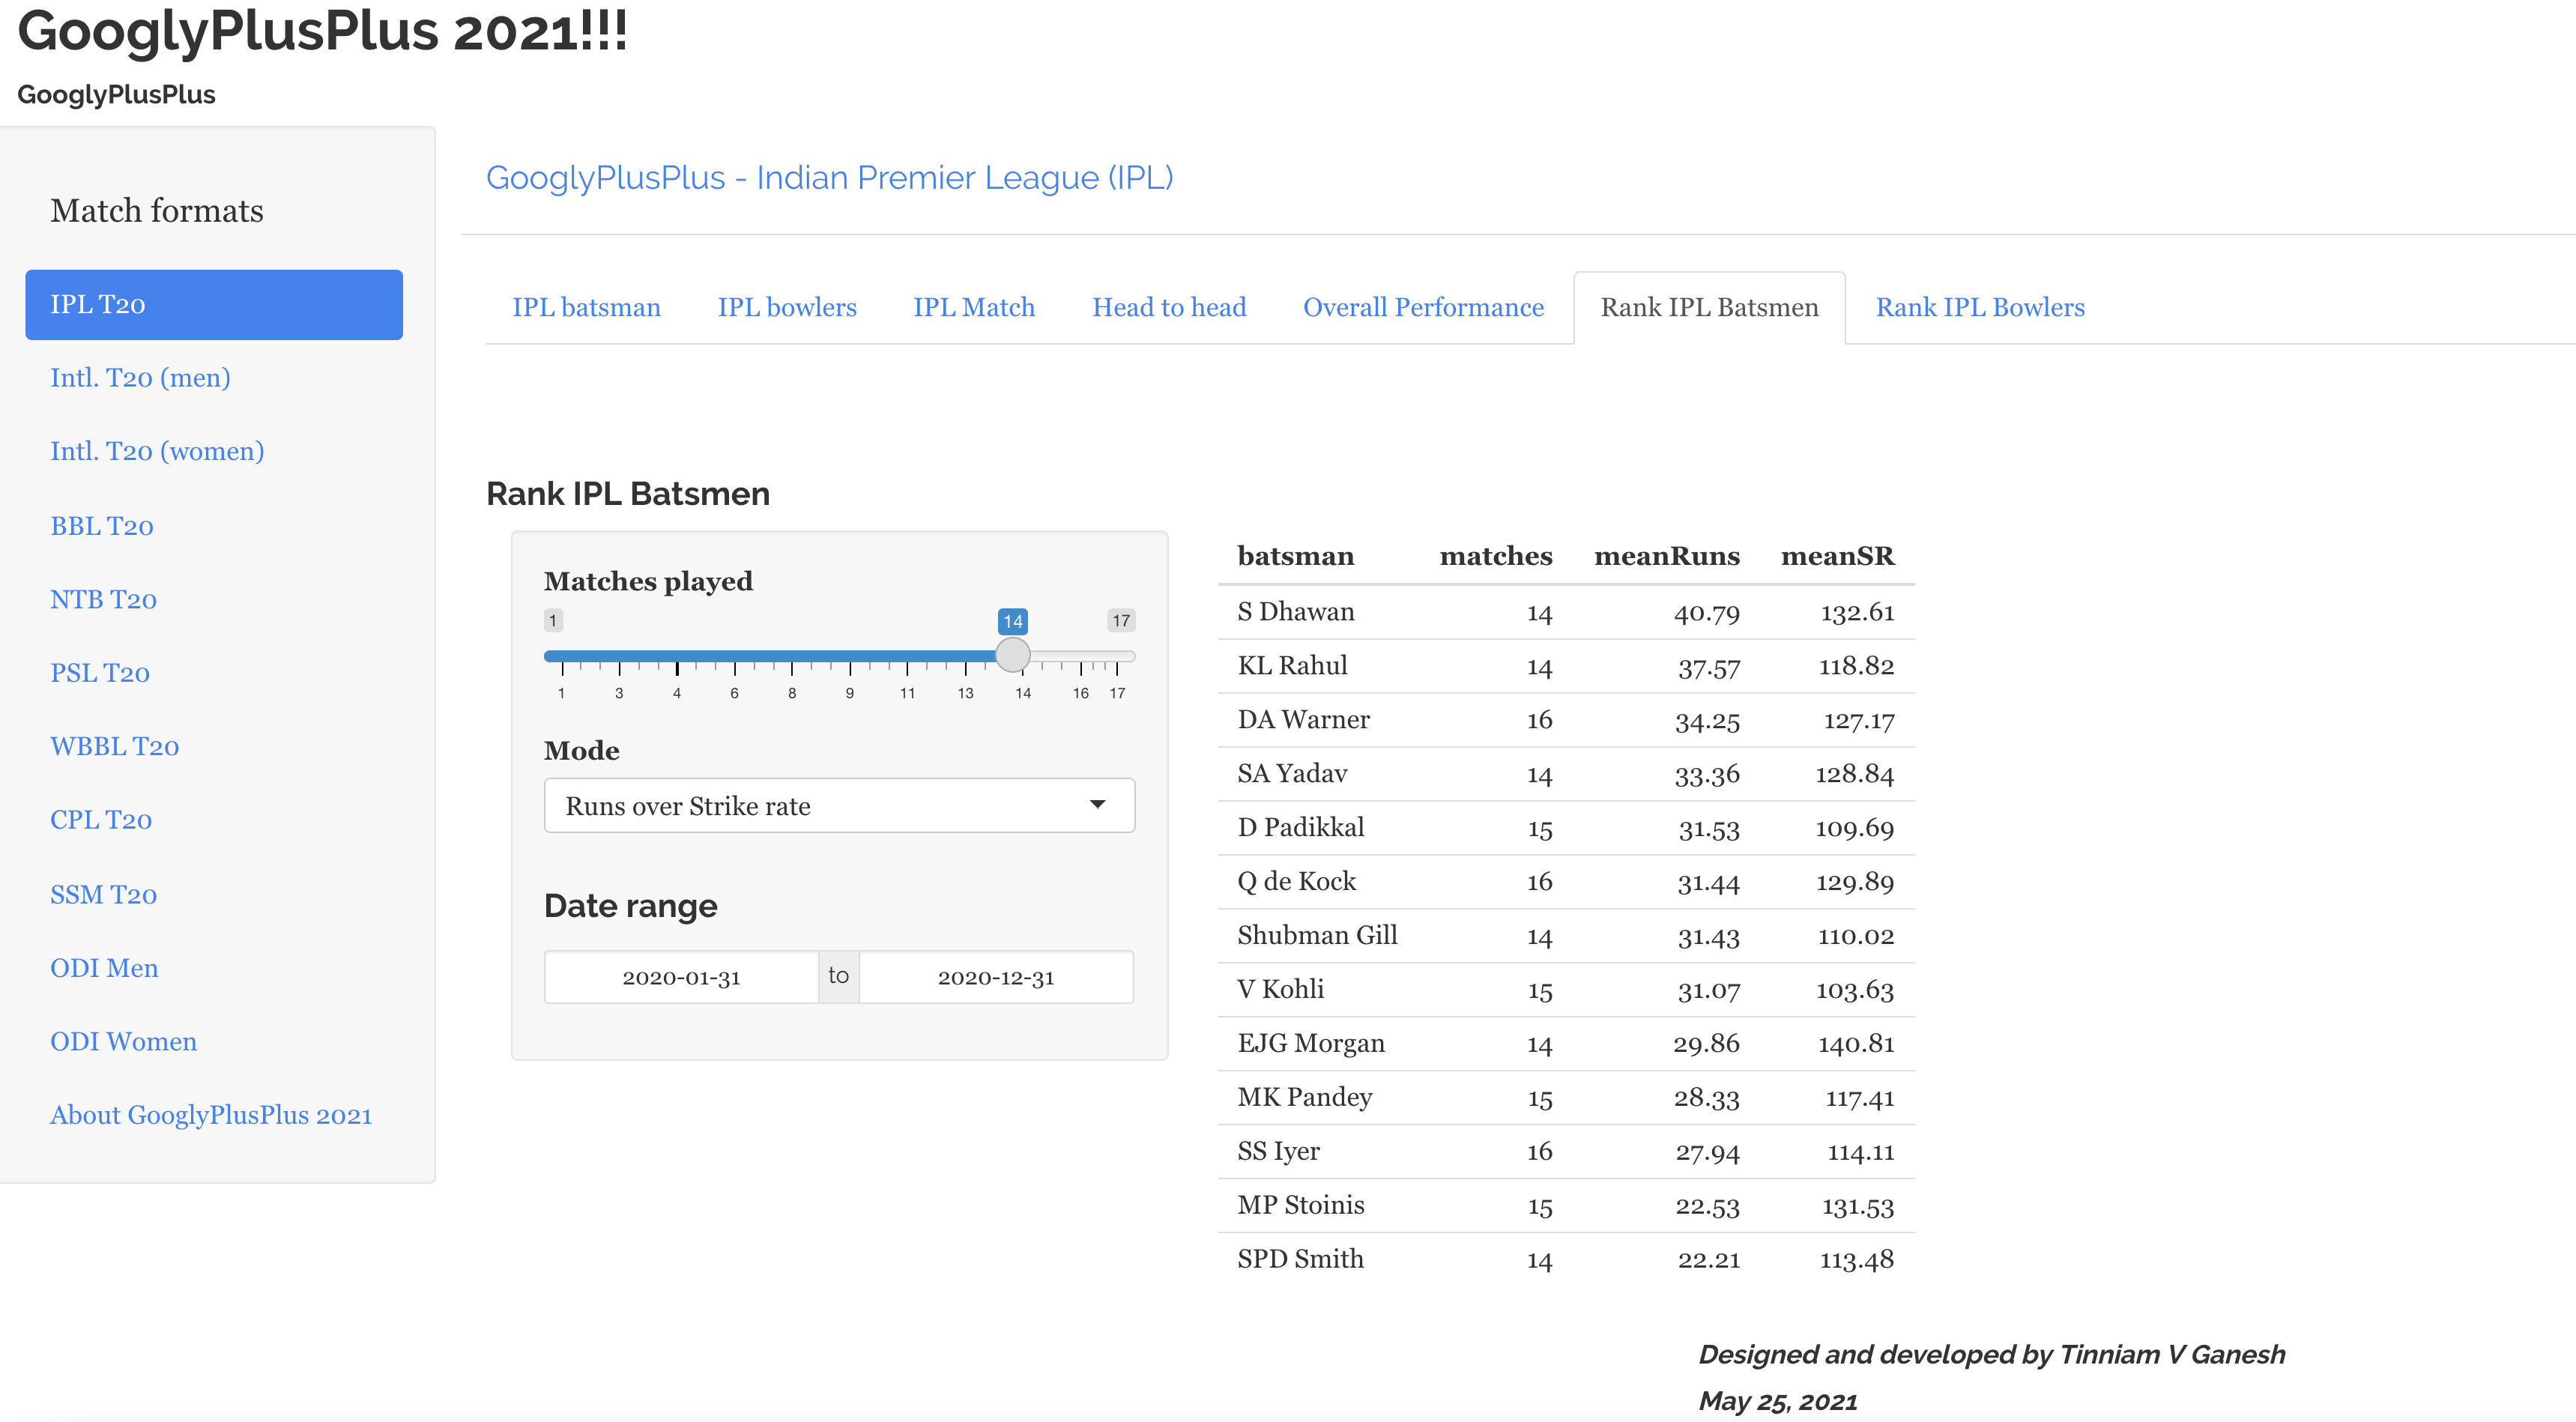
G) Ranking players
In this latest version the ‘Since year slider’ has been replaced with a Date Range selector. With this we can identify the player ranks in any IPL, CPL, PSL or BBL season. We can also check the performance over the last couple of years. Note: The matches played and Runs over Strike rate or Strike rate over runs can be computed. Similarly for bowlers we have Wickets over Economy rate and Economy rate over wickets options.
a) Ranking IPL batsman in IPL season 2020
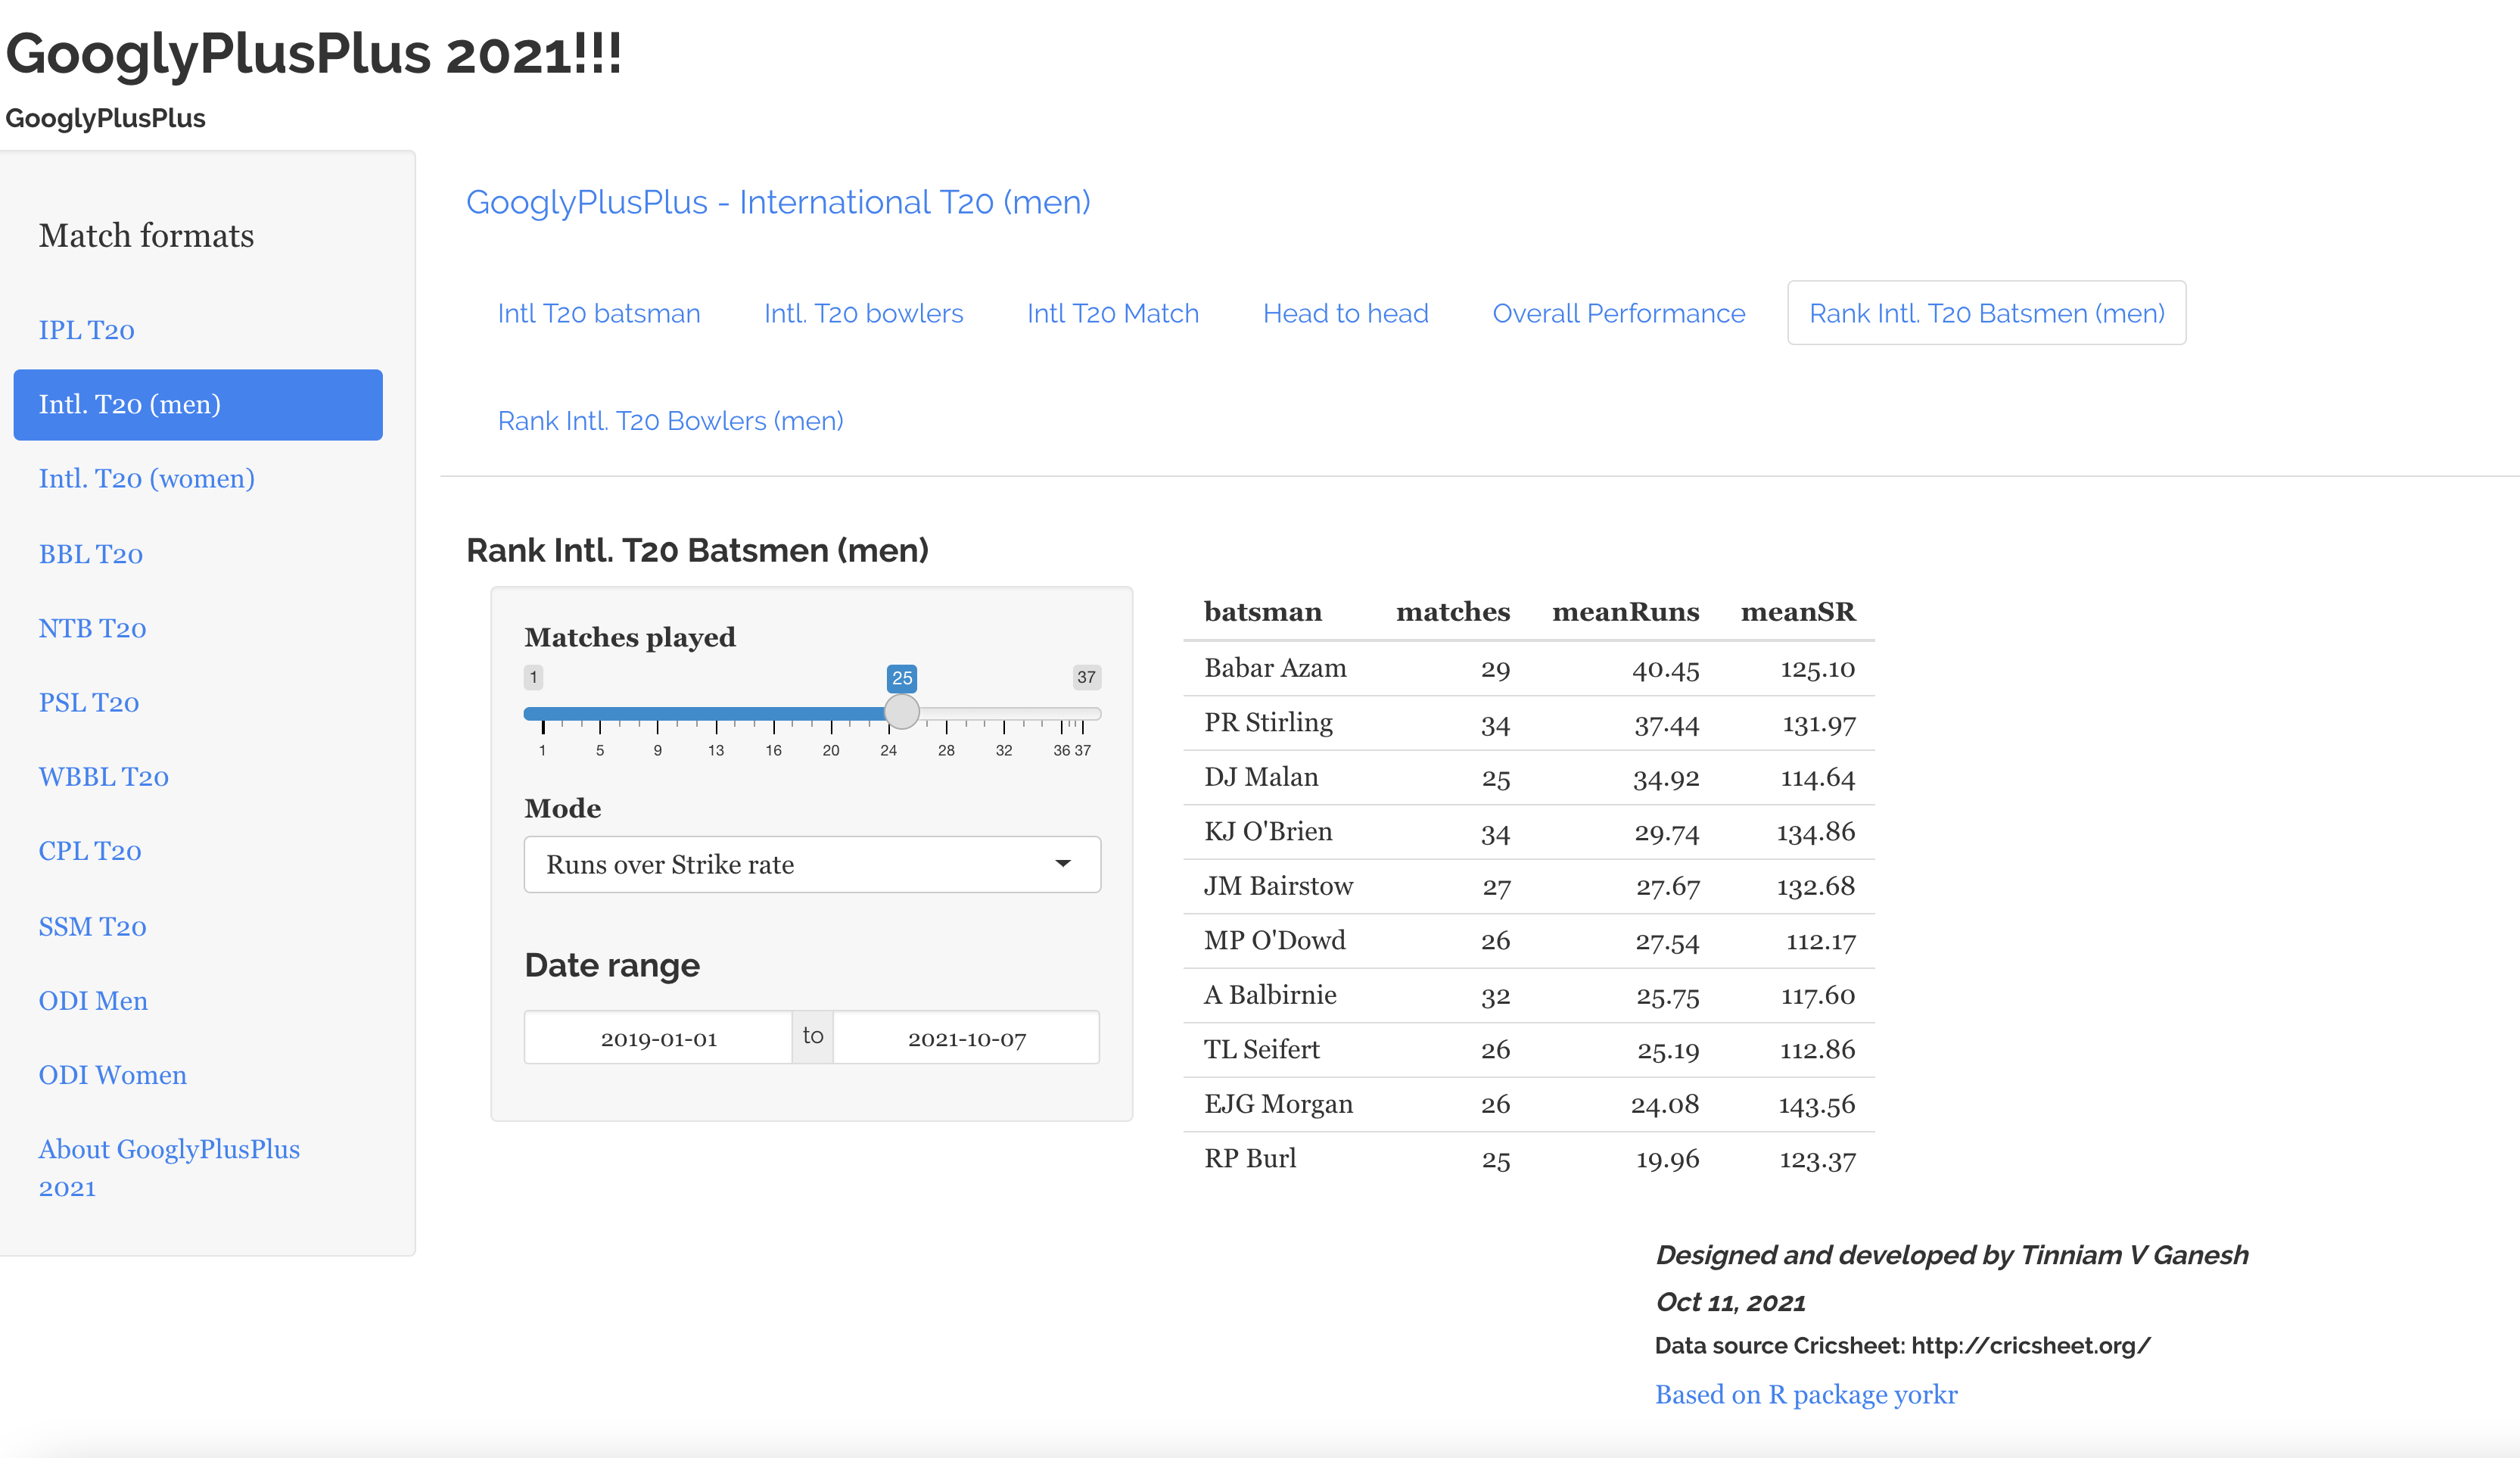
b) Ranking Intl. T20 (batsmen) from Jan 2019 to Jul 2021
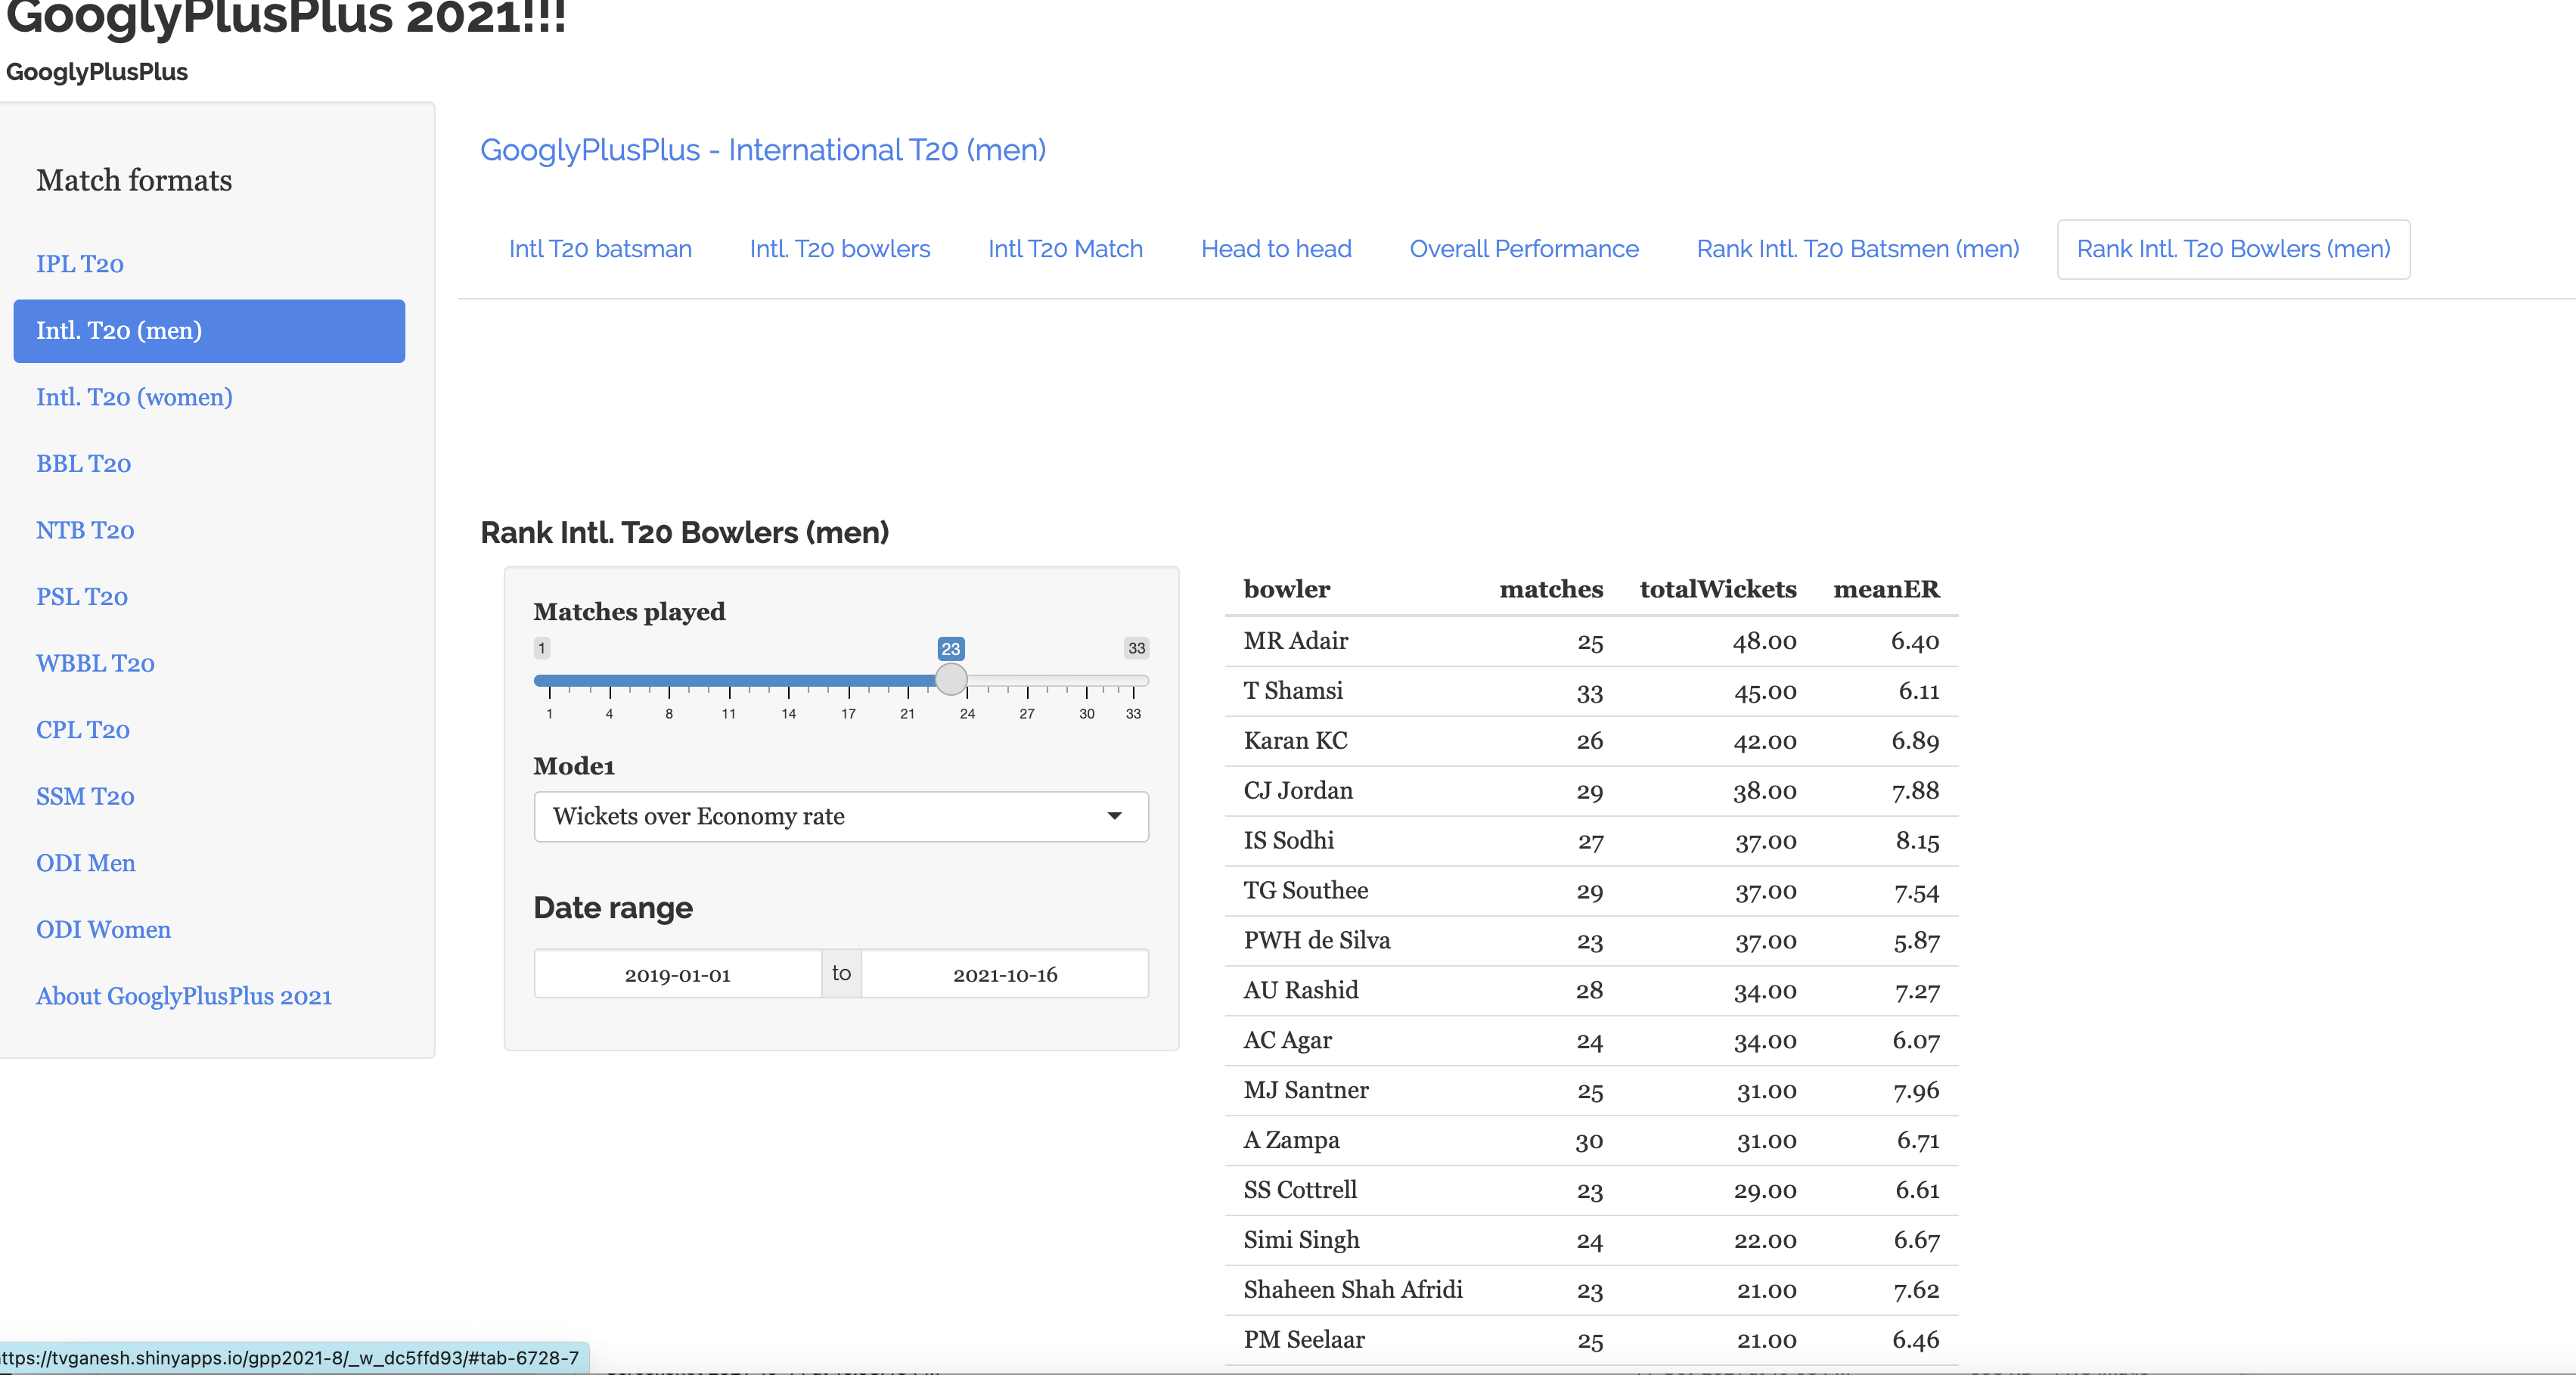
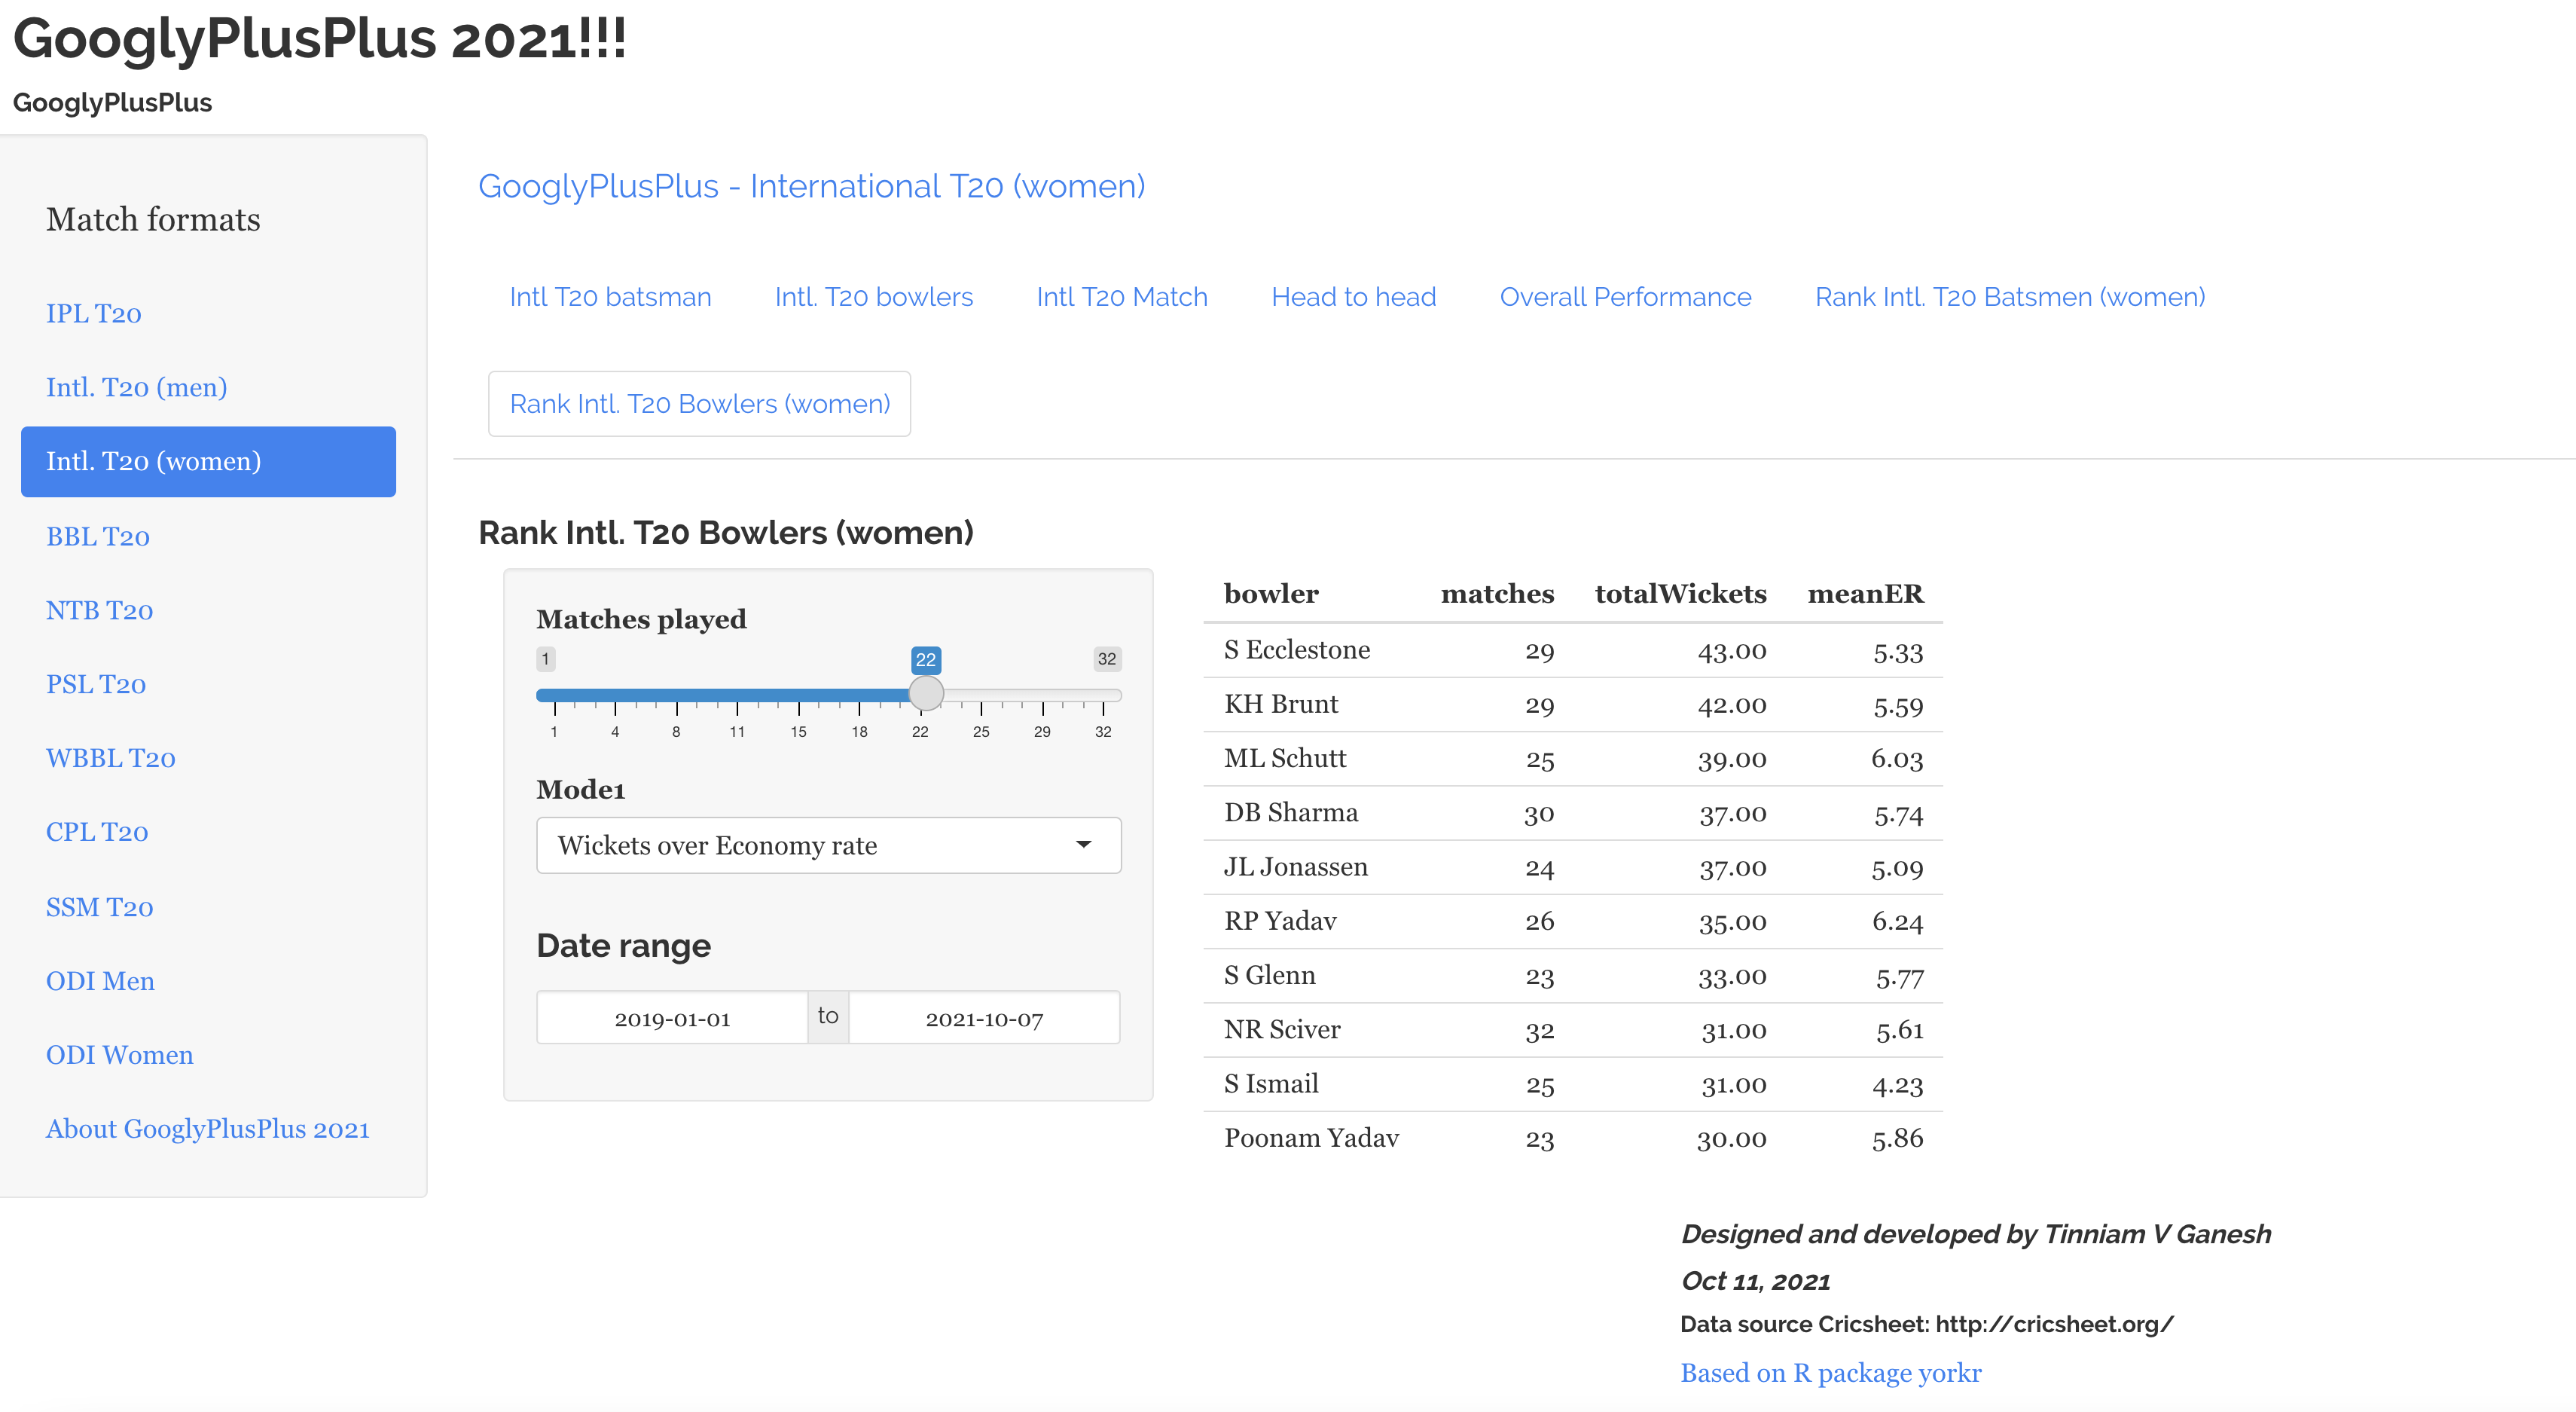
c) Ranking Intl. T20 bowlers (women) from Jan 2019 – Jul 2021
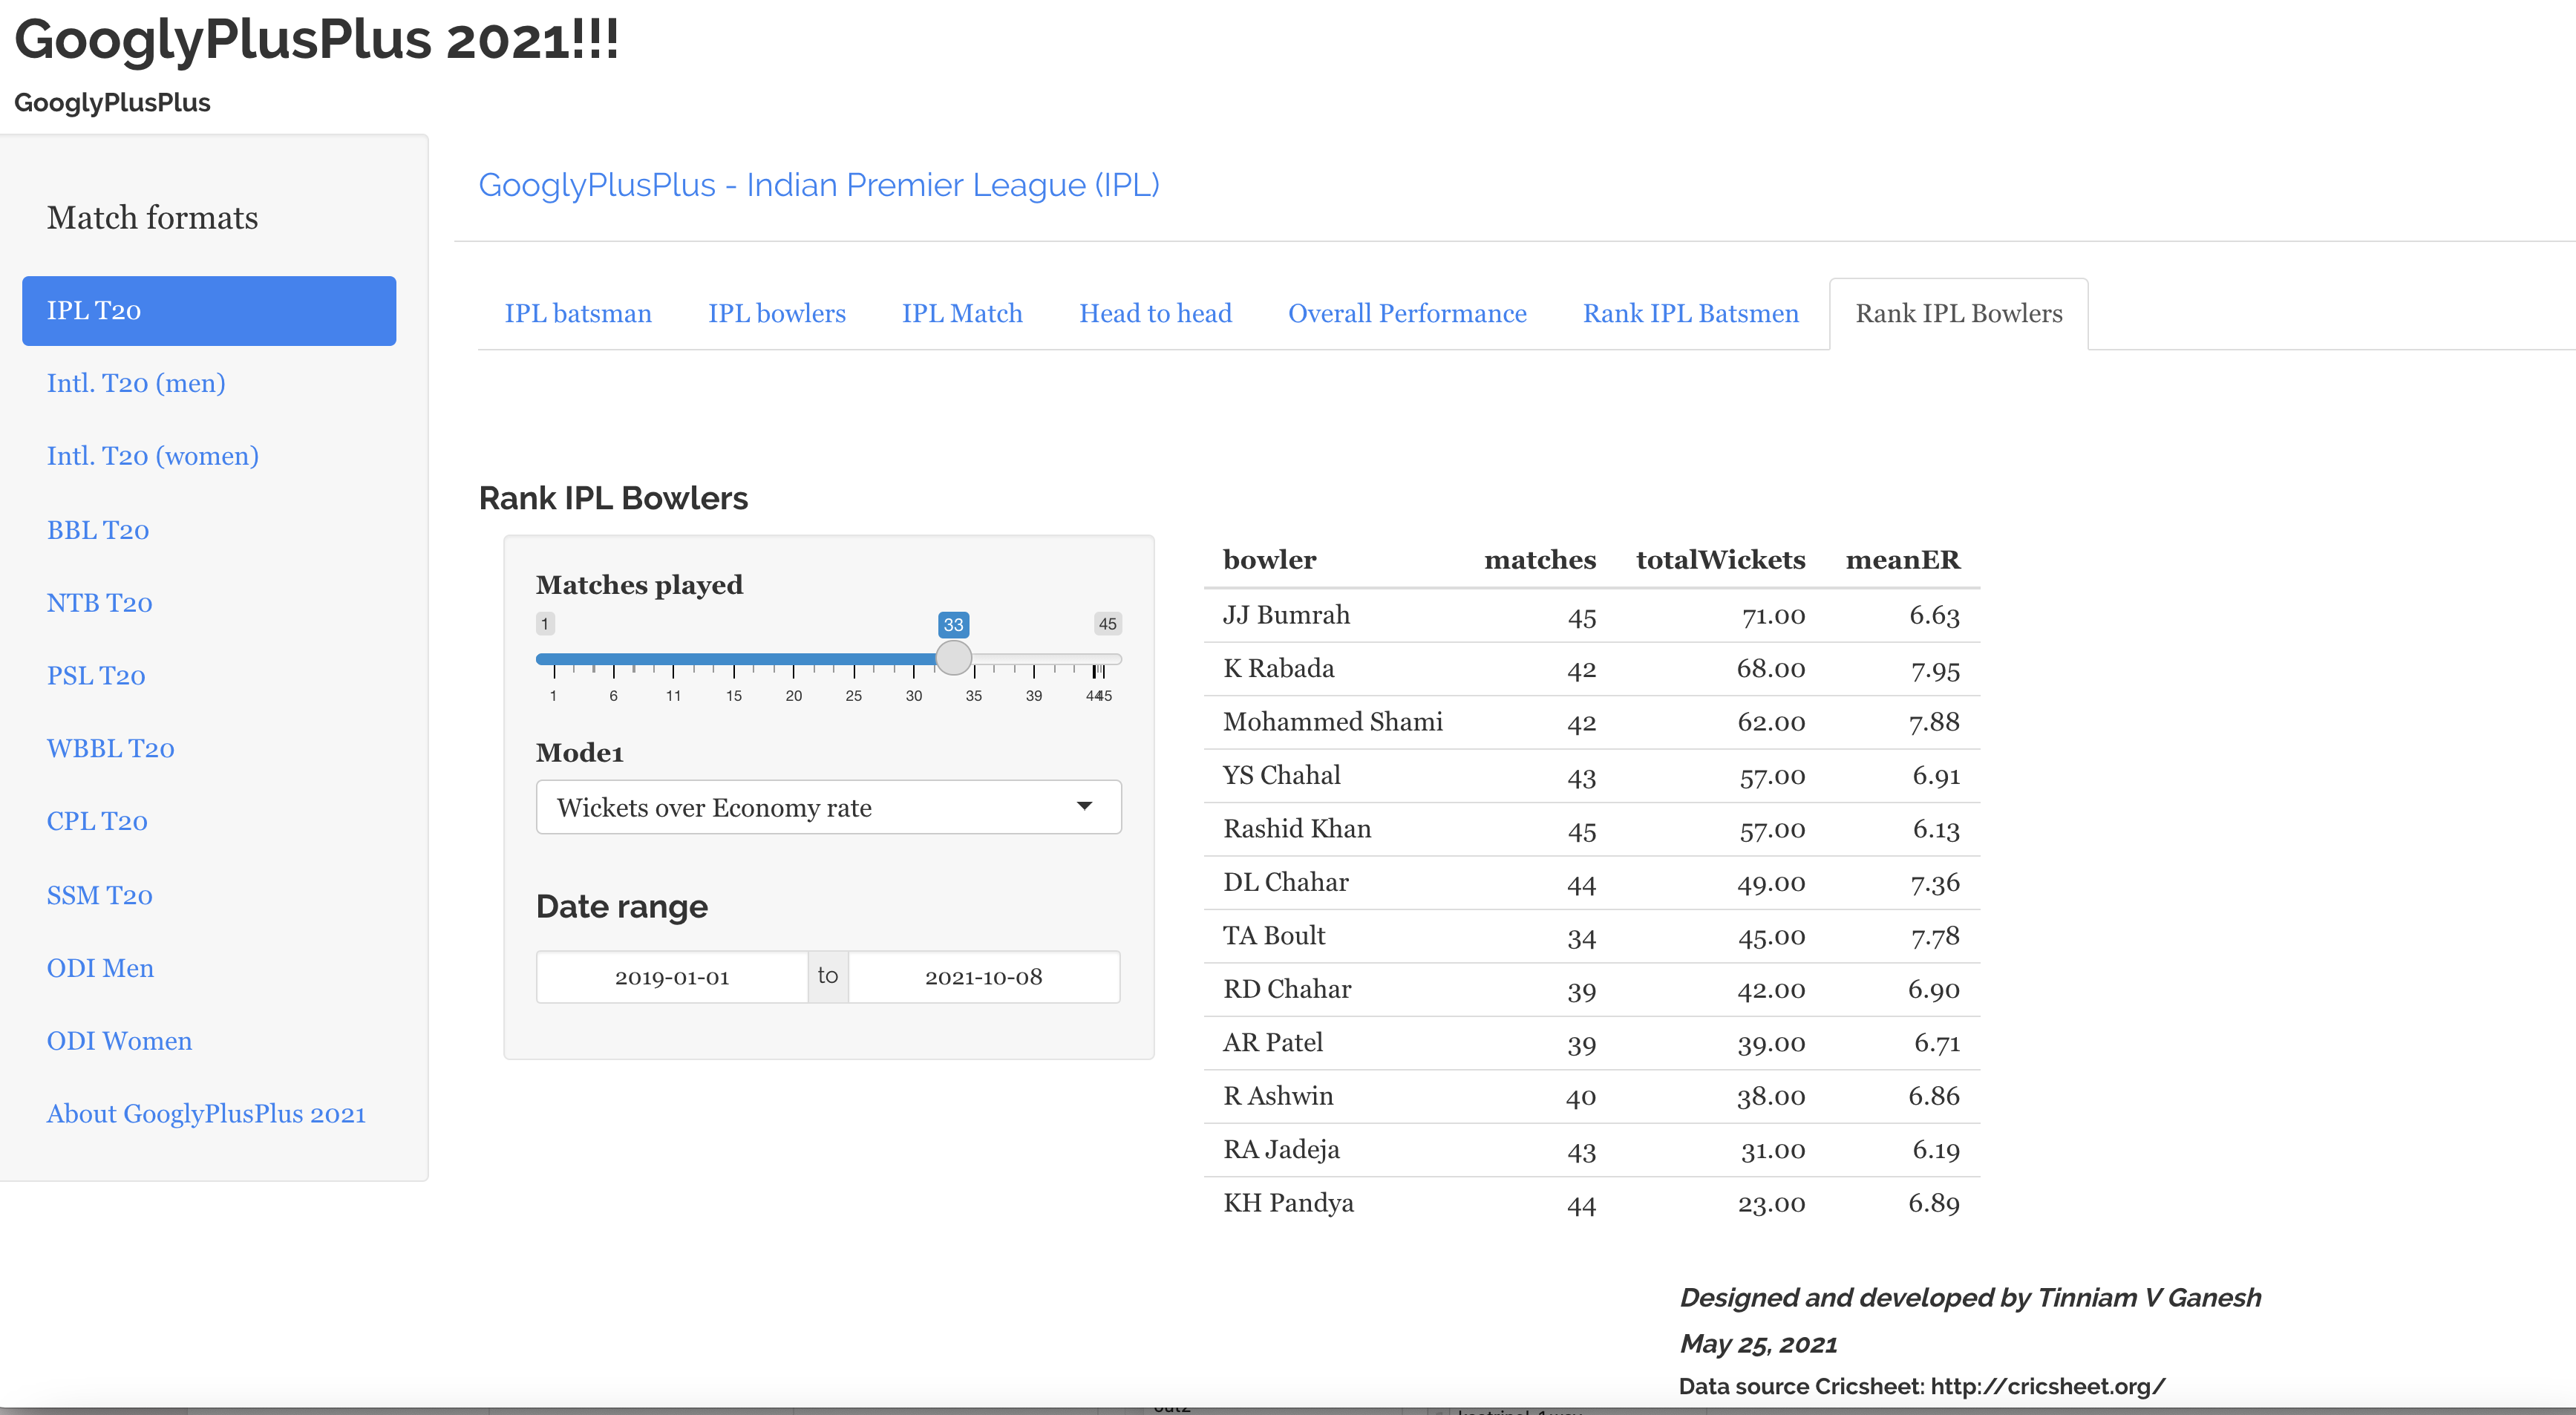
d) Best IPL bowlers over the last 3 seasons (Wickets over Economy rate)
e) Best IPL bowlers over the last 3 seasons (Economy rate over wickets)
You can clone/download this latest version of GooglyPlusPlus2021 from Github at gpp2021-7
The IPL 2021 extravaganza has restarted again, now in Dubai, and it was time for me to crank up good ol’ GooglyPlusPlus2021. As in my earlier post, GooglyPlus2021 with IPL 2021 as it happens, during the initial set of IPL 2021 games,, a command script will execute automatically every day, download the latest data files, unzip, sort, process and put them in appropriate directories so that GooglyPlusPlus can work its magic on the data, with my R package yorkr. You can do analysis of IPL 2021 matches, batsmen, bowlers, historical performance analysis of head-to-head clashes and performances of teams.
Note: Since the earlier instalment of IPL 2021, there are 2 key changes that have taken place in GooglyPlusPlus.
Now,
a) All charts are interactive. You can hover over charts, click, double-click to get more details. To see more details on how to use the interactive charts, see my post GooglyPlusPlus2021 is now fully interactive!
You can try out my app GooglyPlusPlus2021 by clicking GooglyPlusPlus2021
The code for my R package yorkr is available at Github at yorkr
You can clone/fork GooglyPlusPlus2021 from github at gpp2021-6
IPL 2021 is already underway.
Some key analysis and highlights of the 2 recently concluded IPL matches
CSK vs MI
KKR vs RCB
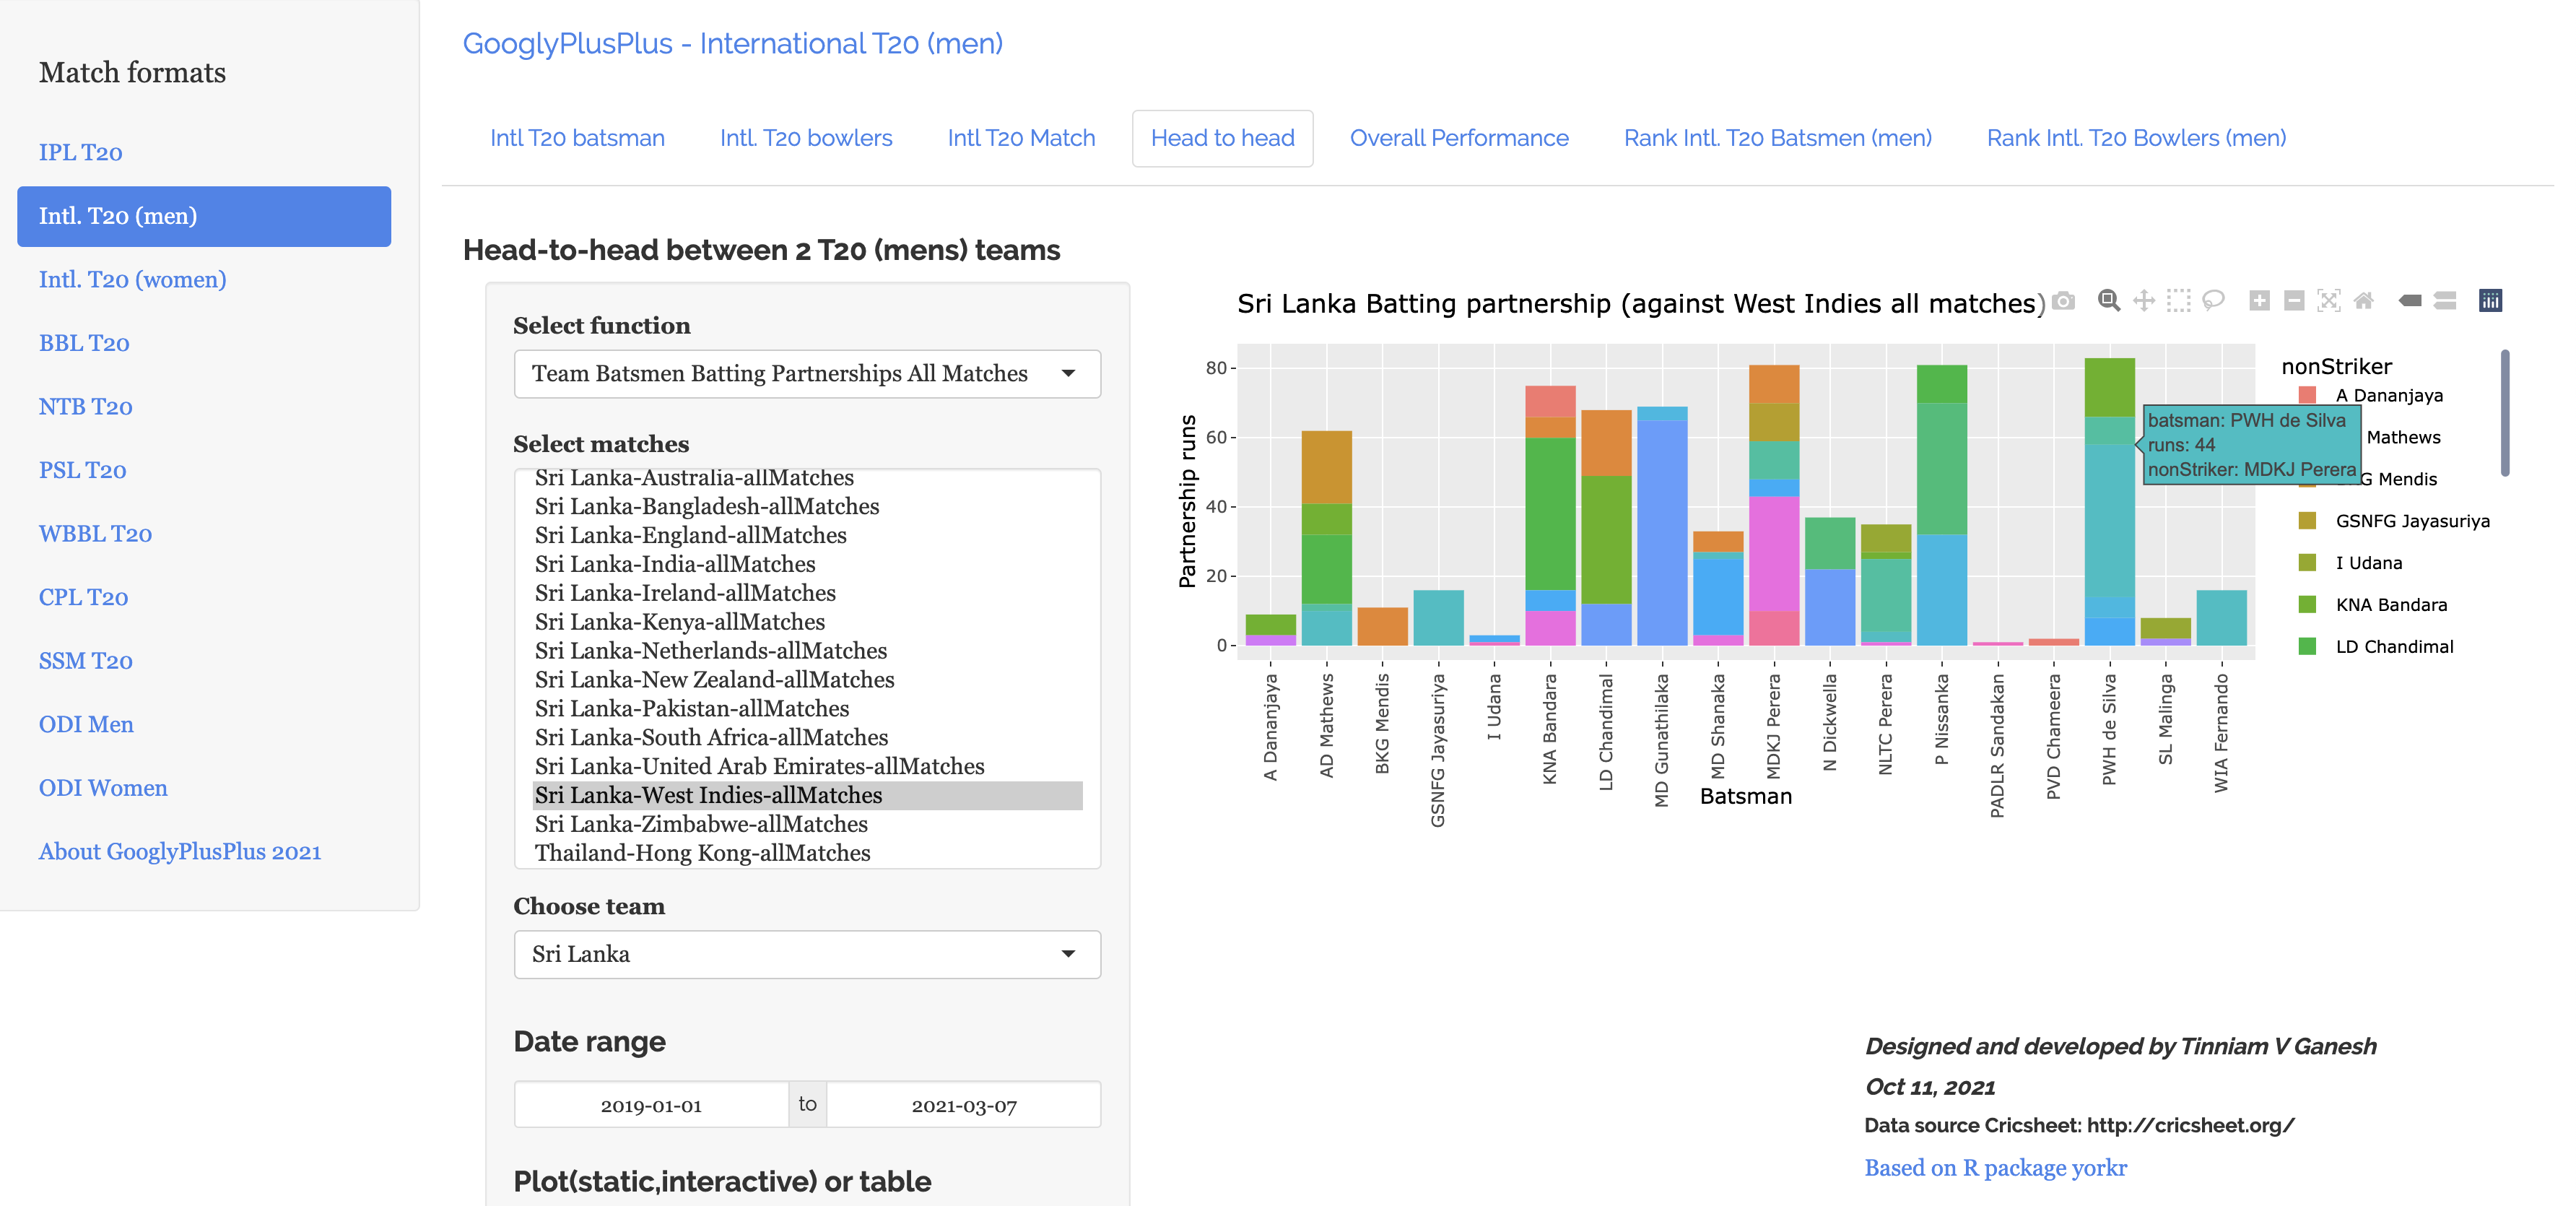
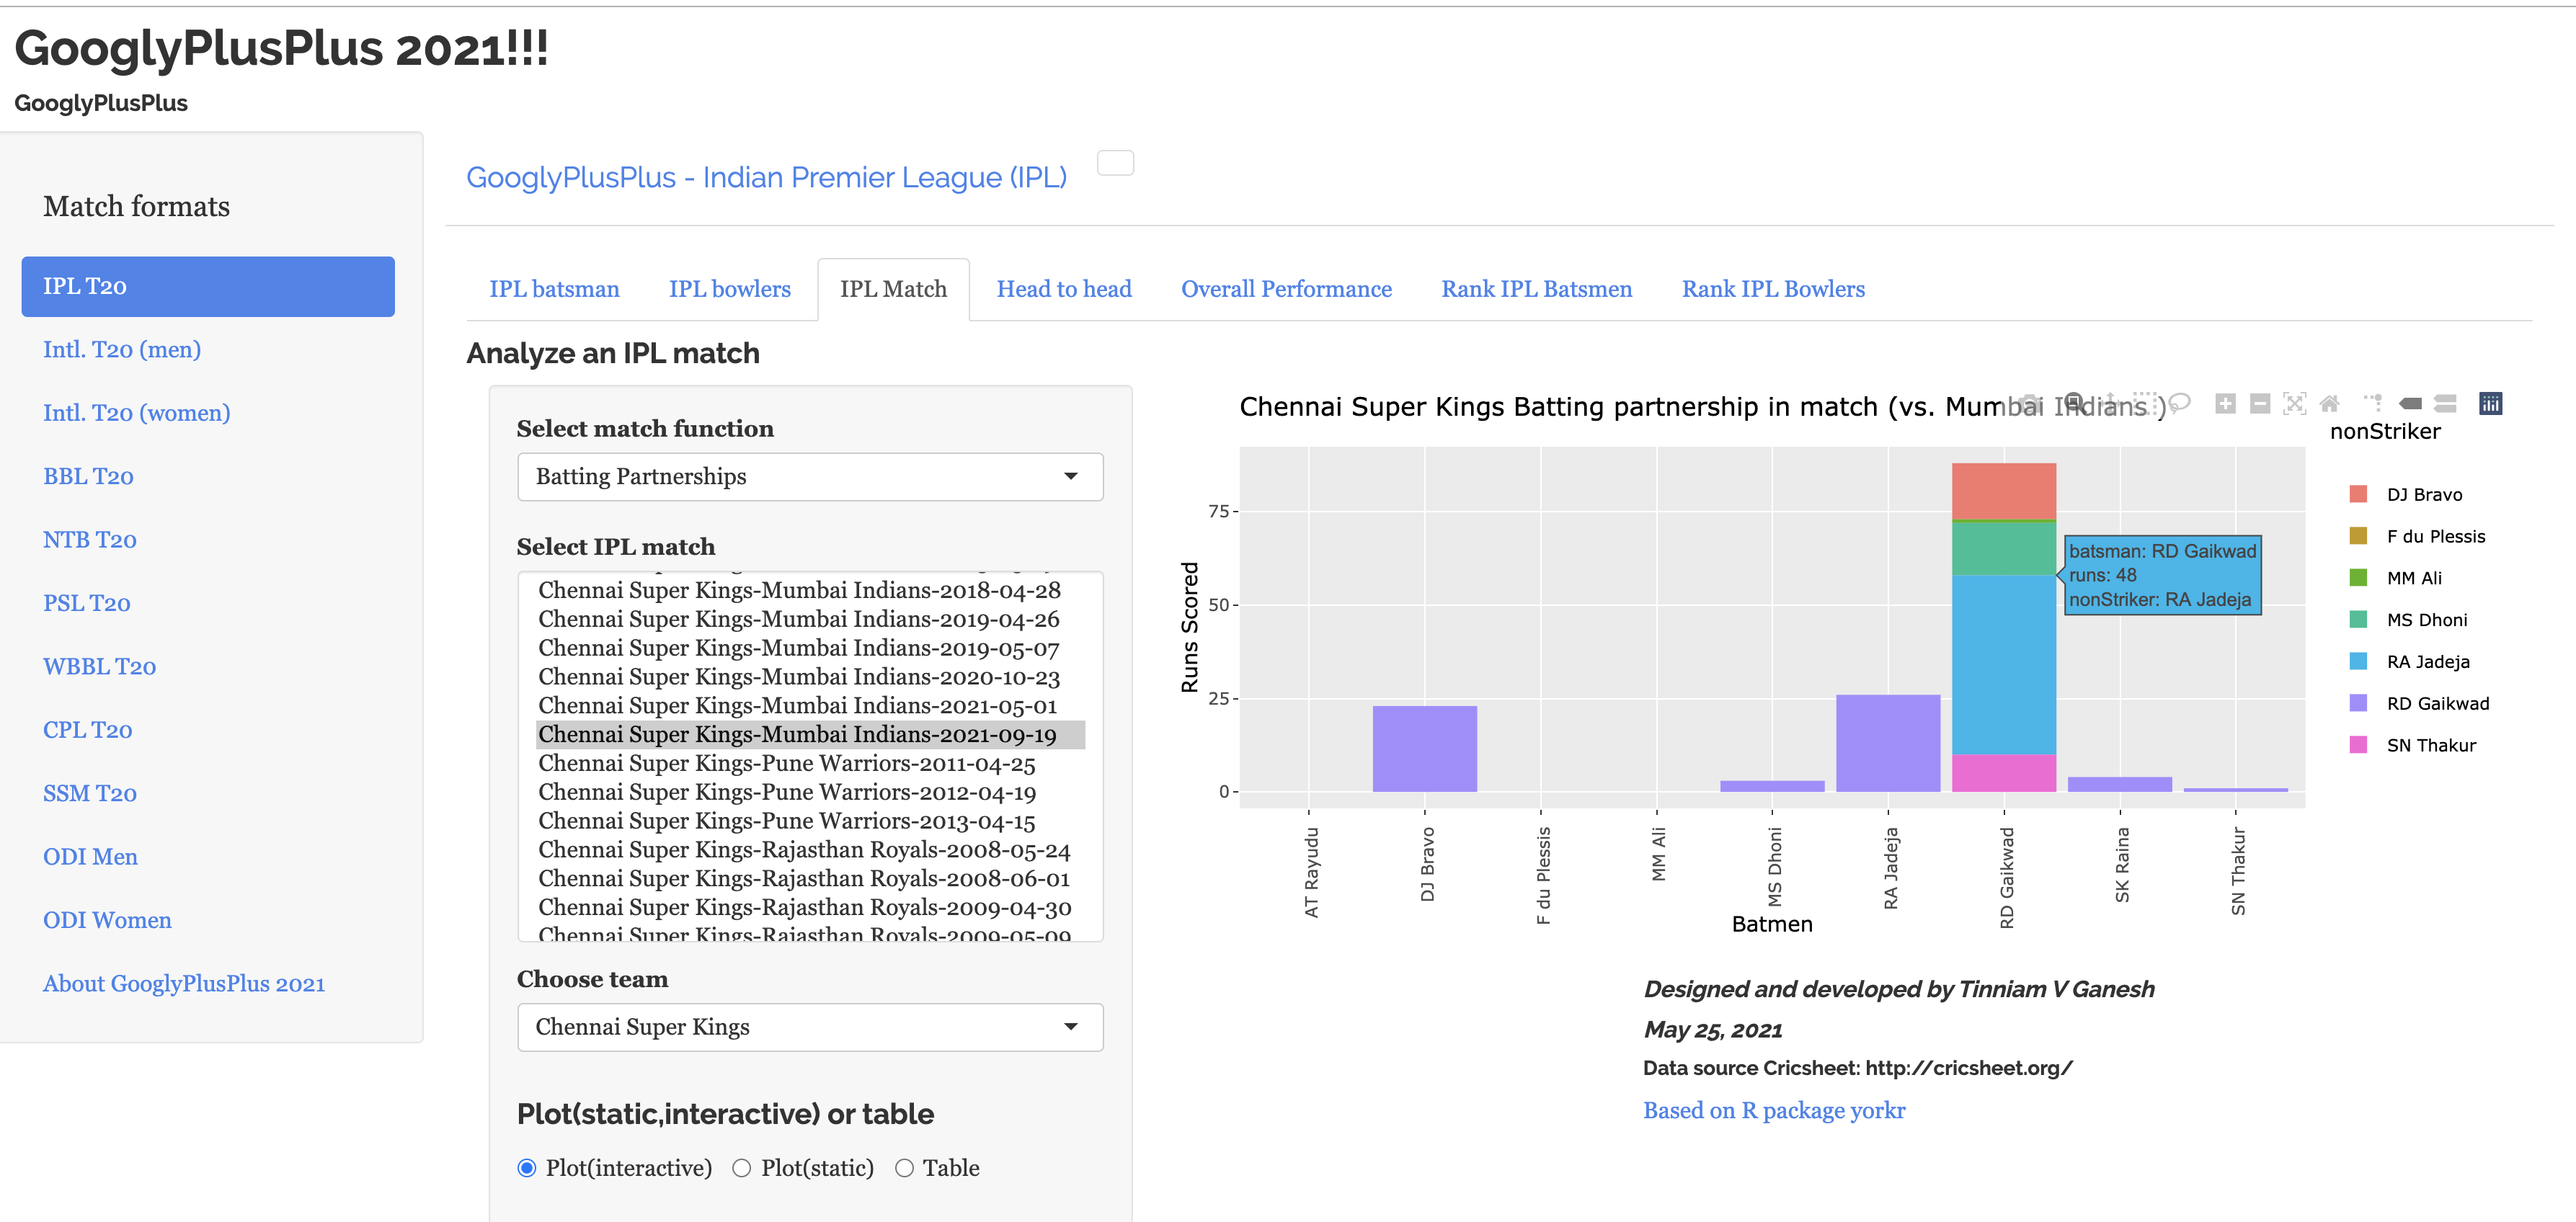
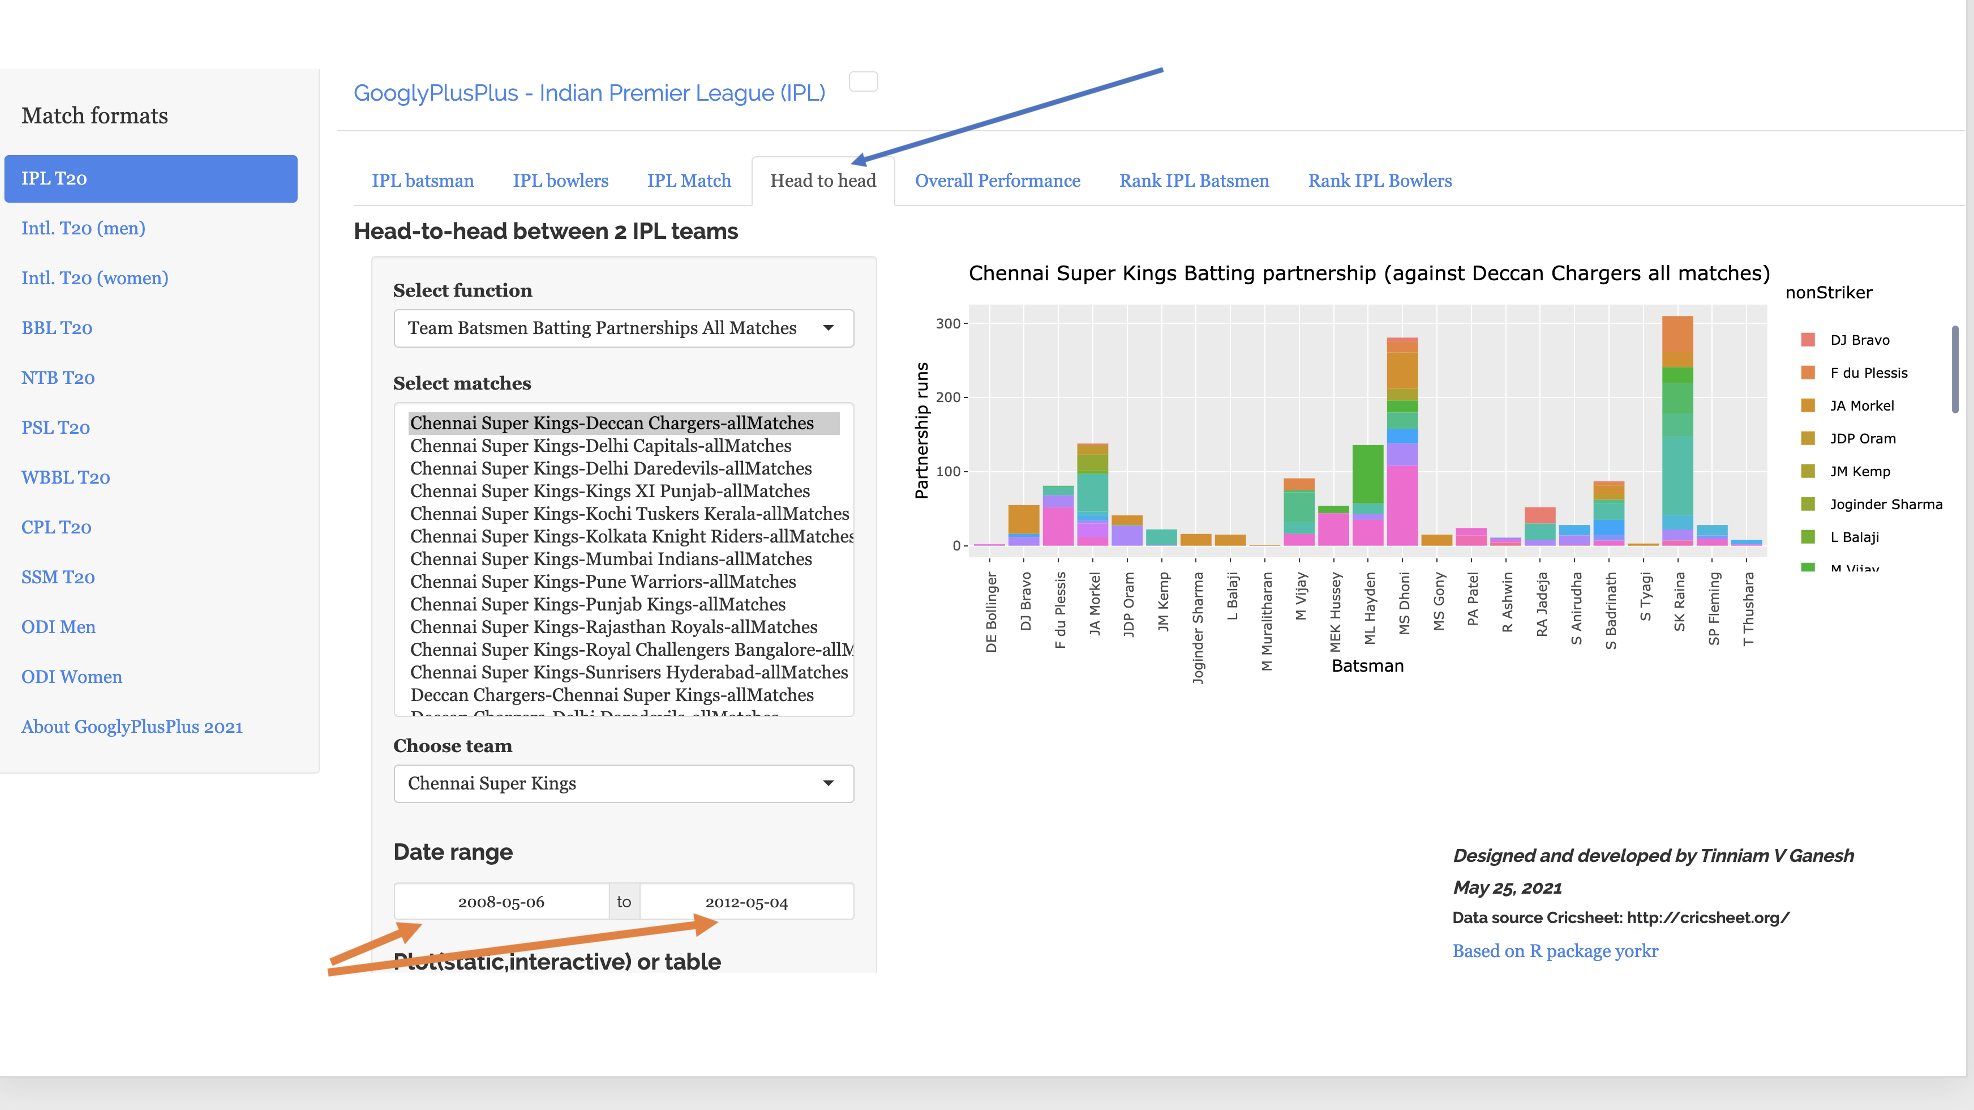
a) CSK vs MI (19 Sep 2021) – Batting Partnerships (CSK)
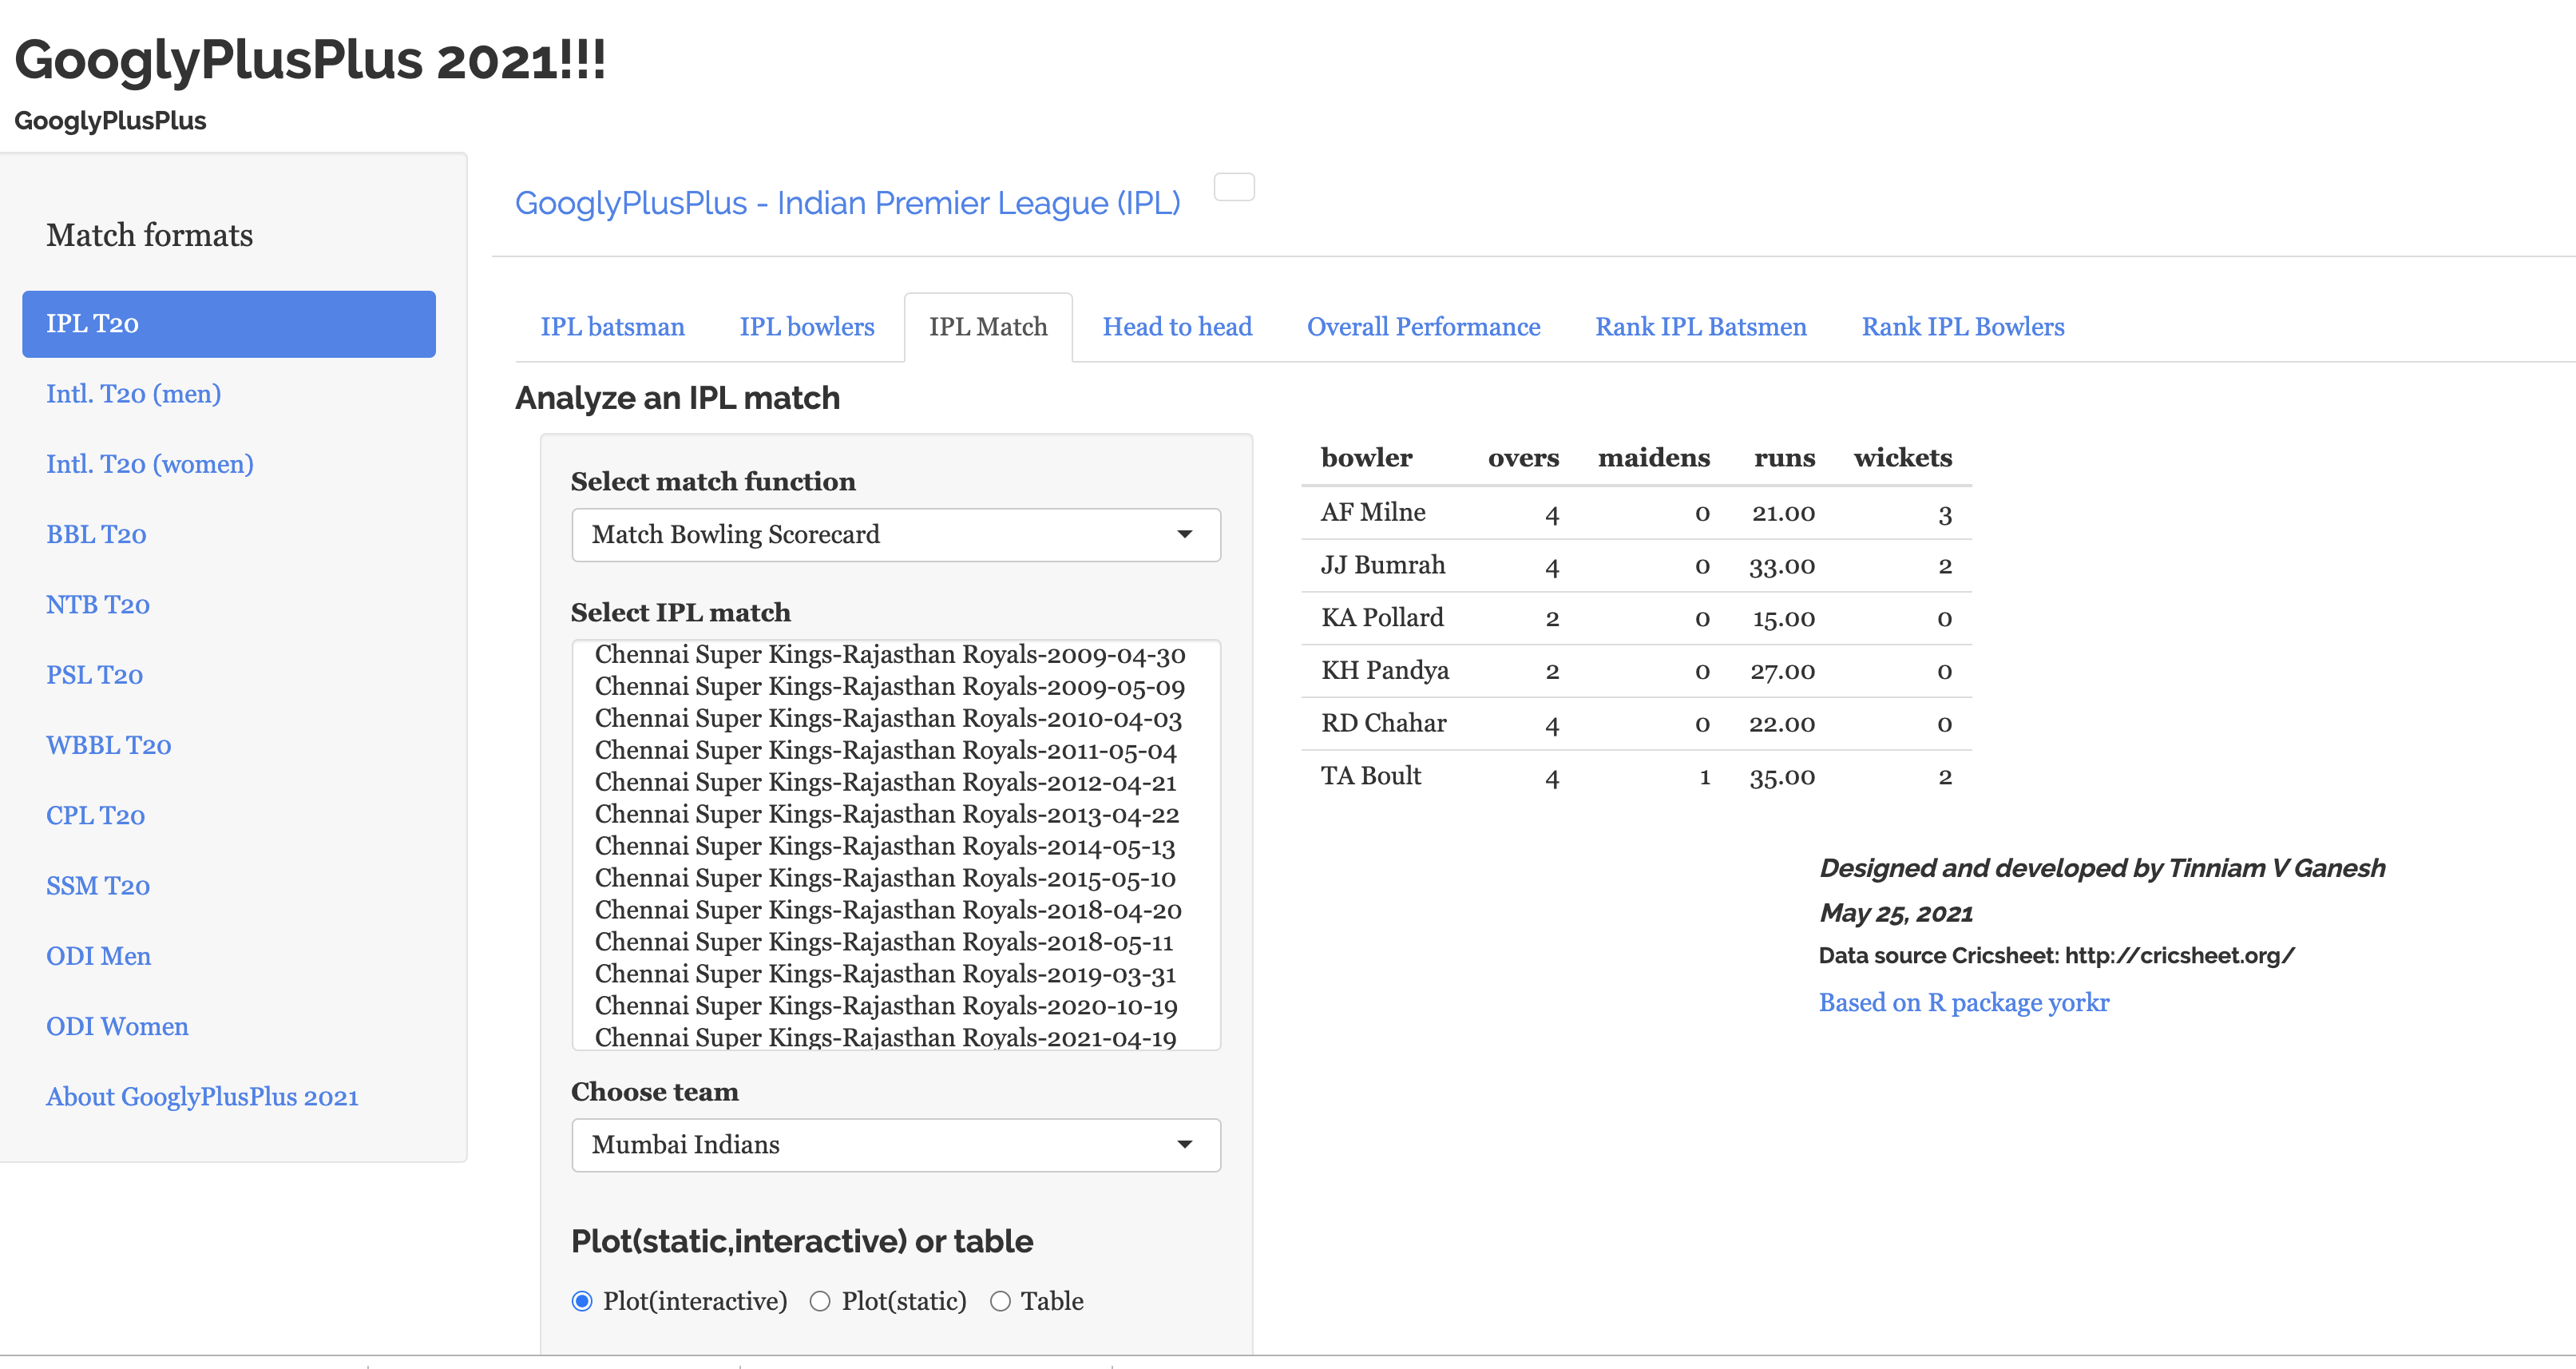
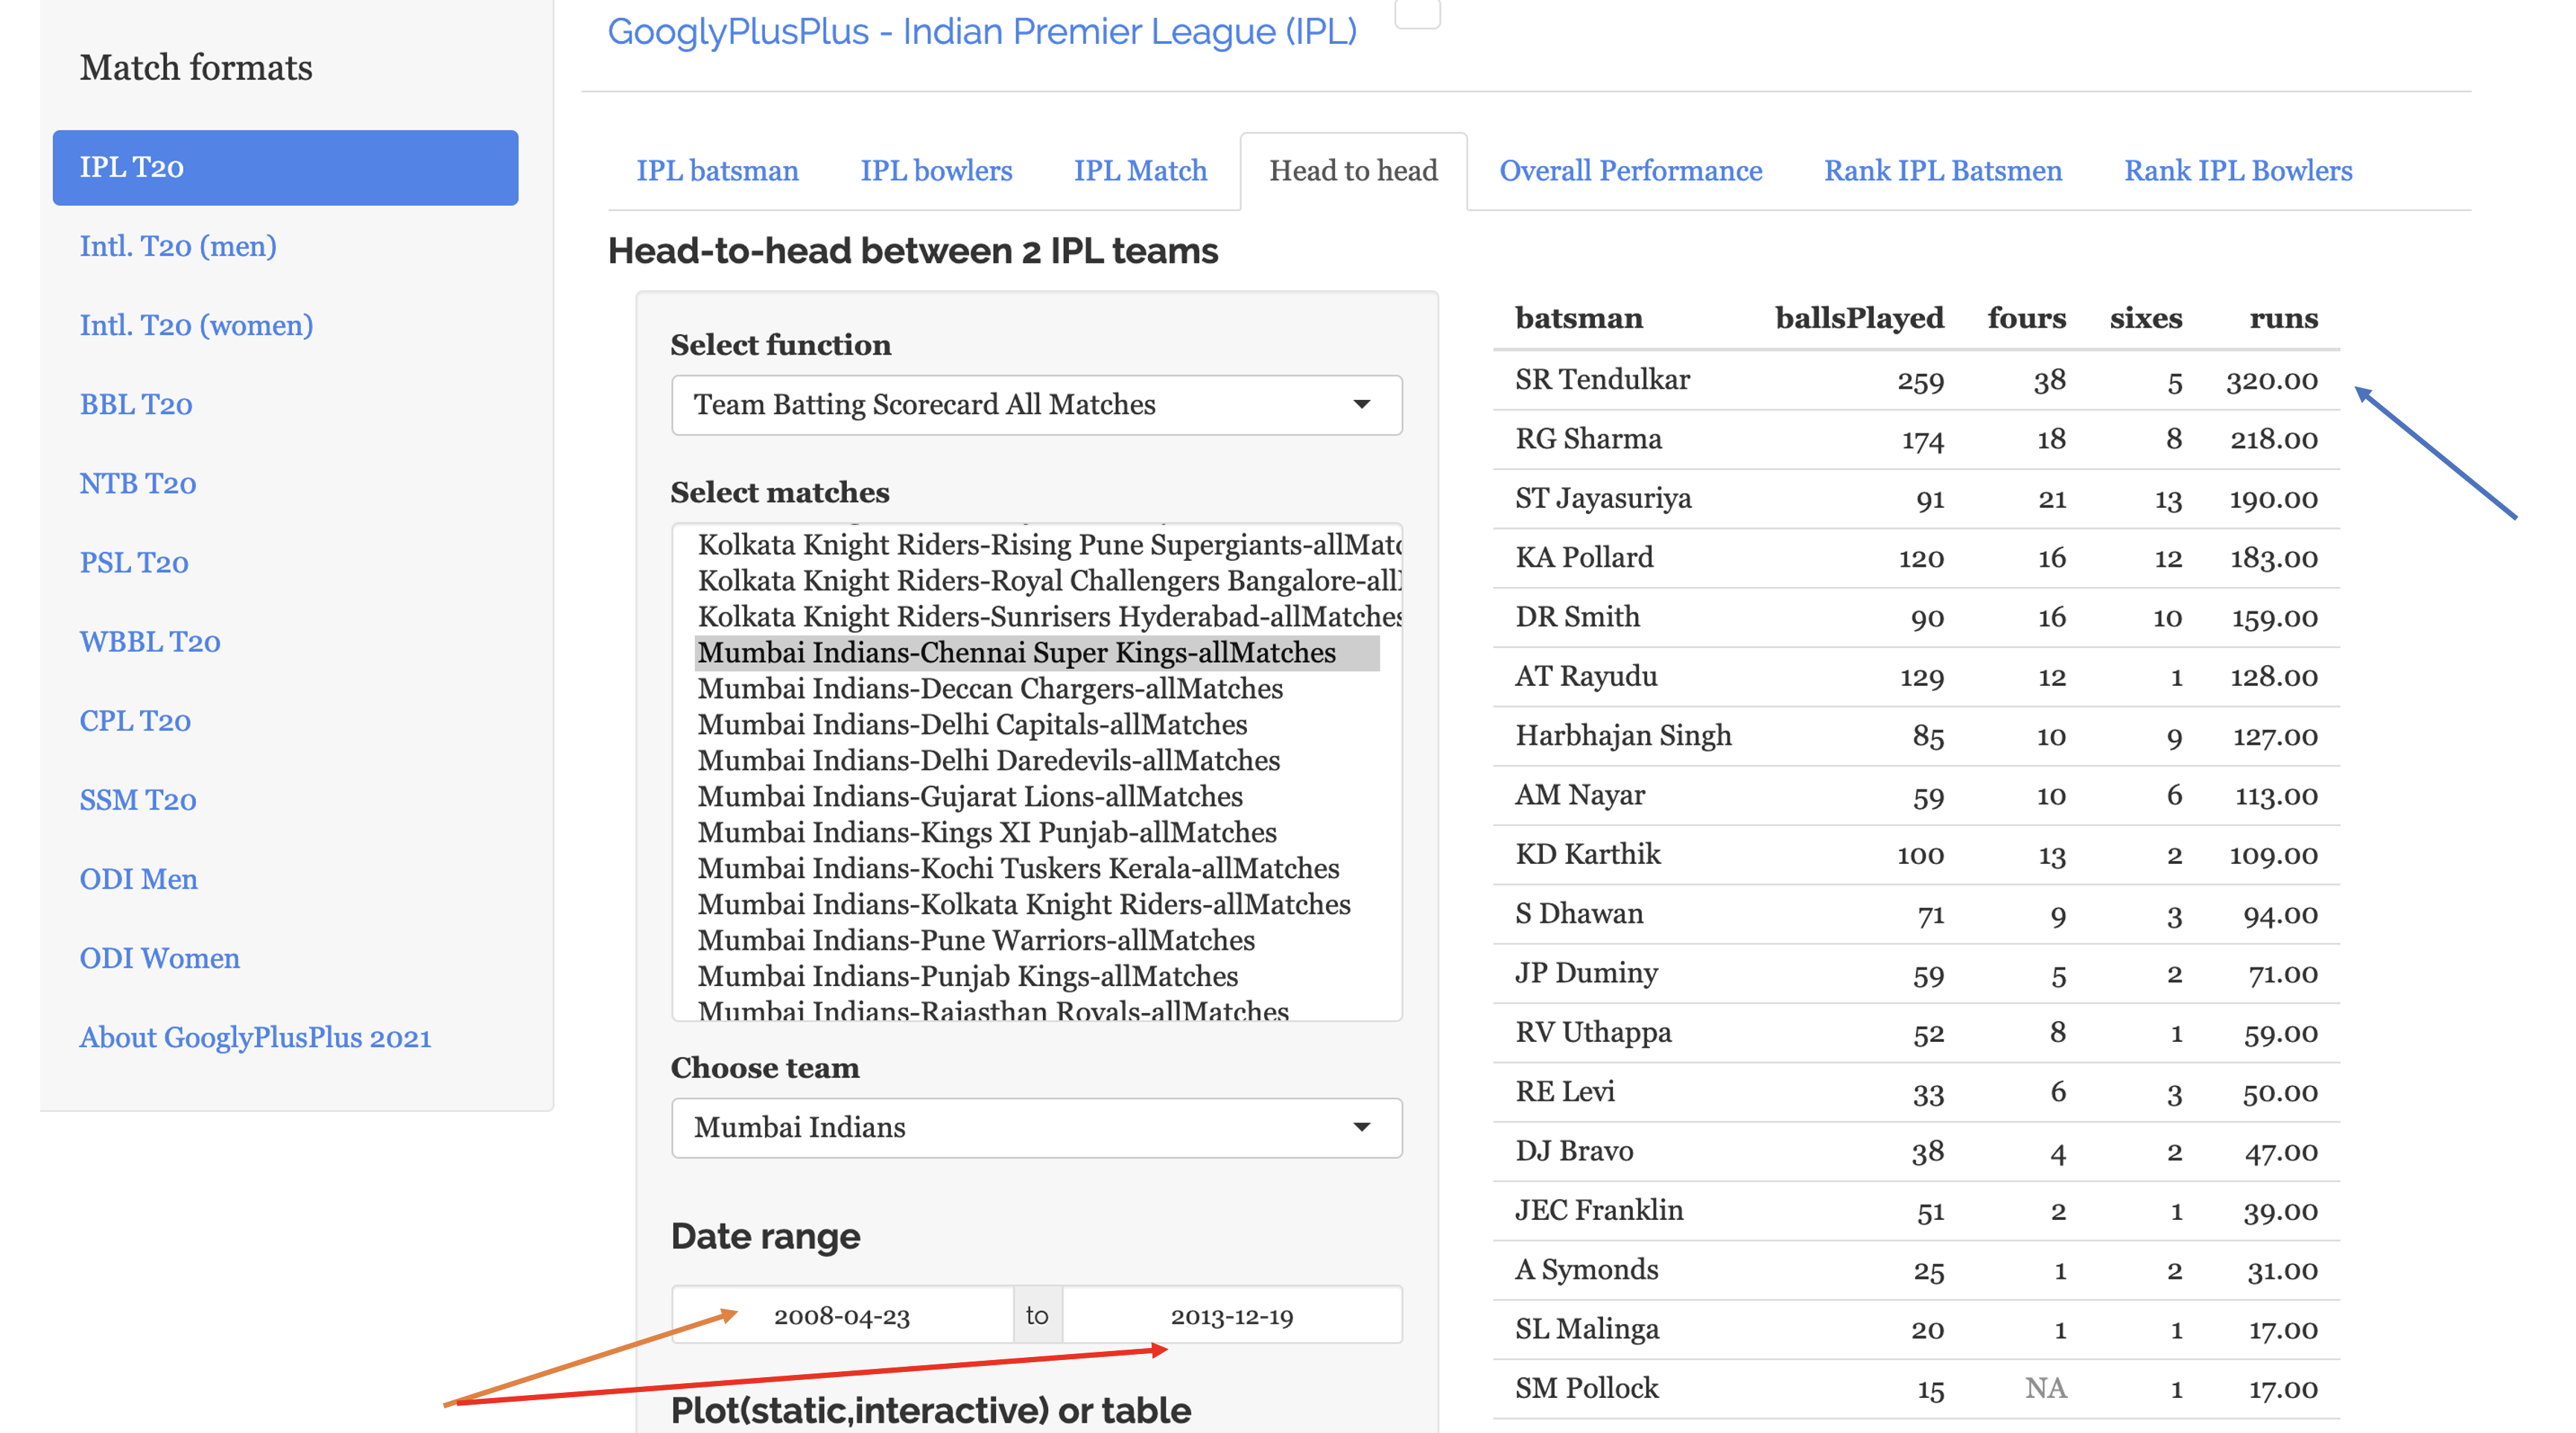
b) CSK vs MI (19 Sep 2021) – Bowling scorecard (MI)
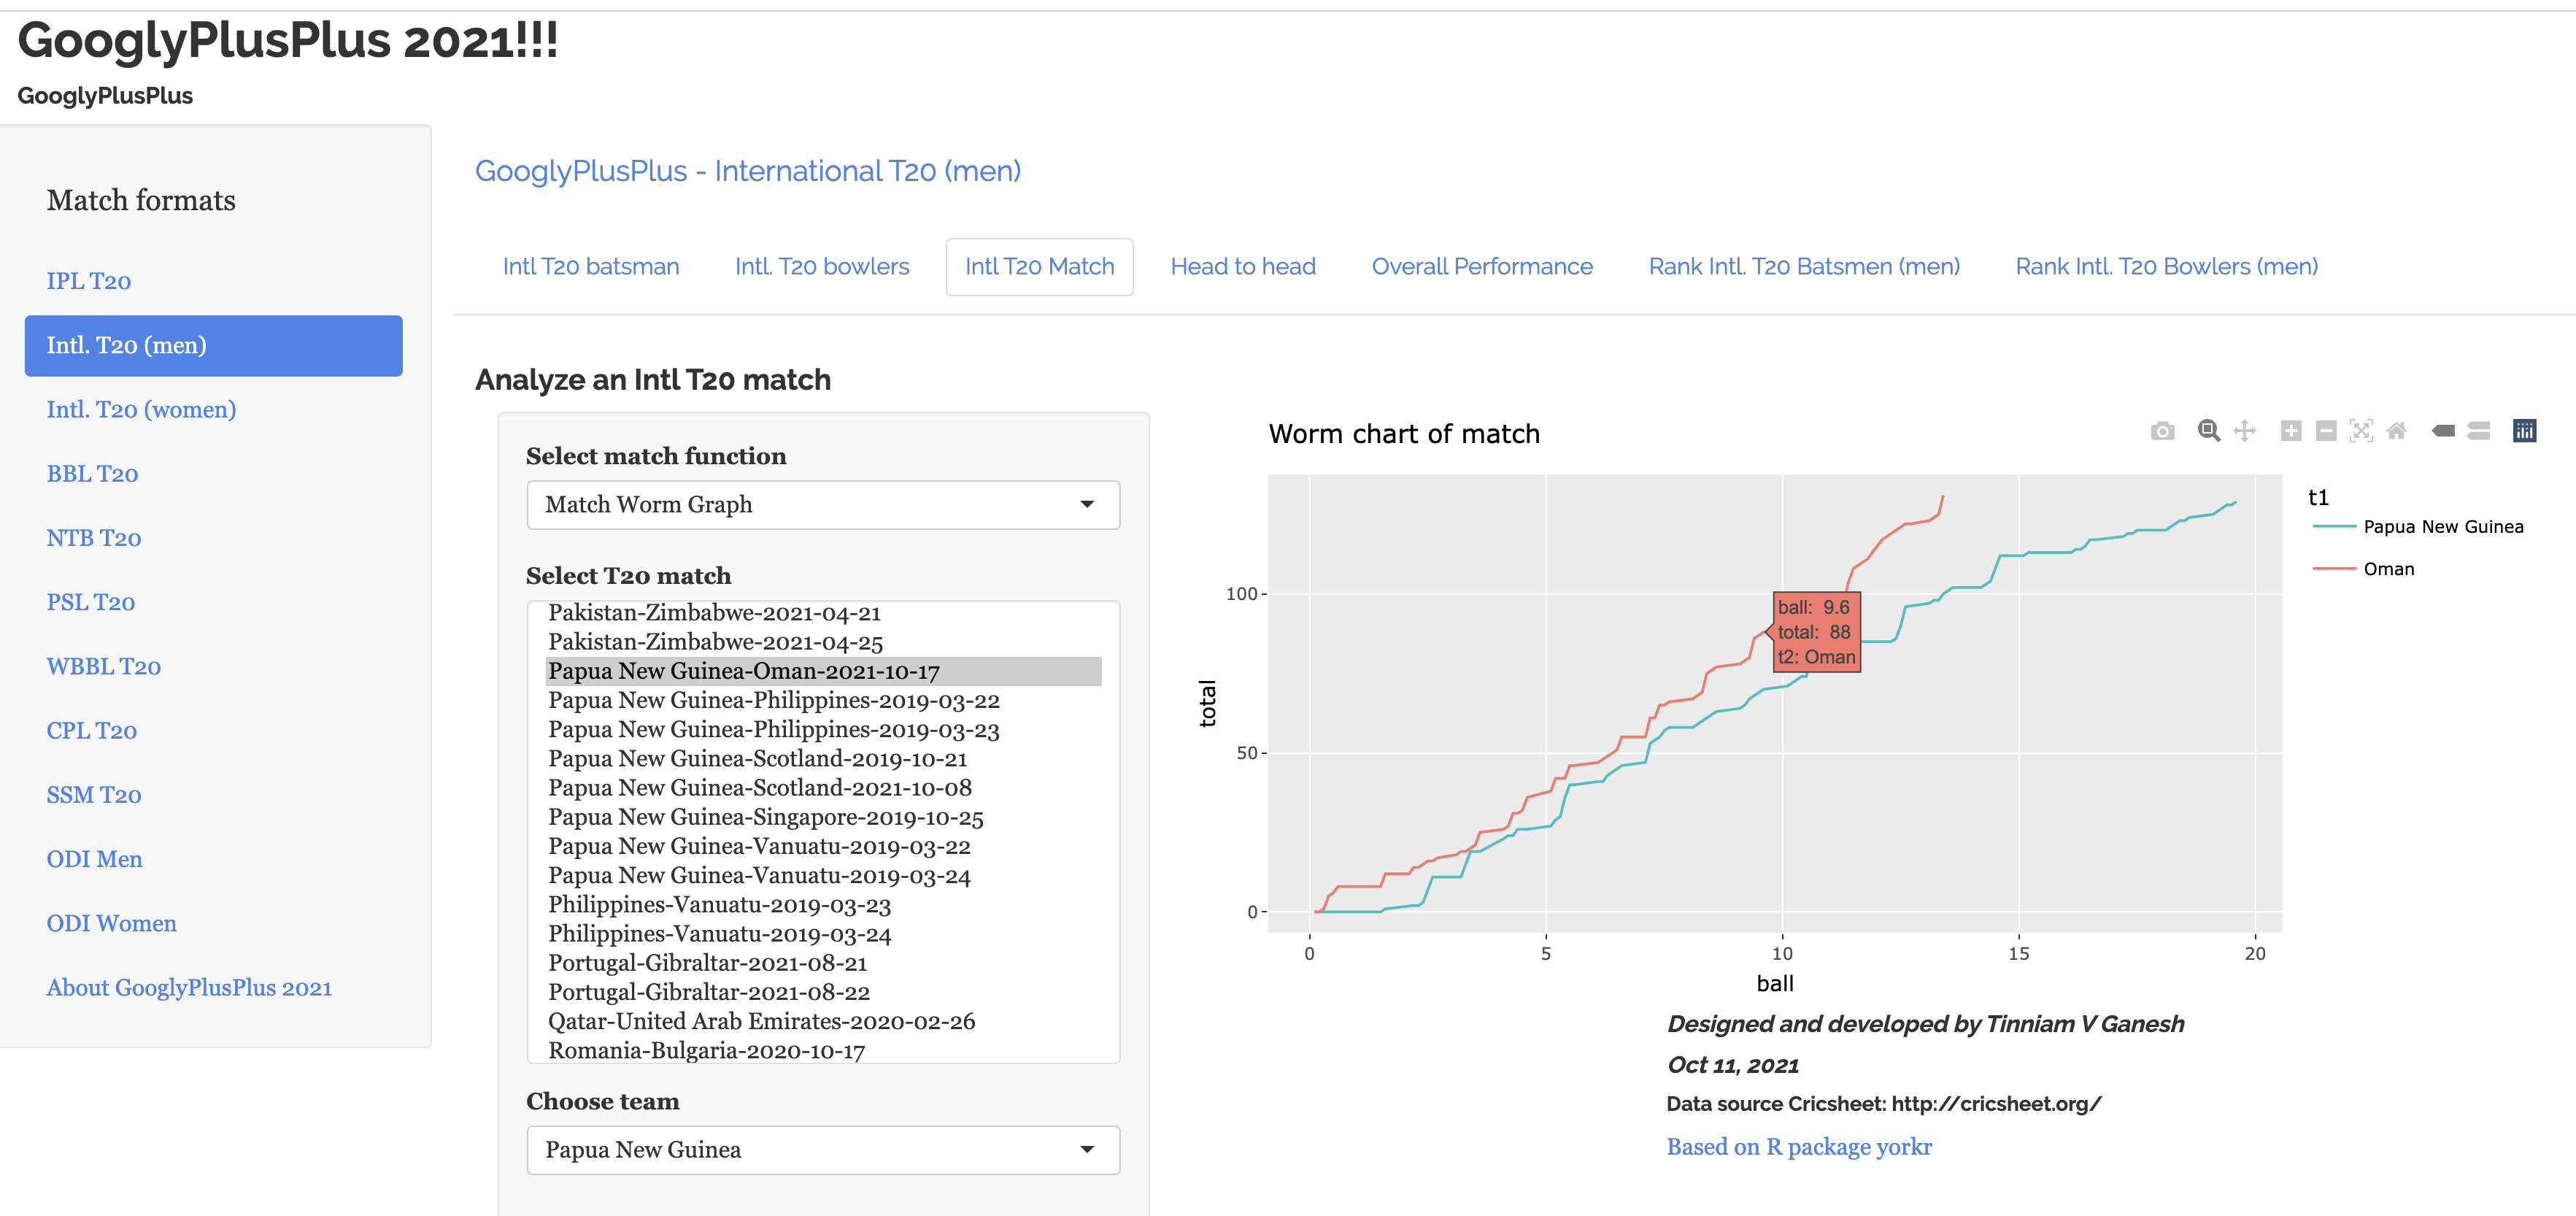
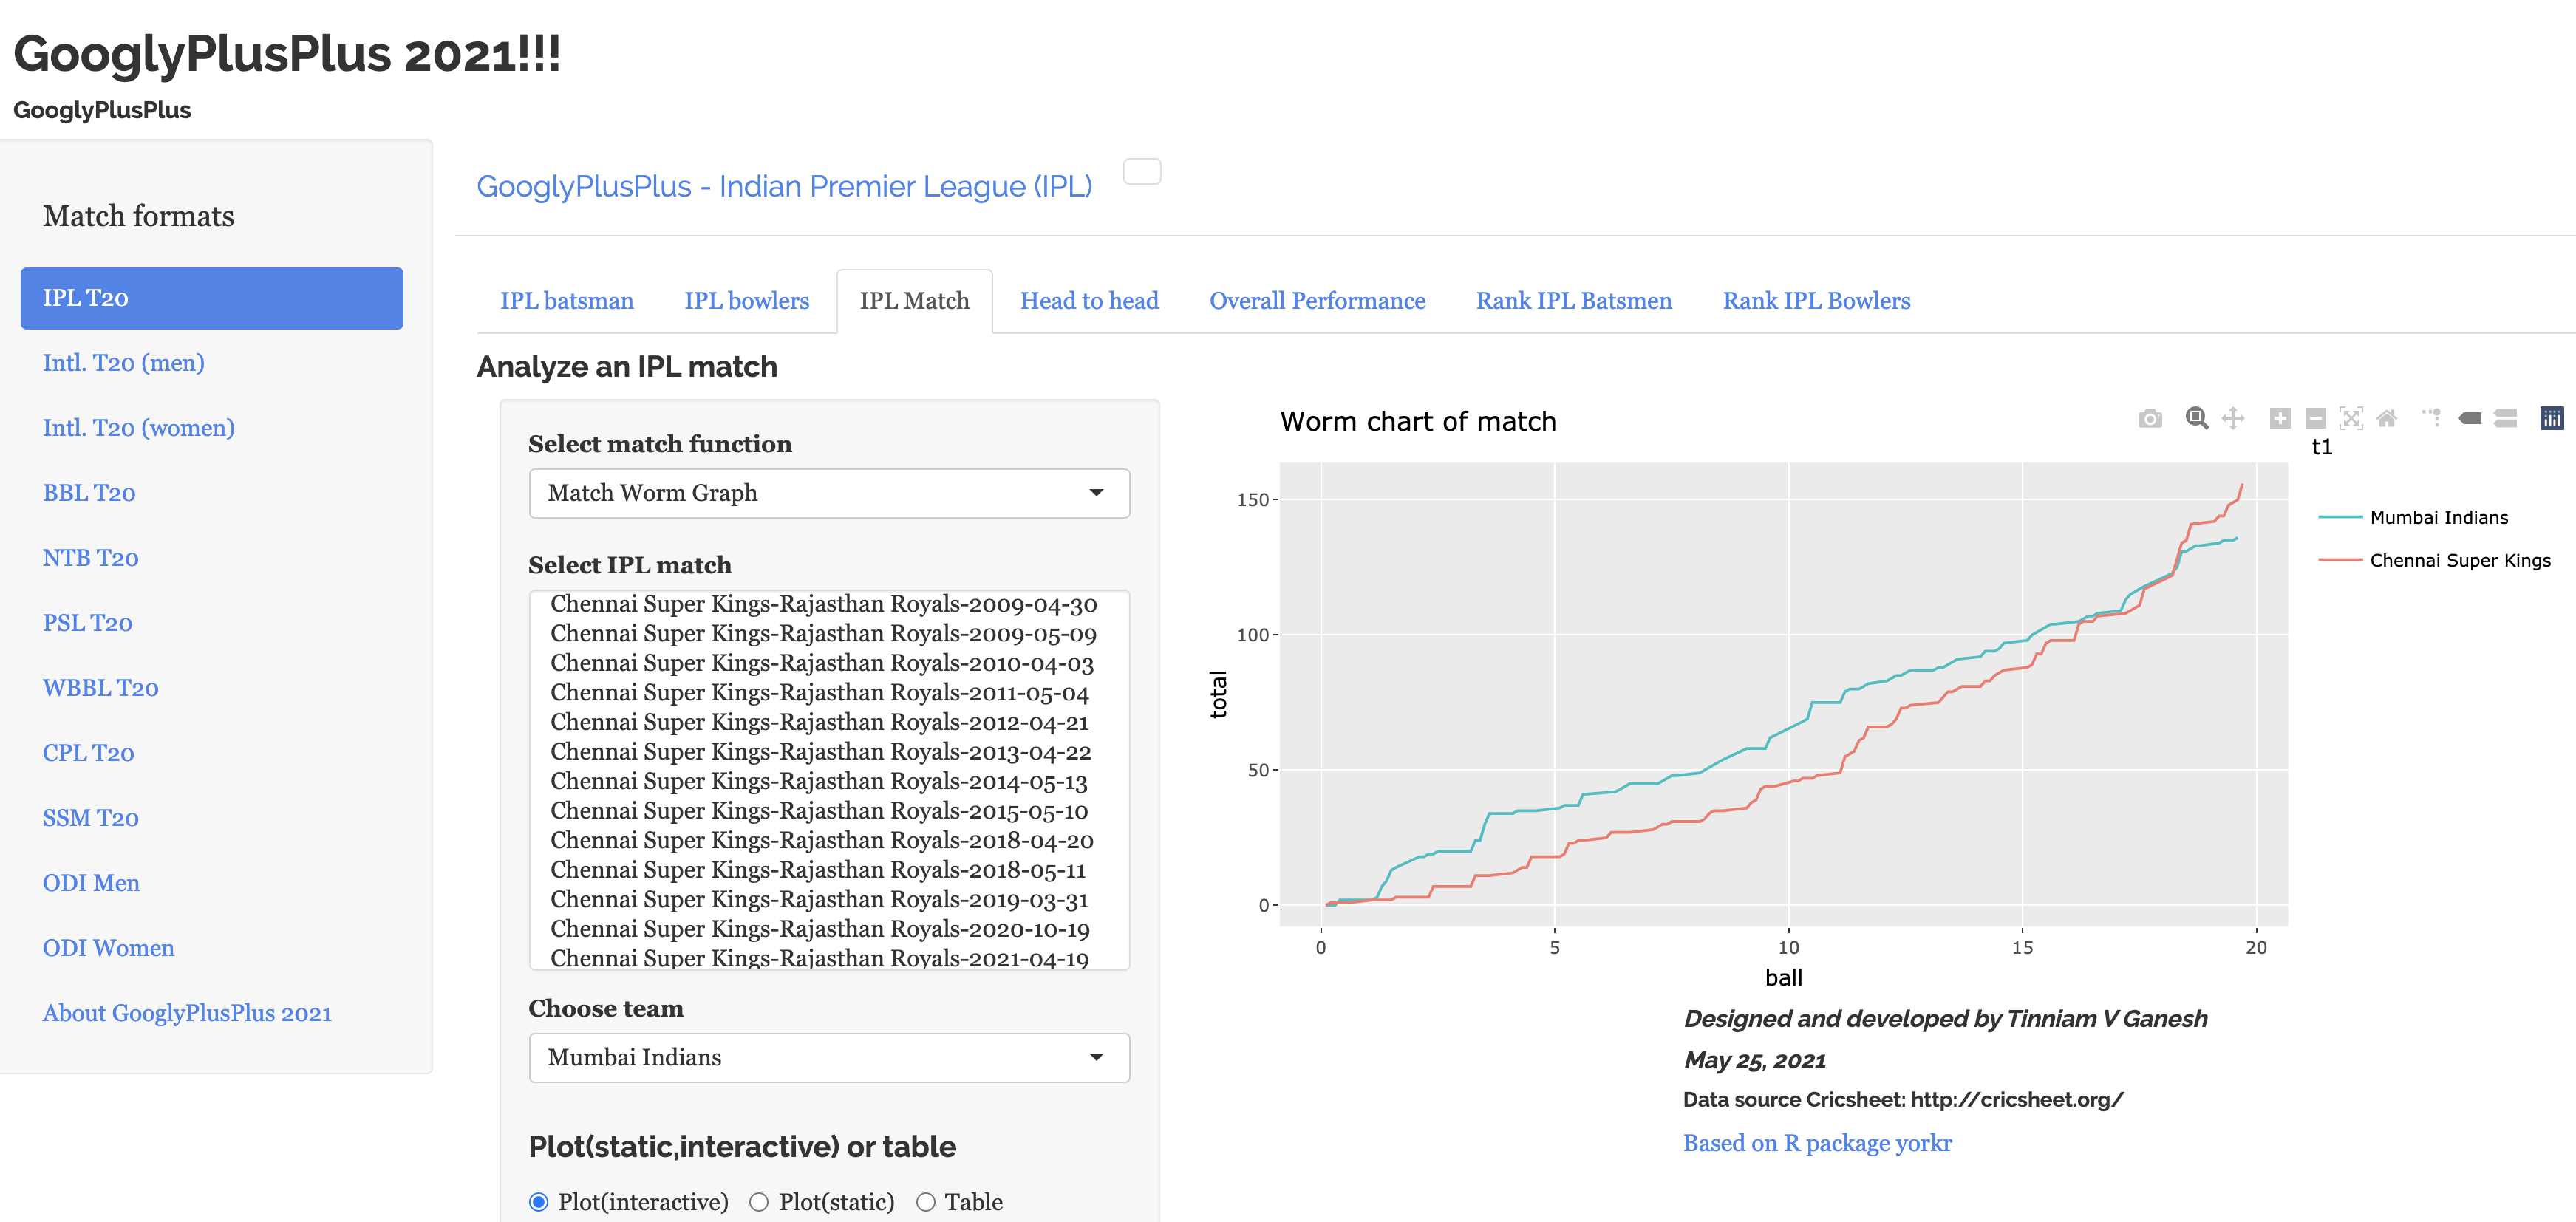
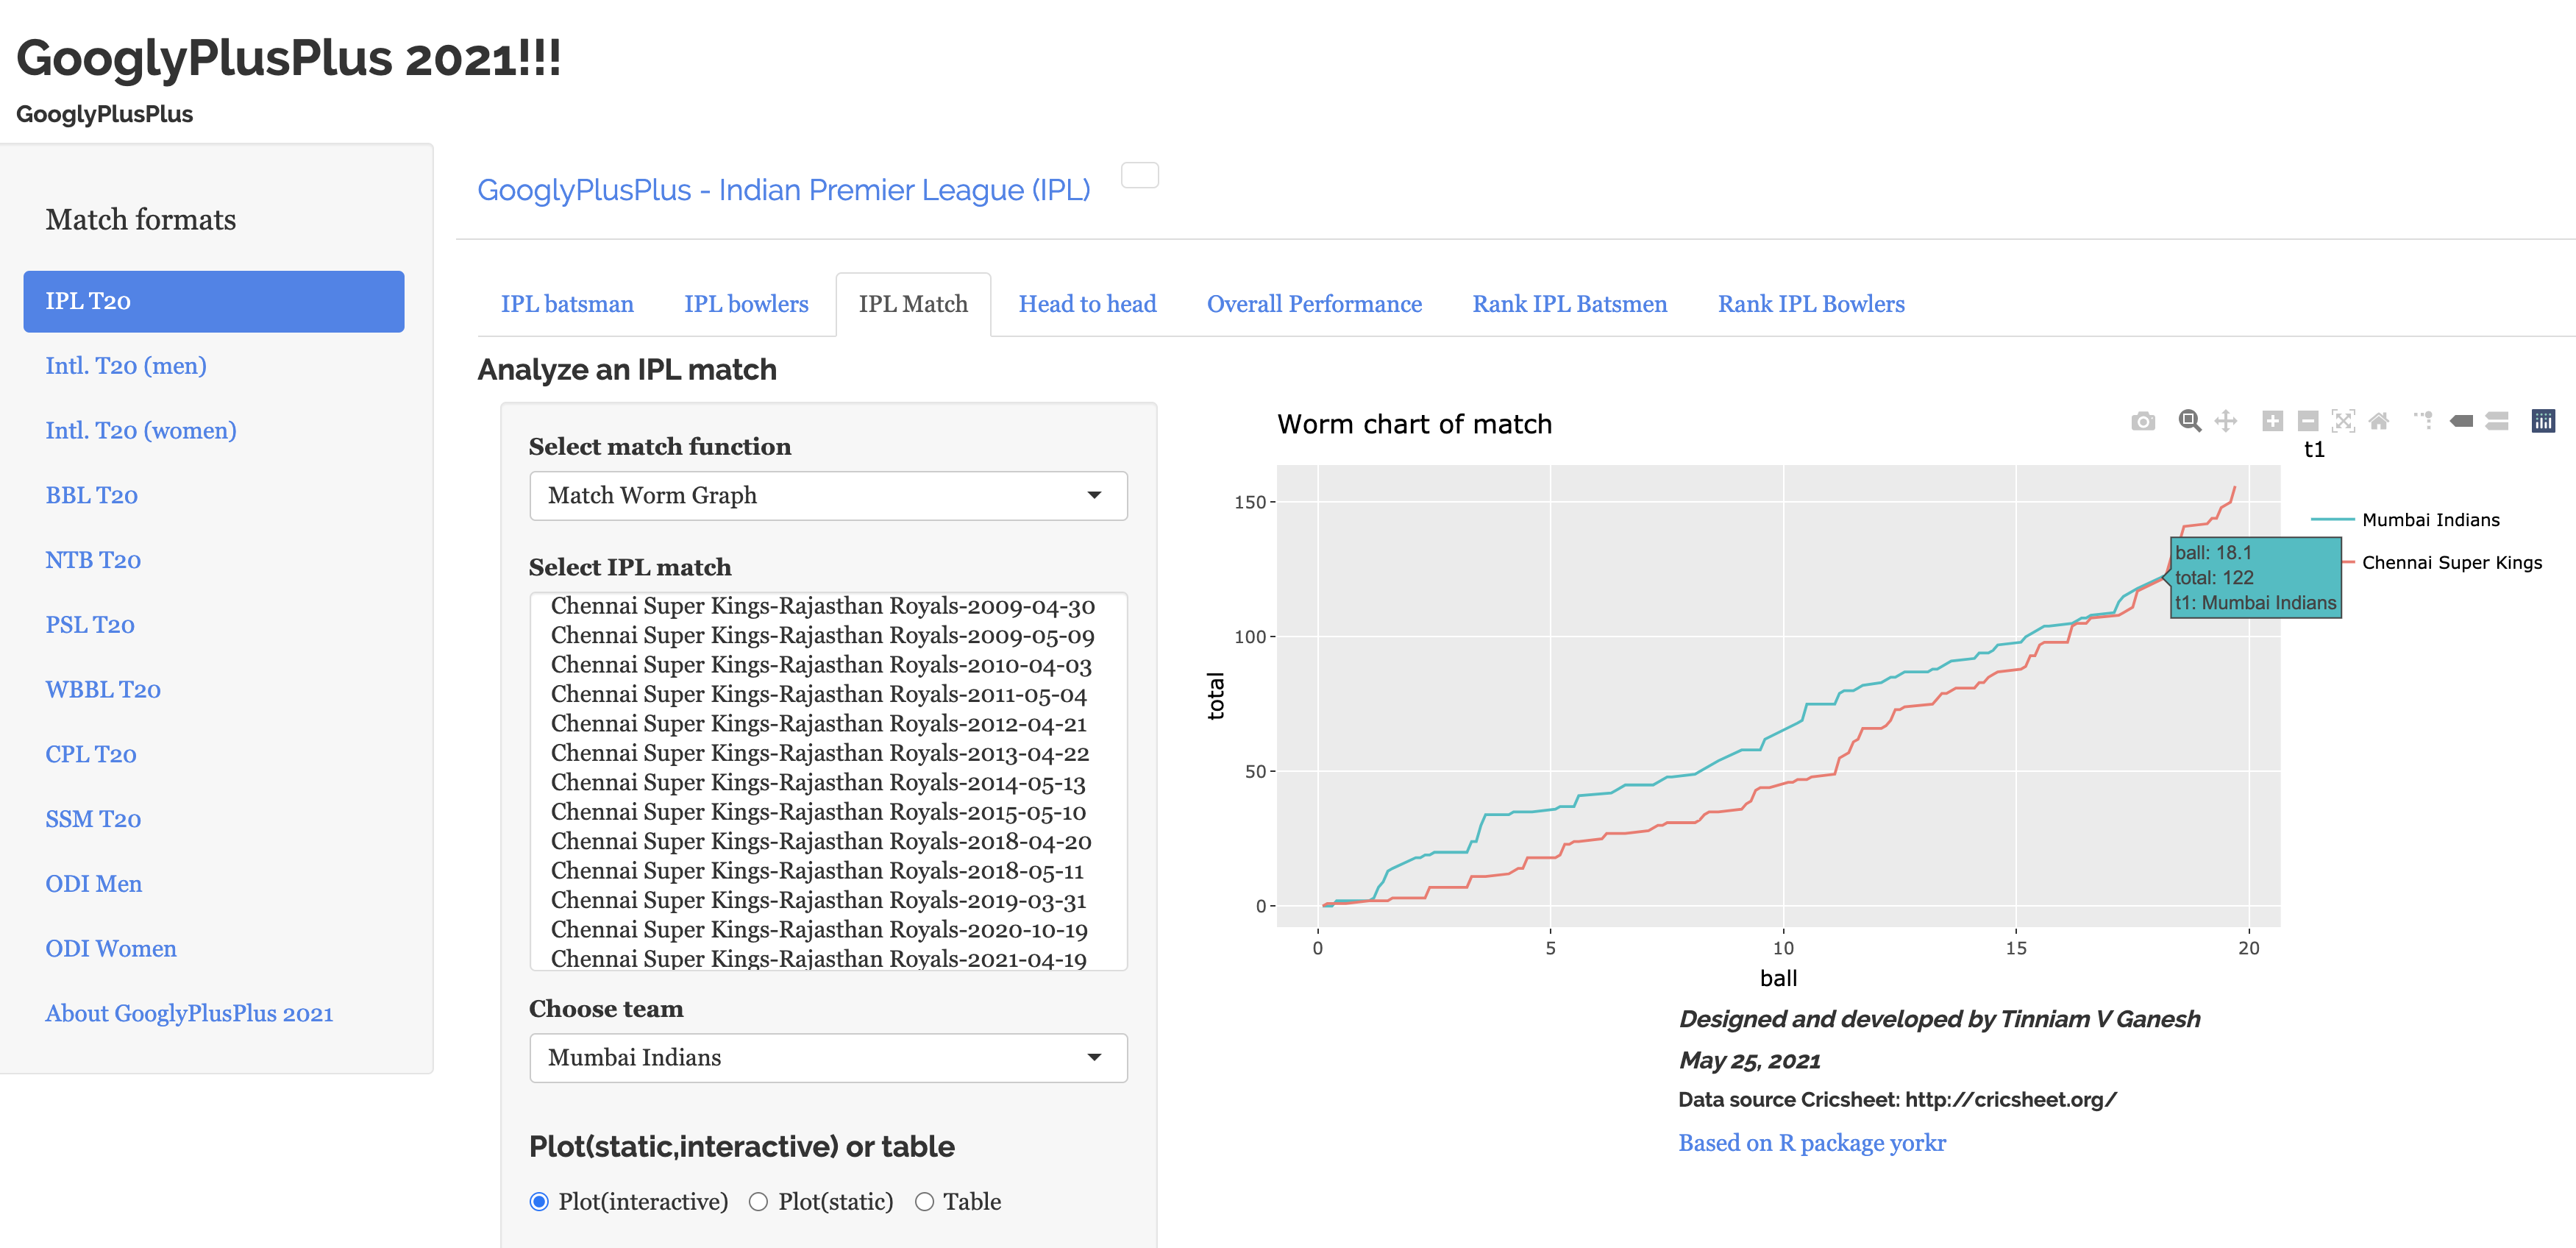
c) CSK vs MI (19 Sep 2021) –Match worm chart
Even though MI had a much better start and were cruising along to a victory, they lost the plot around the 18.1 th over as seen below (hover on the chart)
d
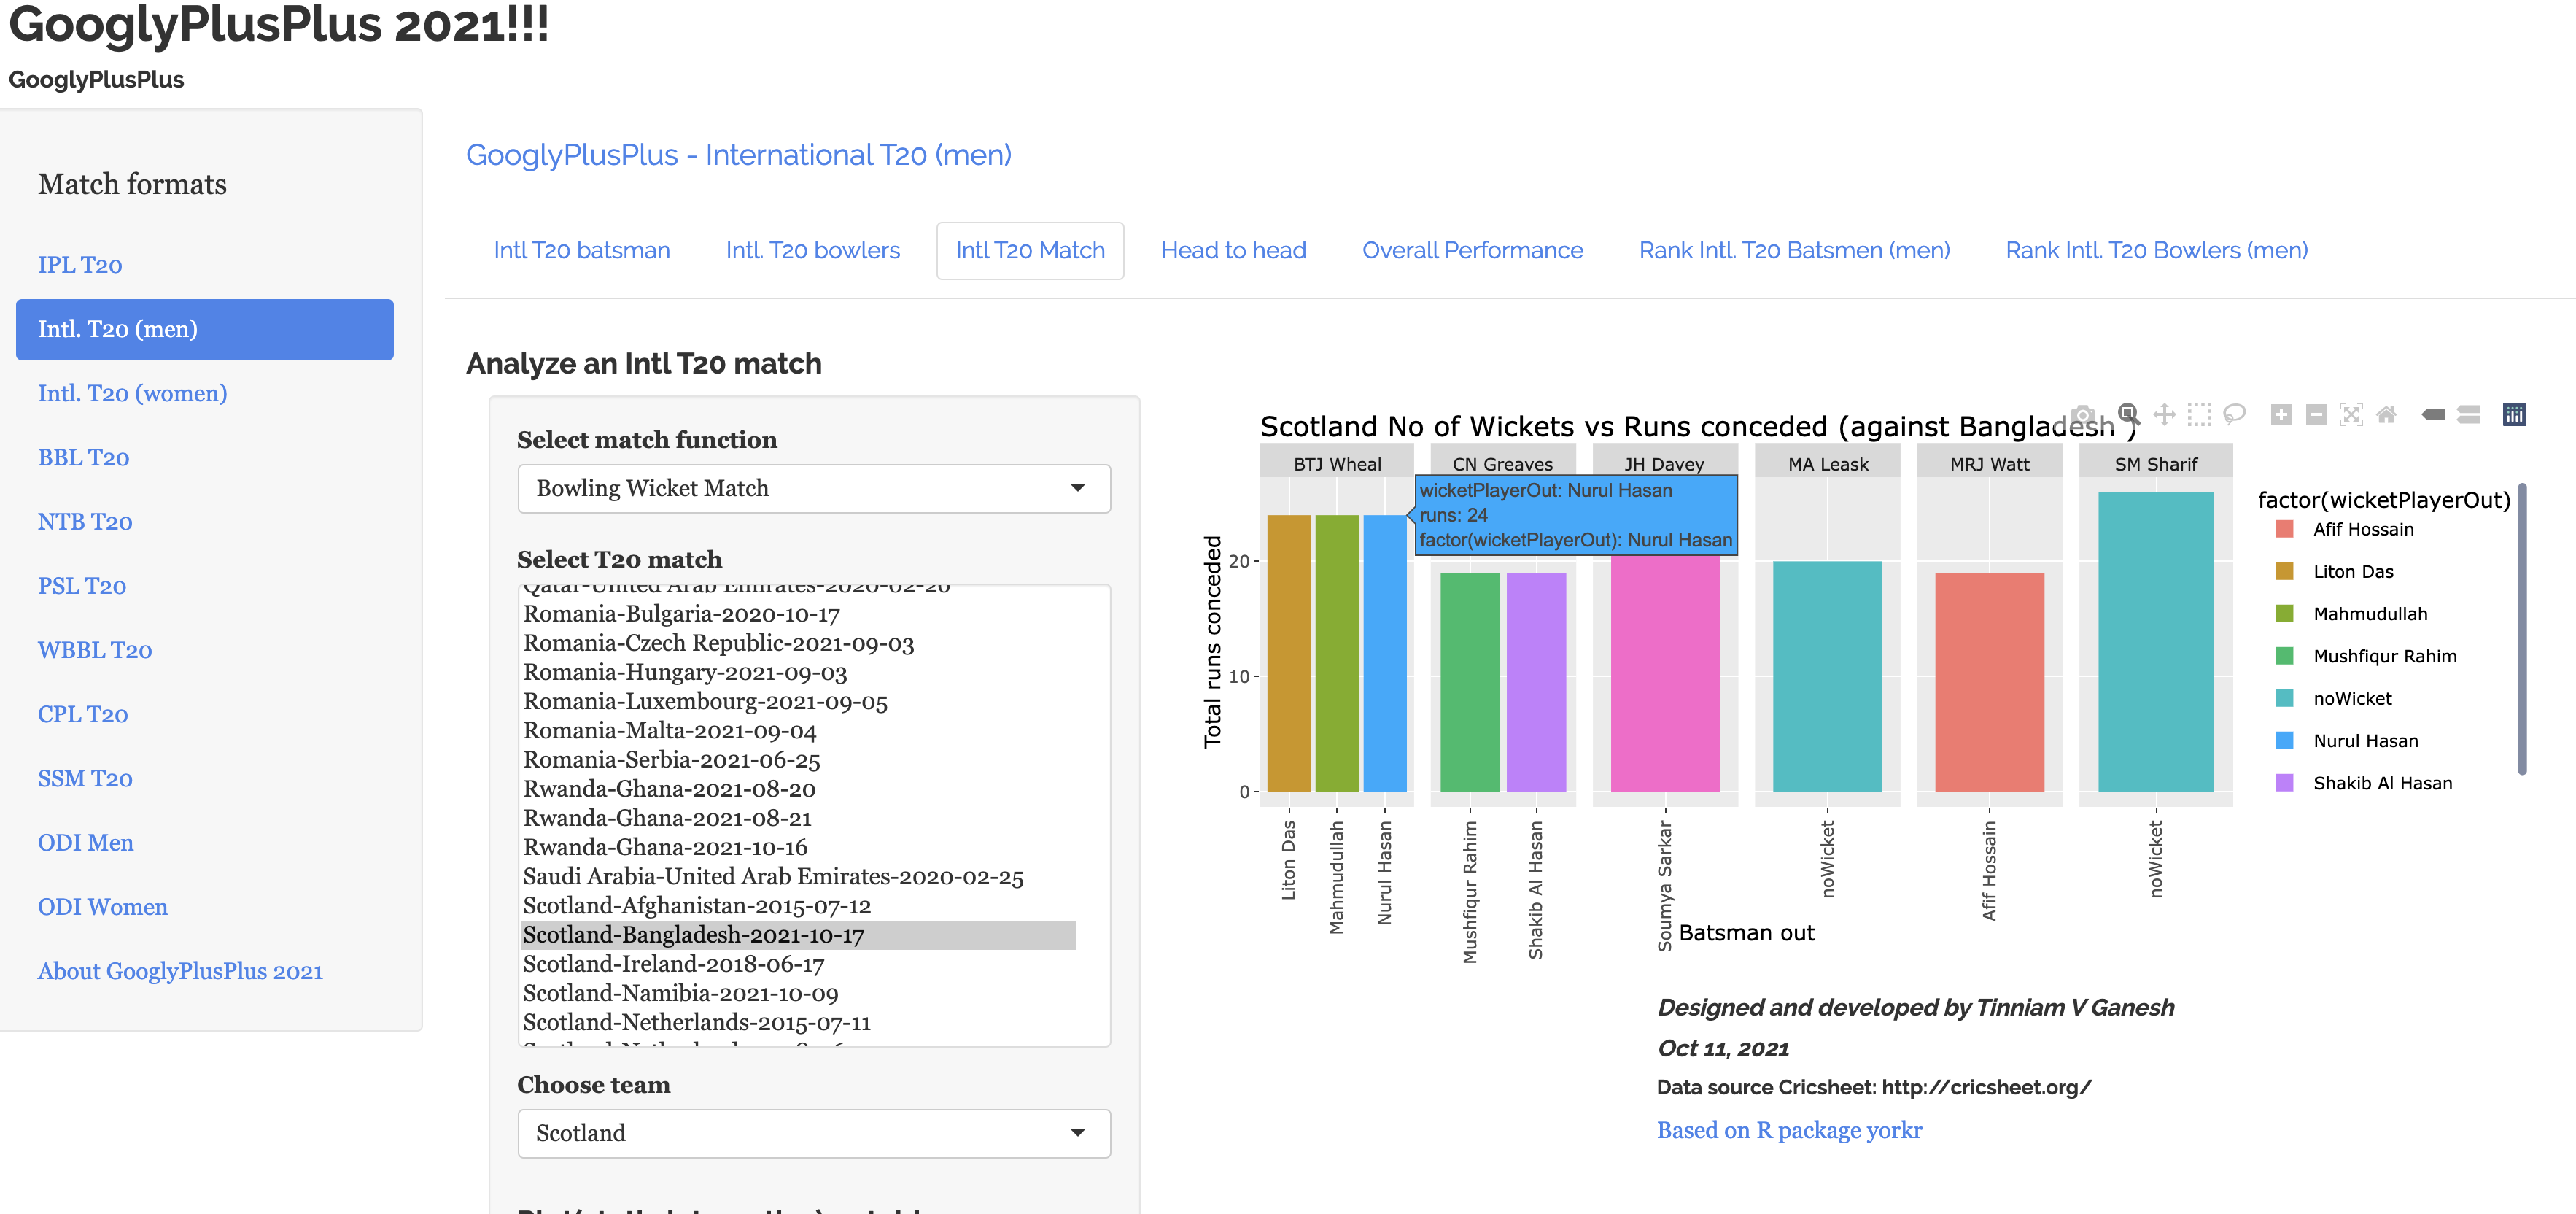
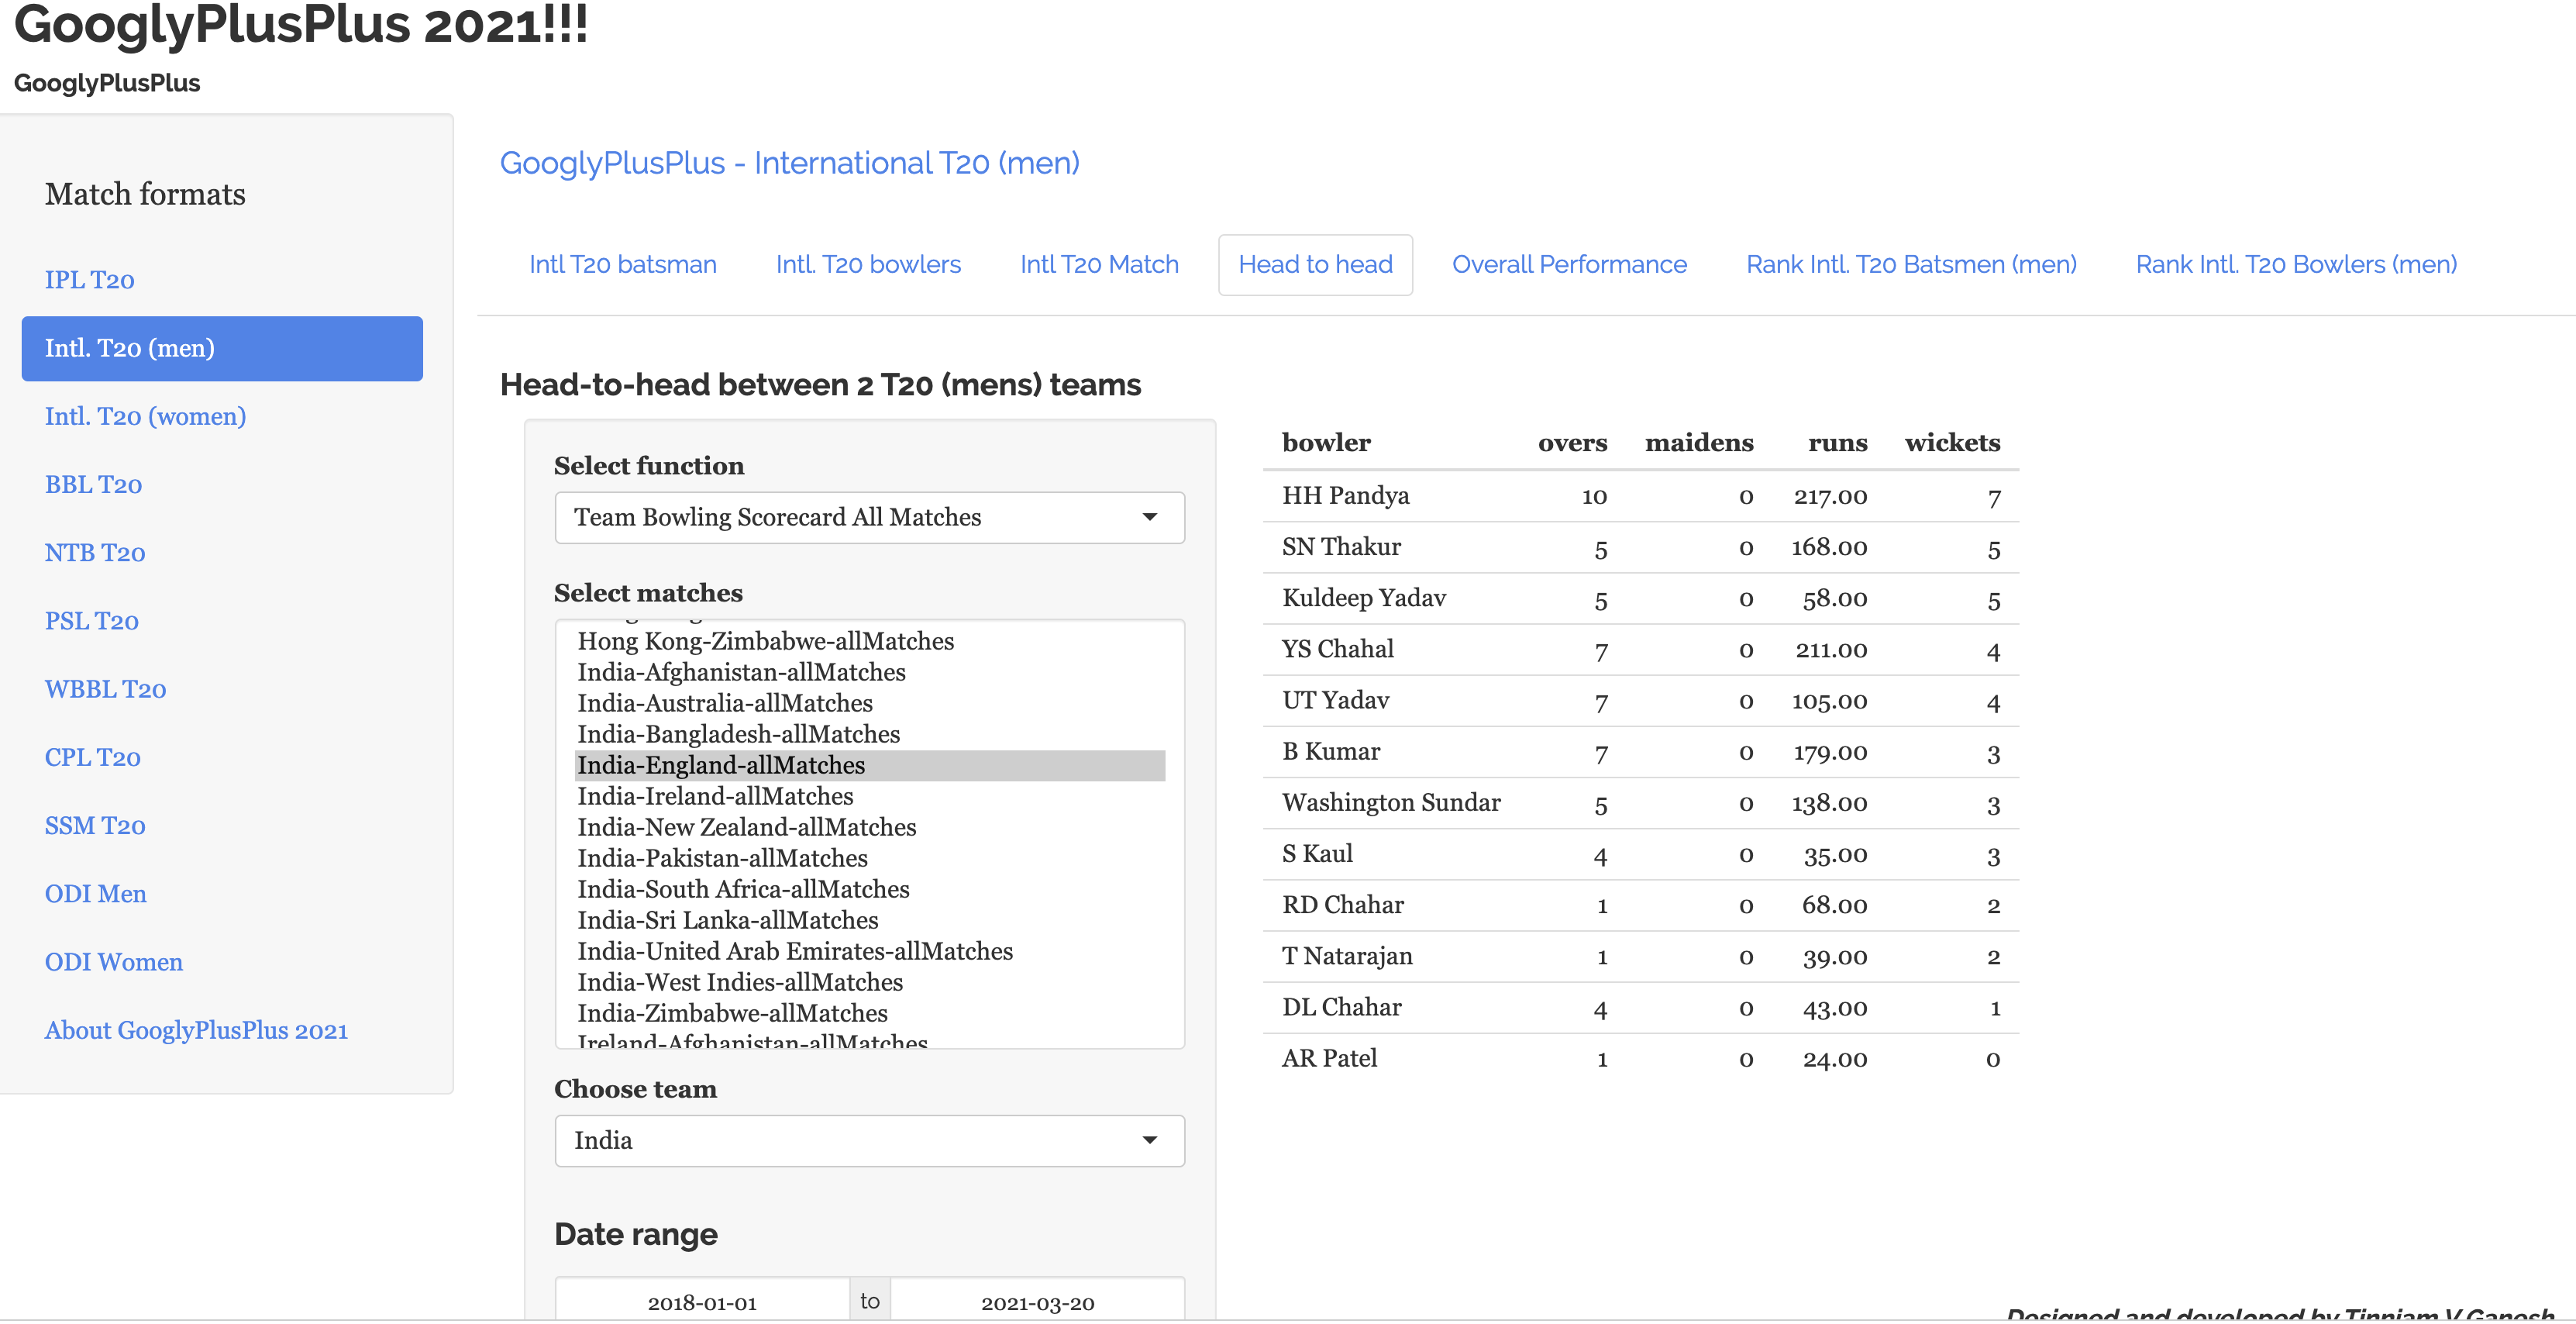
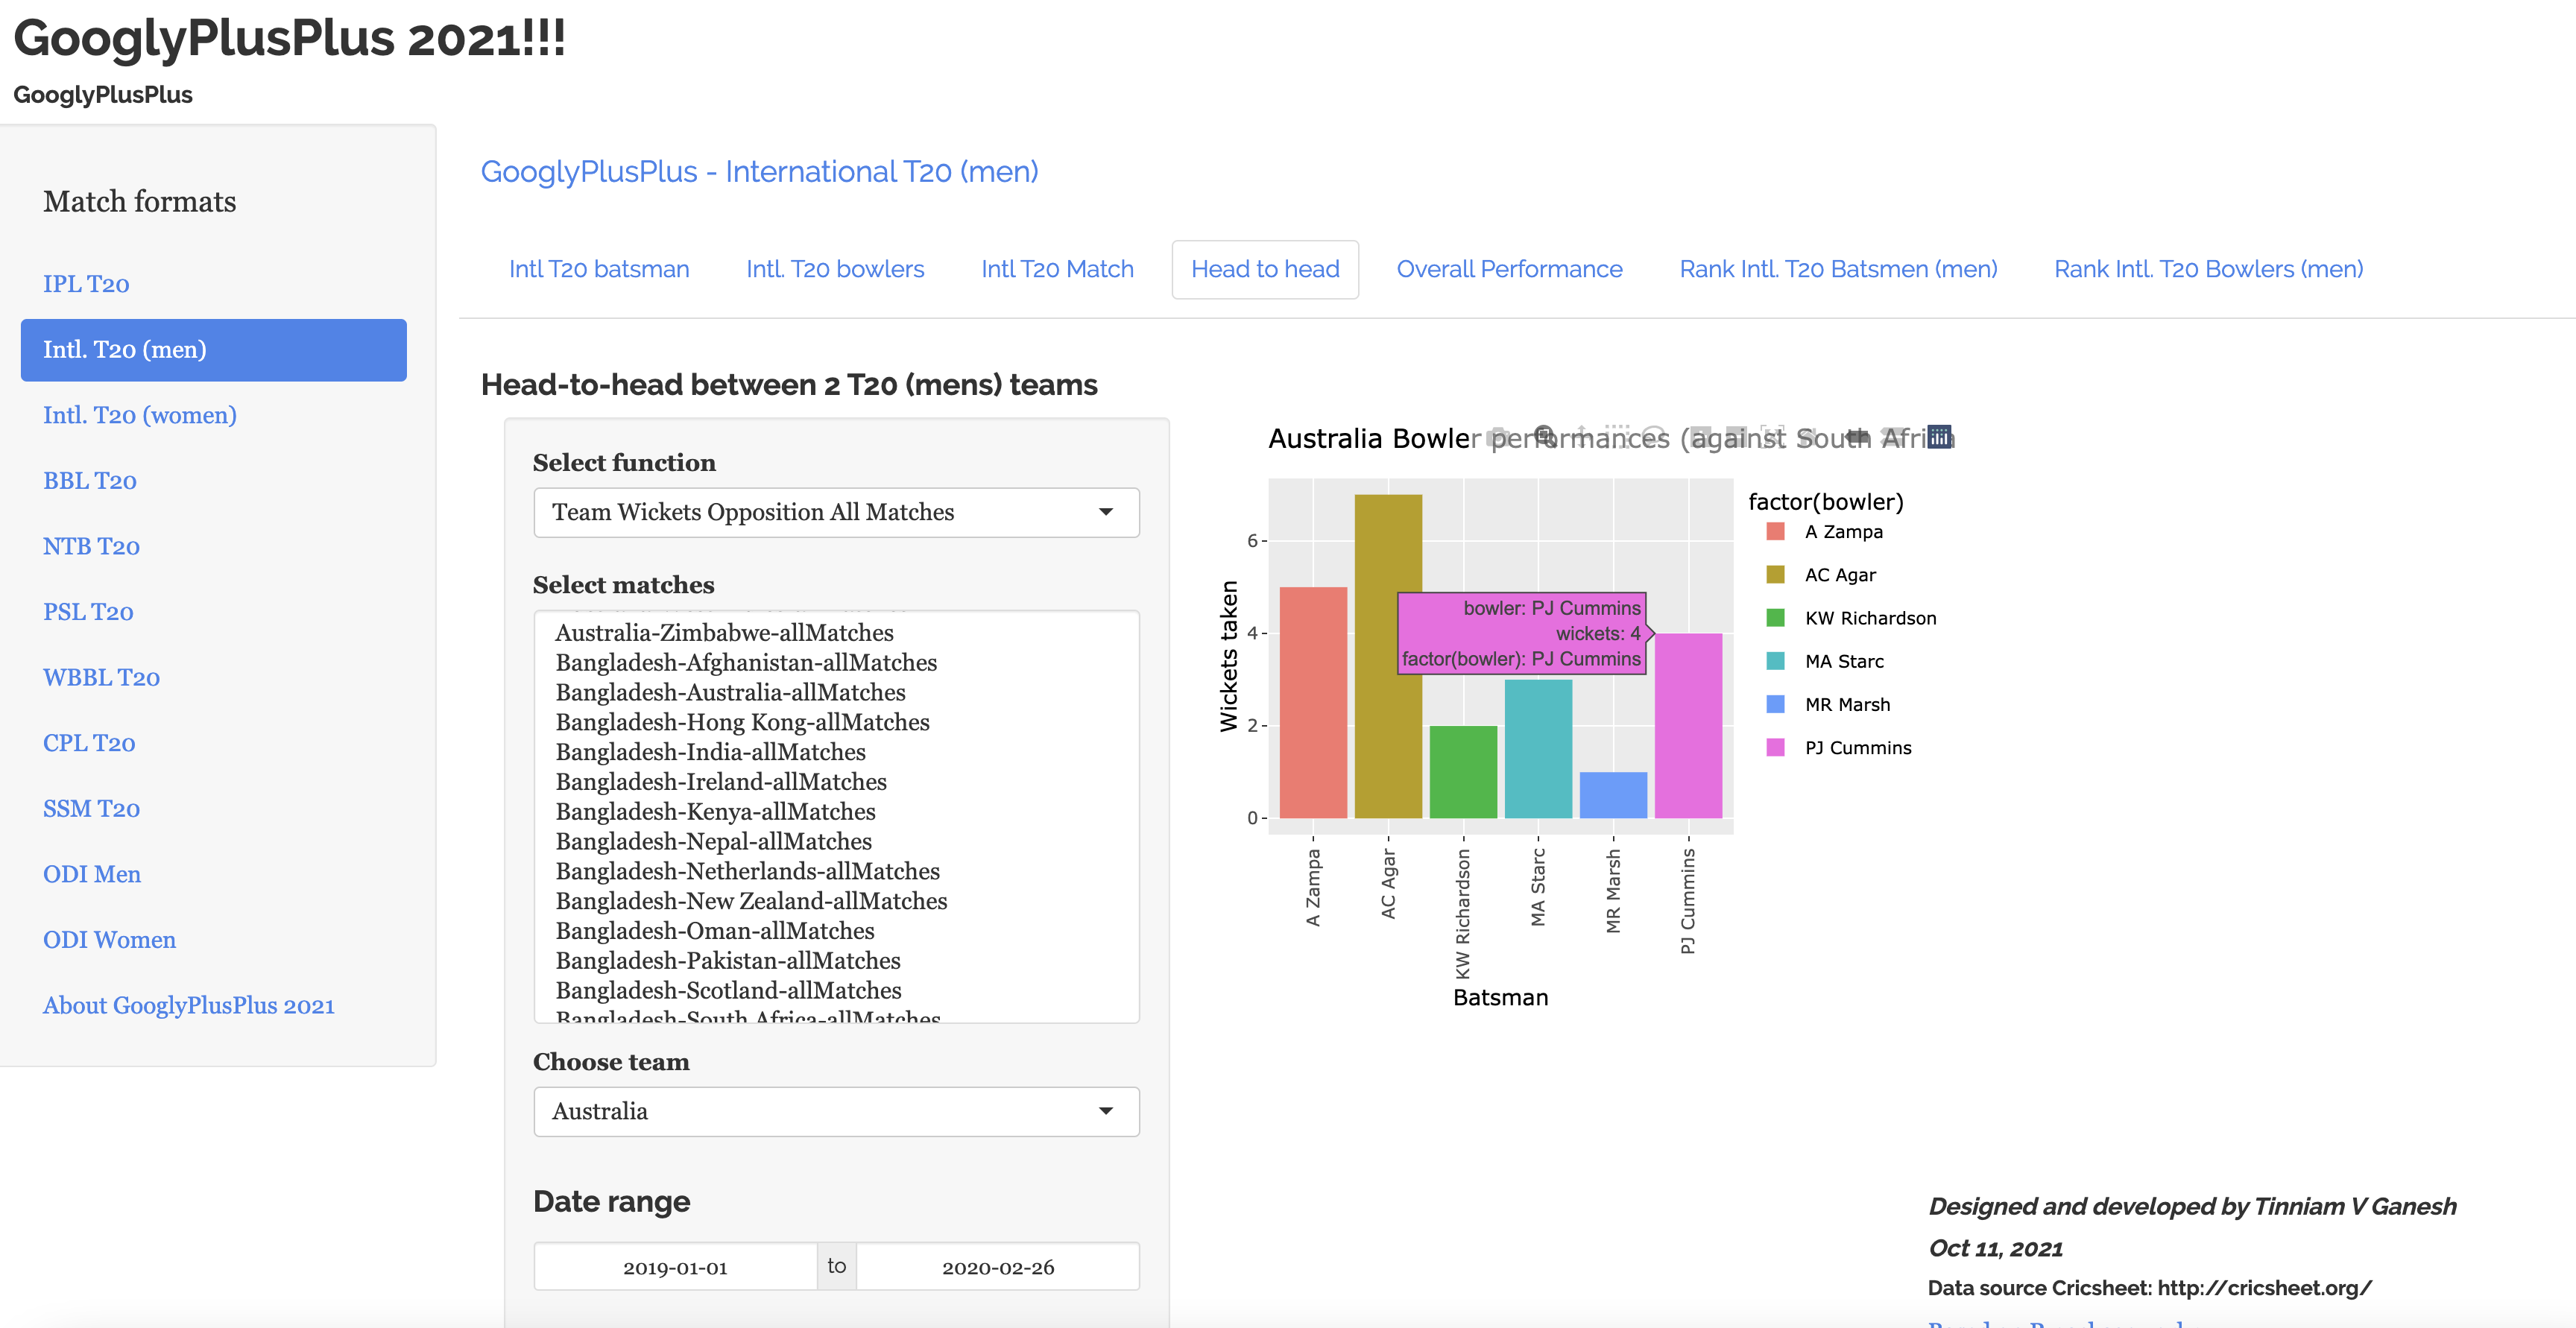
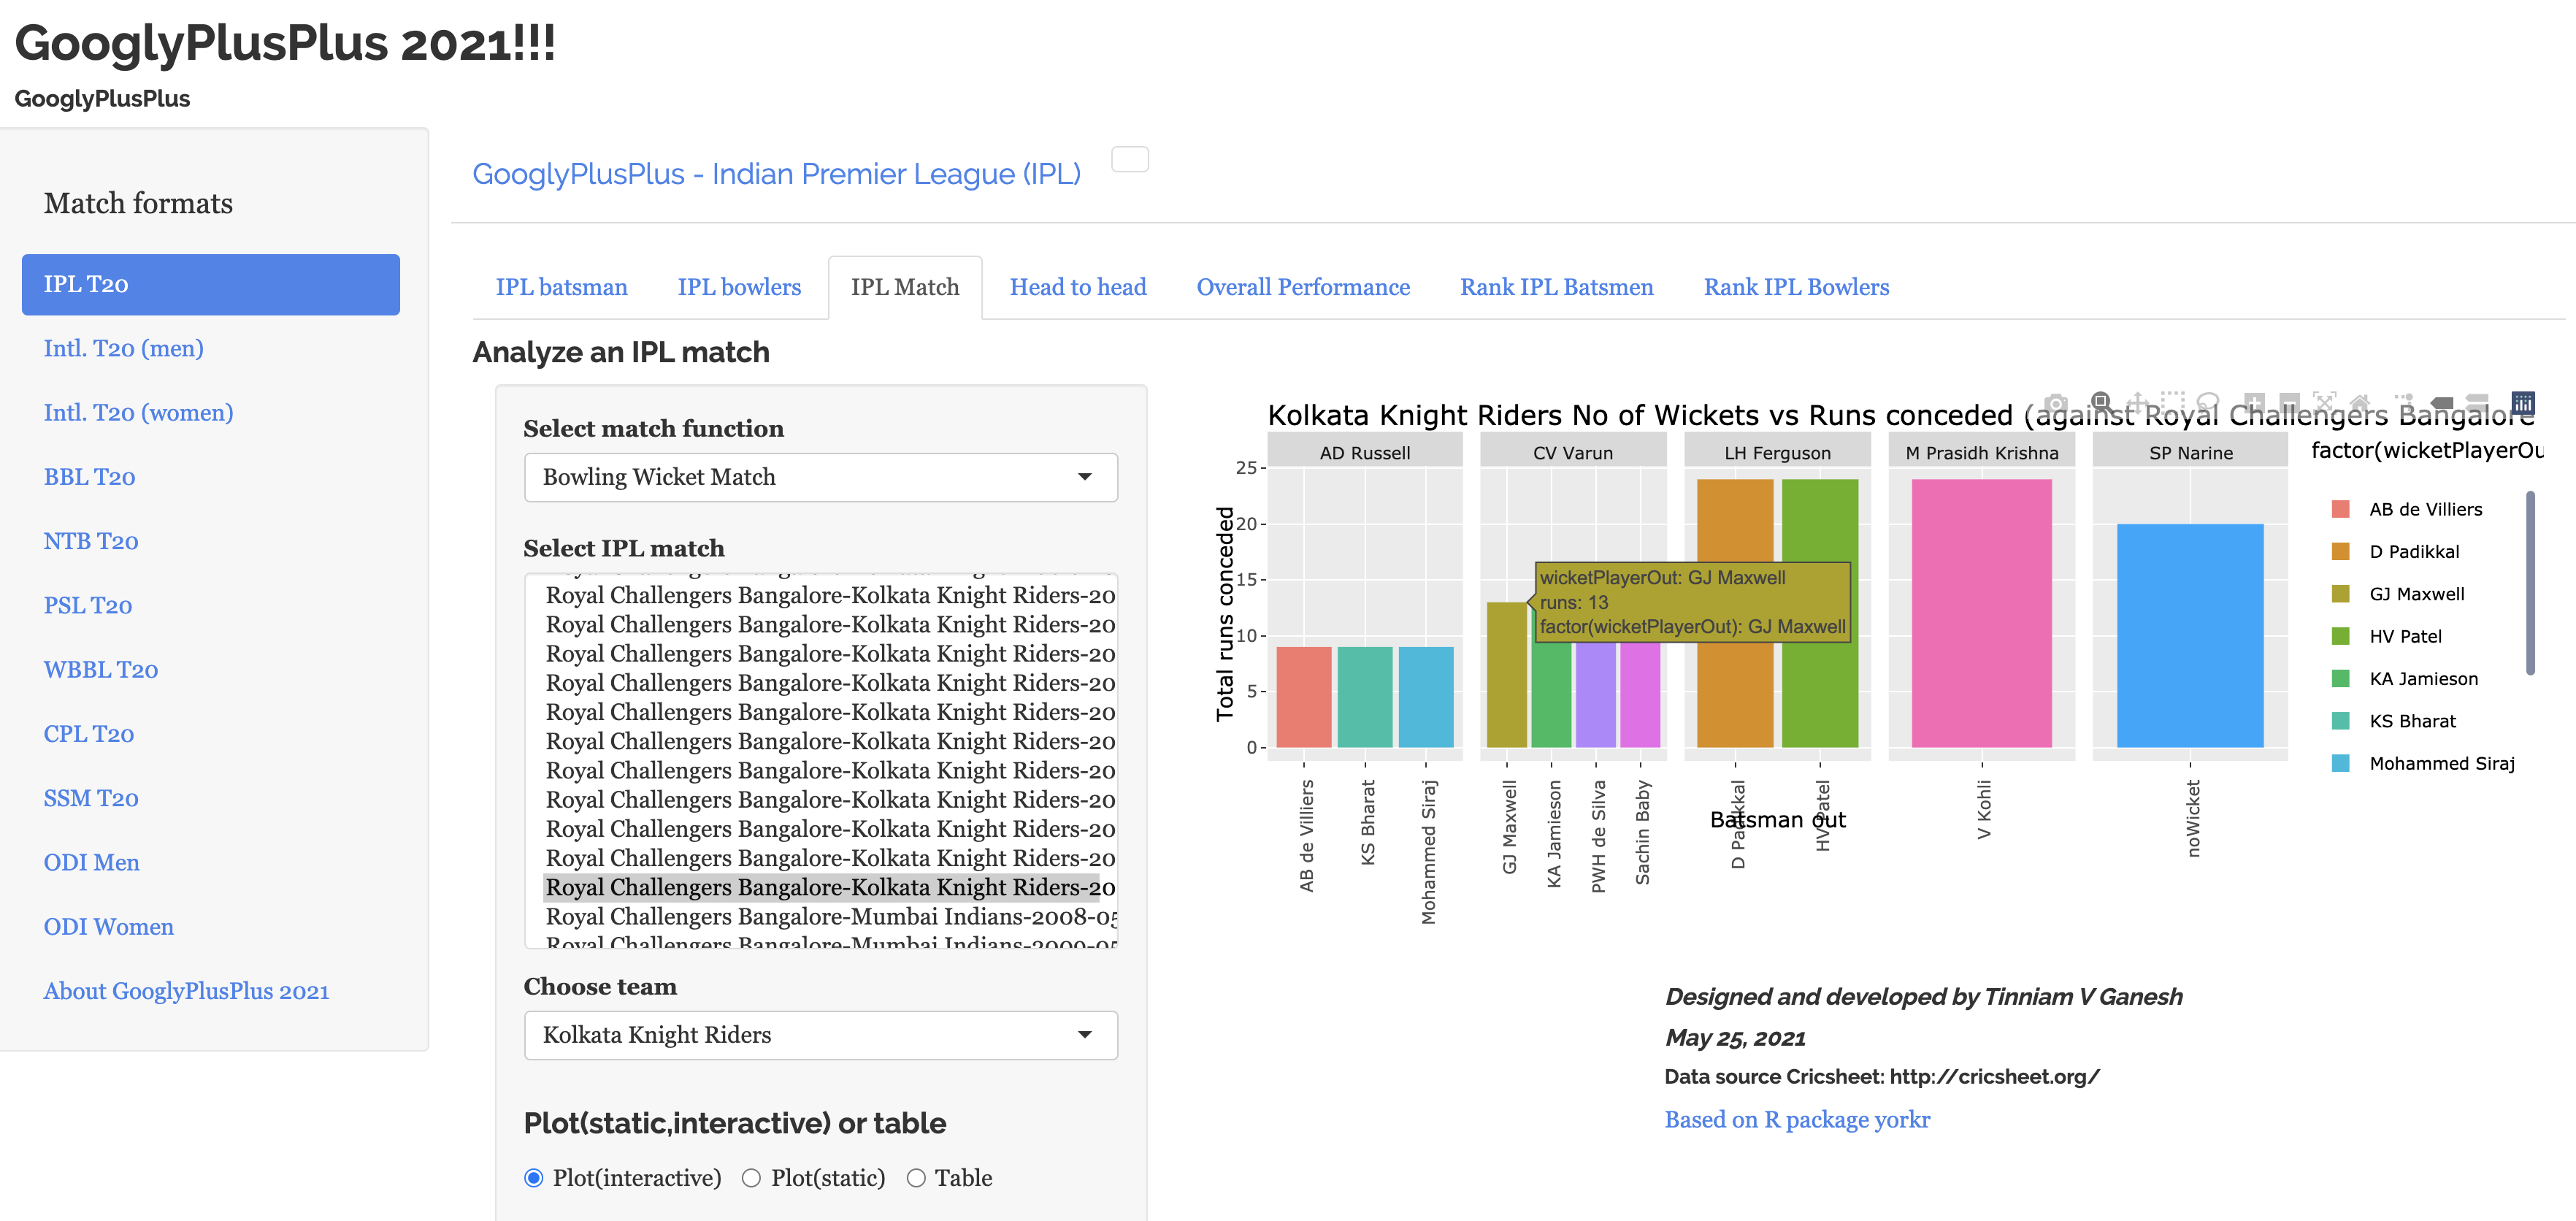
d) KKR vs RCB ( 20 Sep 2021)– Bowling wicket match
This chart gives the wickets taken by the bowler and the total runs conceded
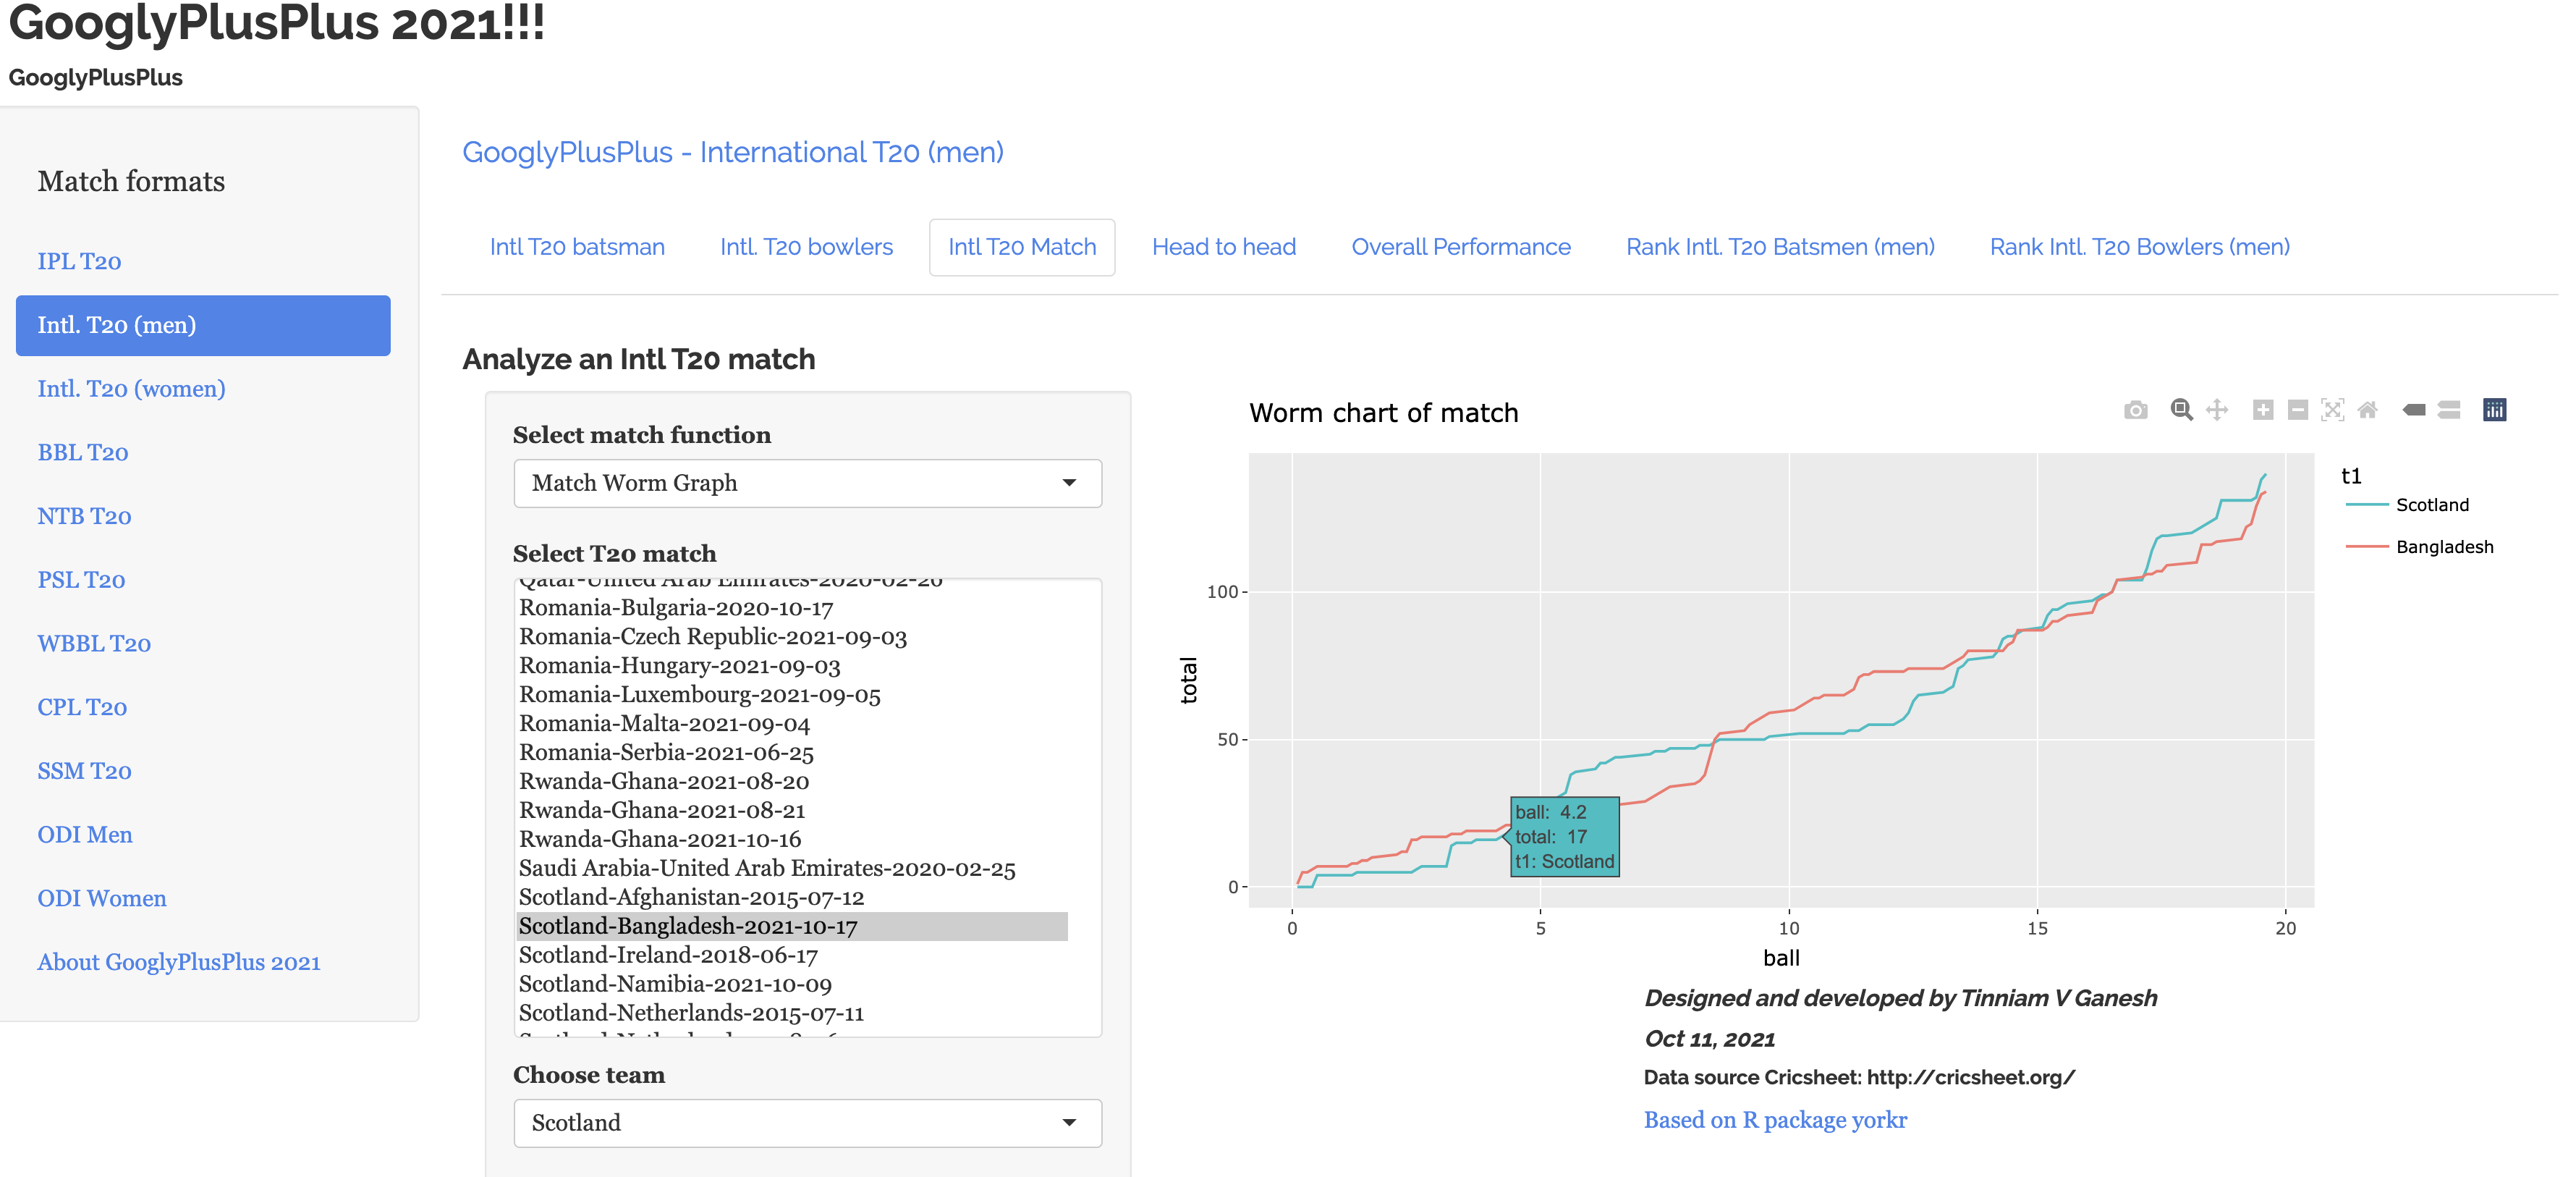
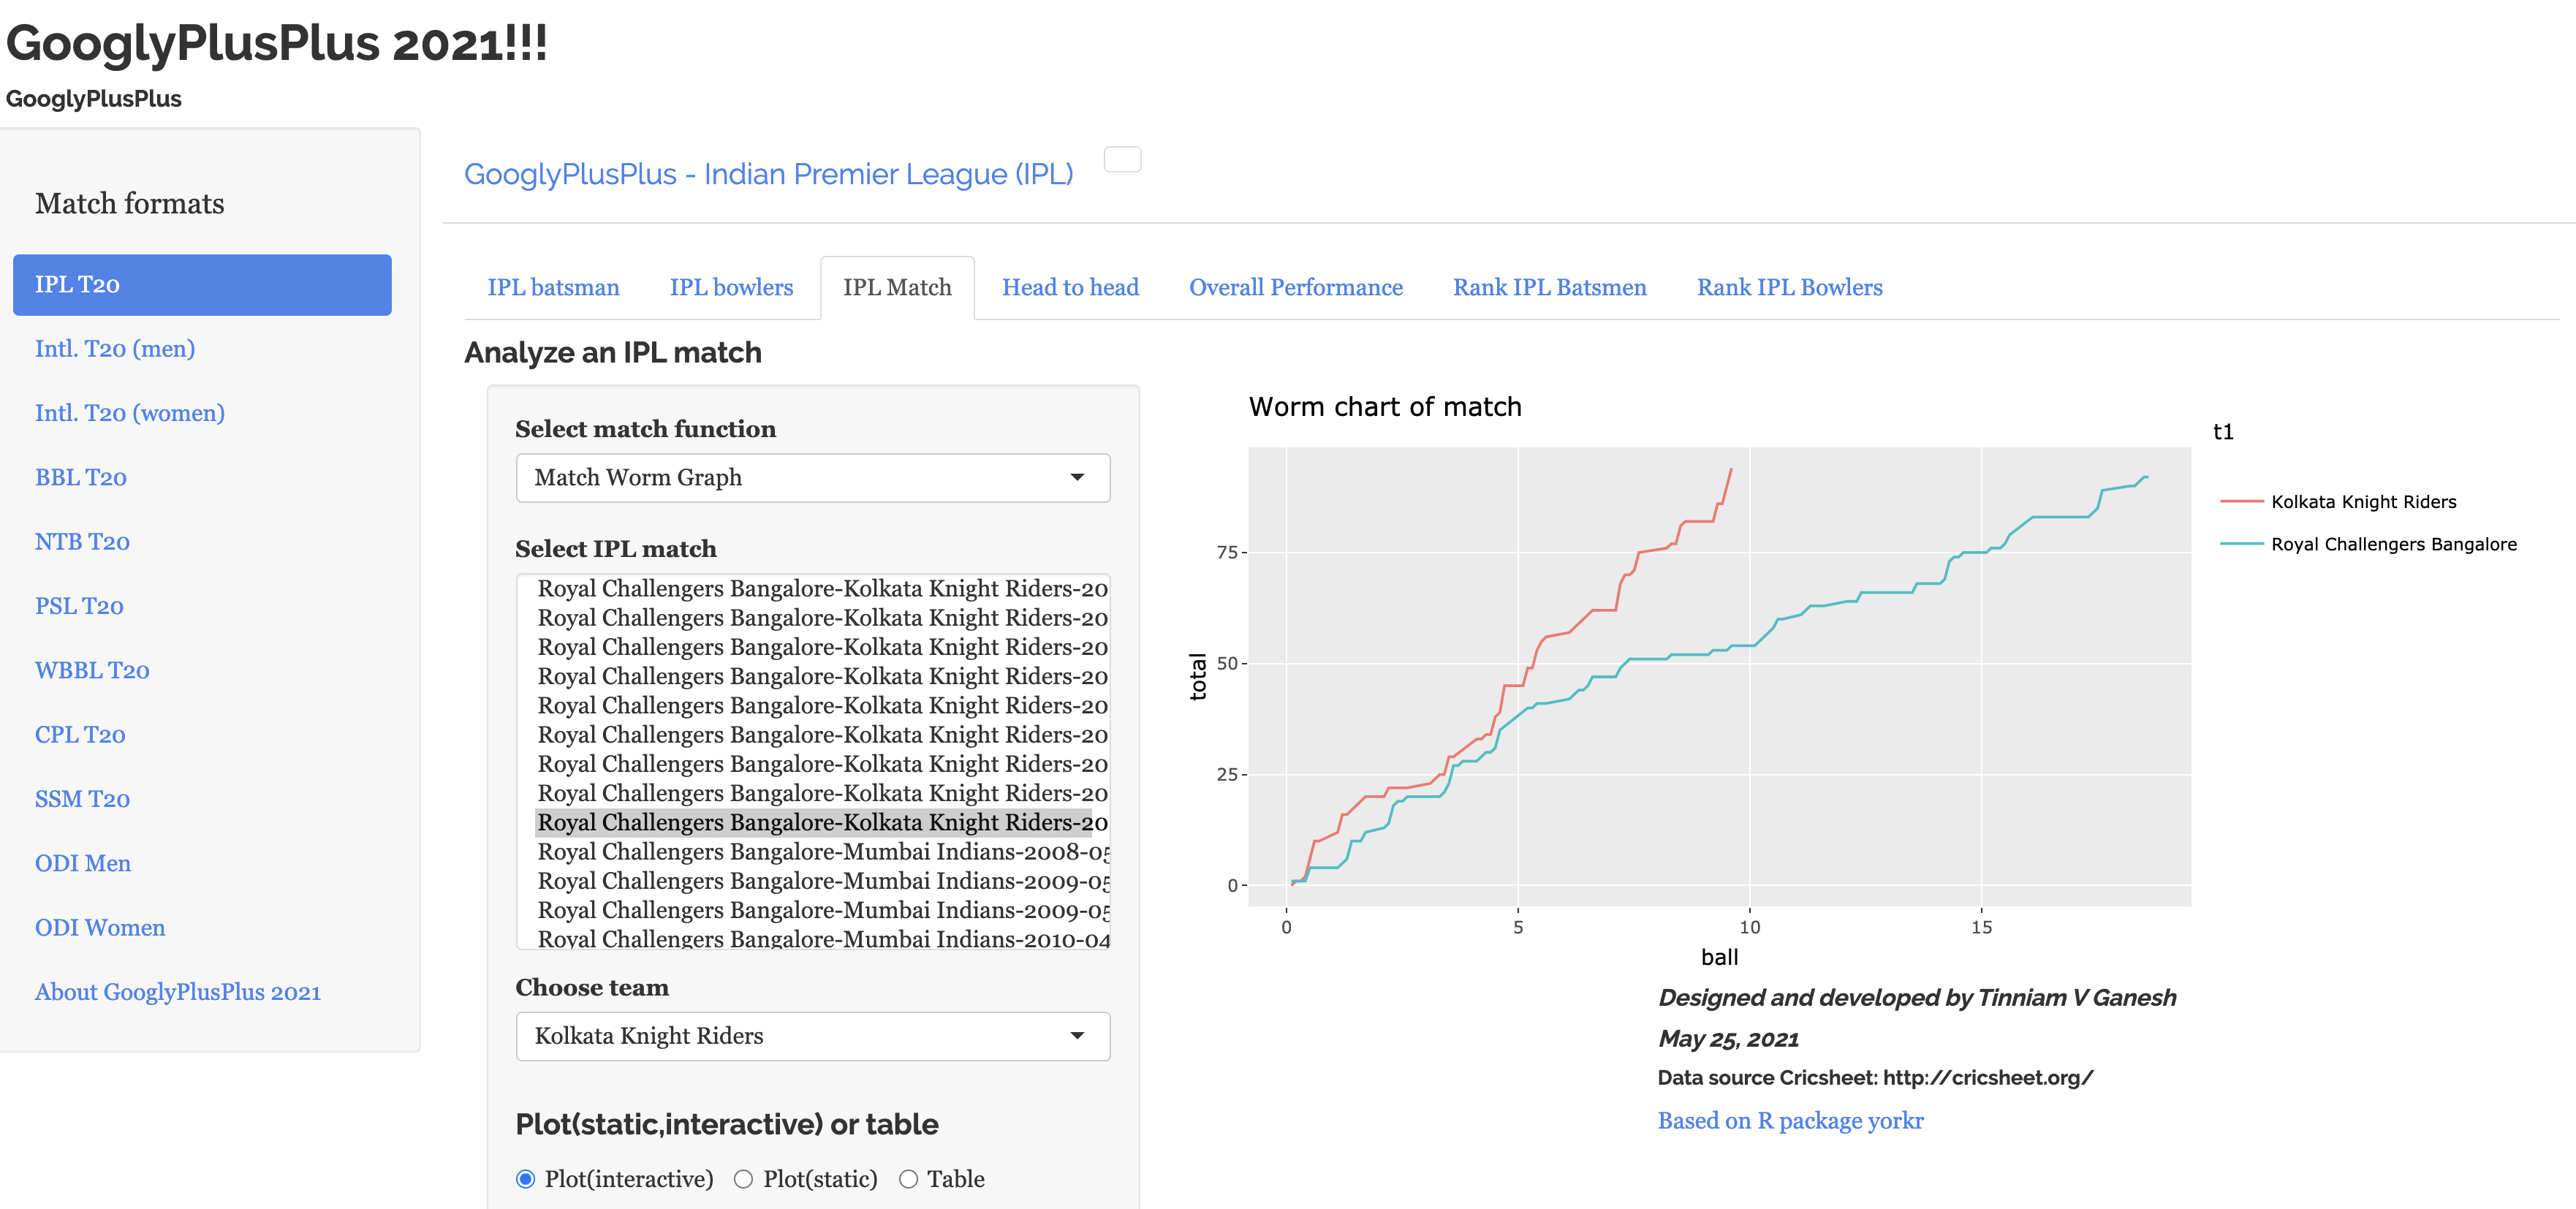
e) KKR vs RCB ( 20 Sep 2021)– Match worm chart
This was a no contest. RCB batting was pathetic and KKR blasted their way to victory as seen in this worm chart
Note: You can also do historical analysis of teams with GooglyPlusPlus2021
For the match to occur today PBKS vs RR (21 Sep 2021) we can perform head-to-head historical analysis. Here Kings XI Punjab has been chosen instead of Punjab Kings as that was its name.
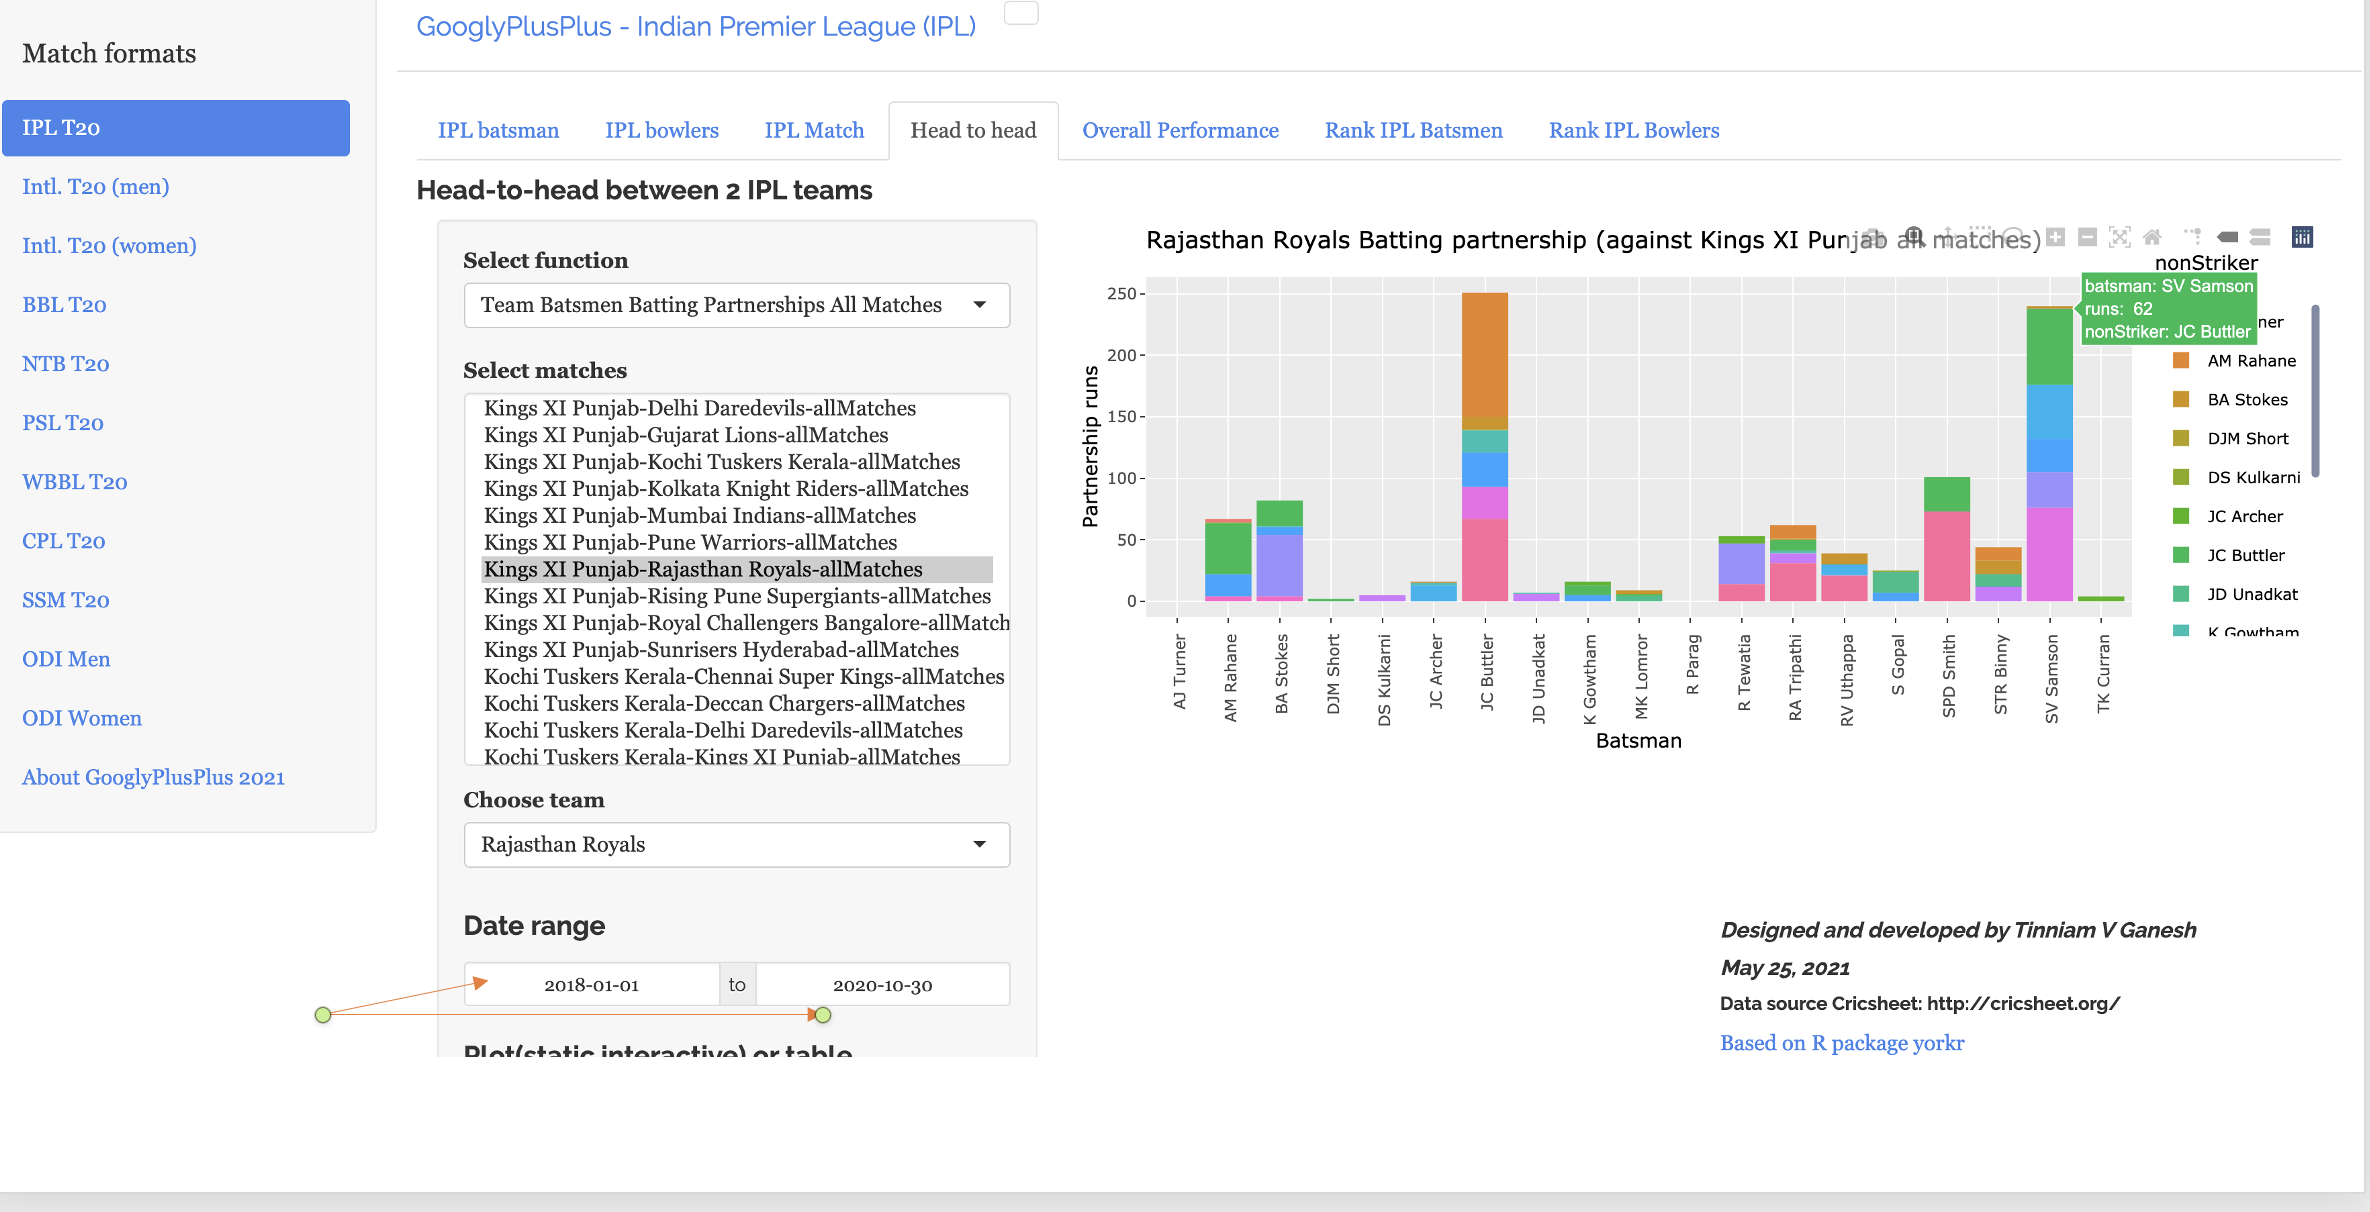
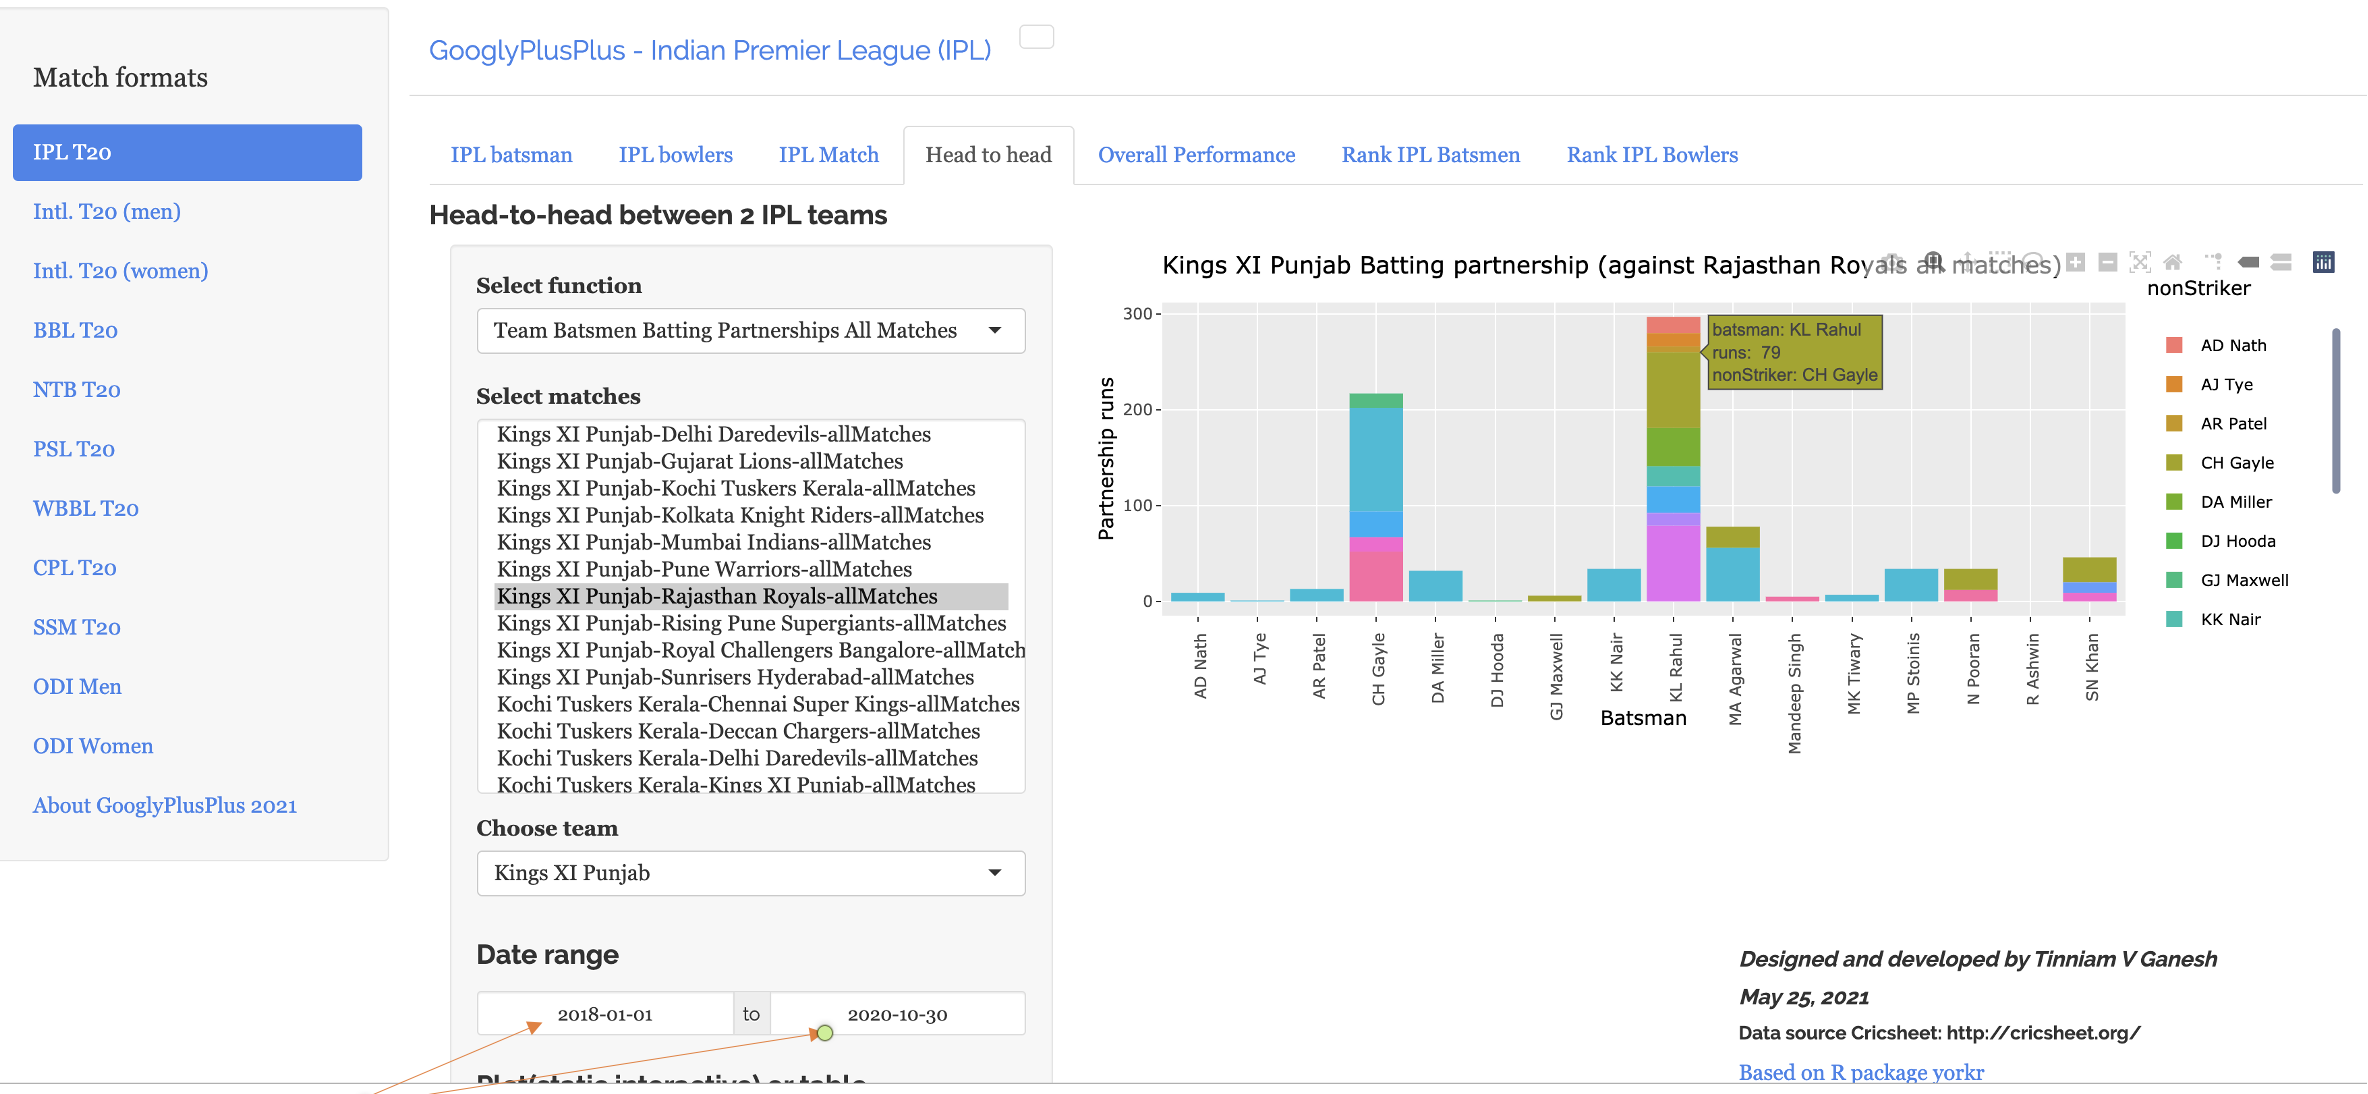
f) Head-to-head (PBKS vs RR) today’s match 21 Sep 2021
For the Rajasthan Royals Sanjy Samson and Jos Buttler have the best performance from 2018 -2021 as seen below
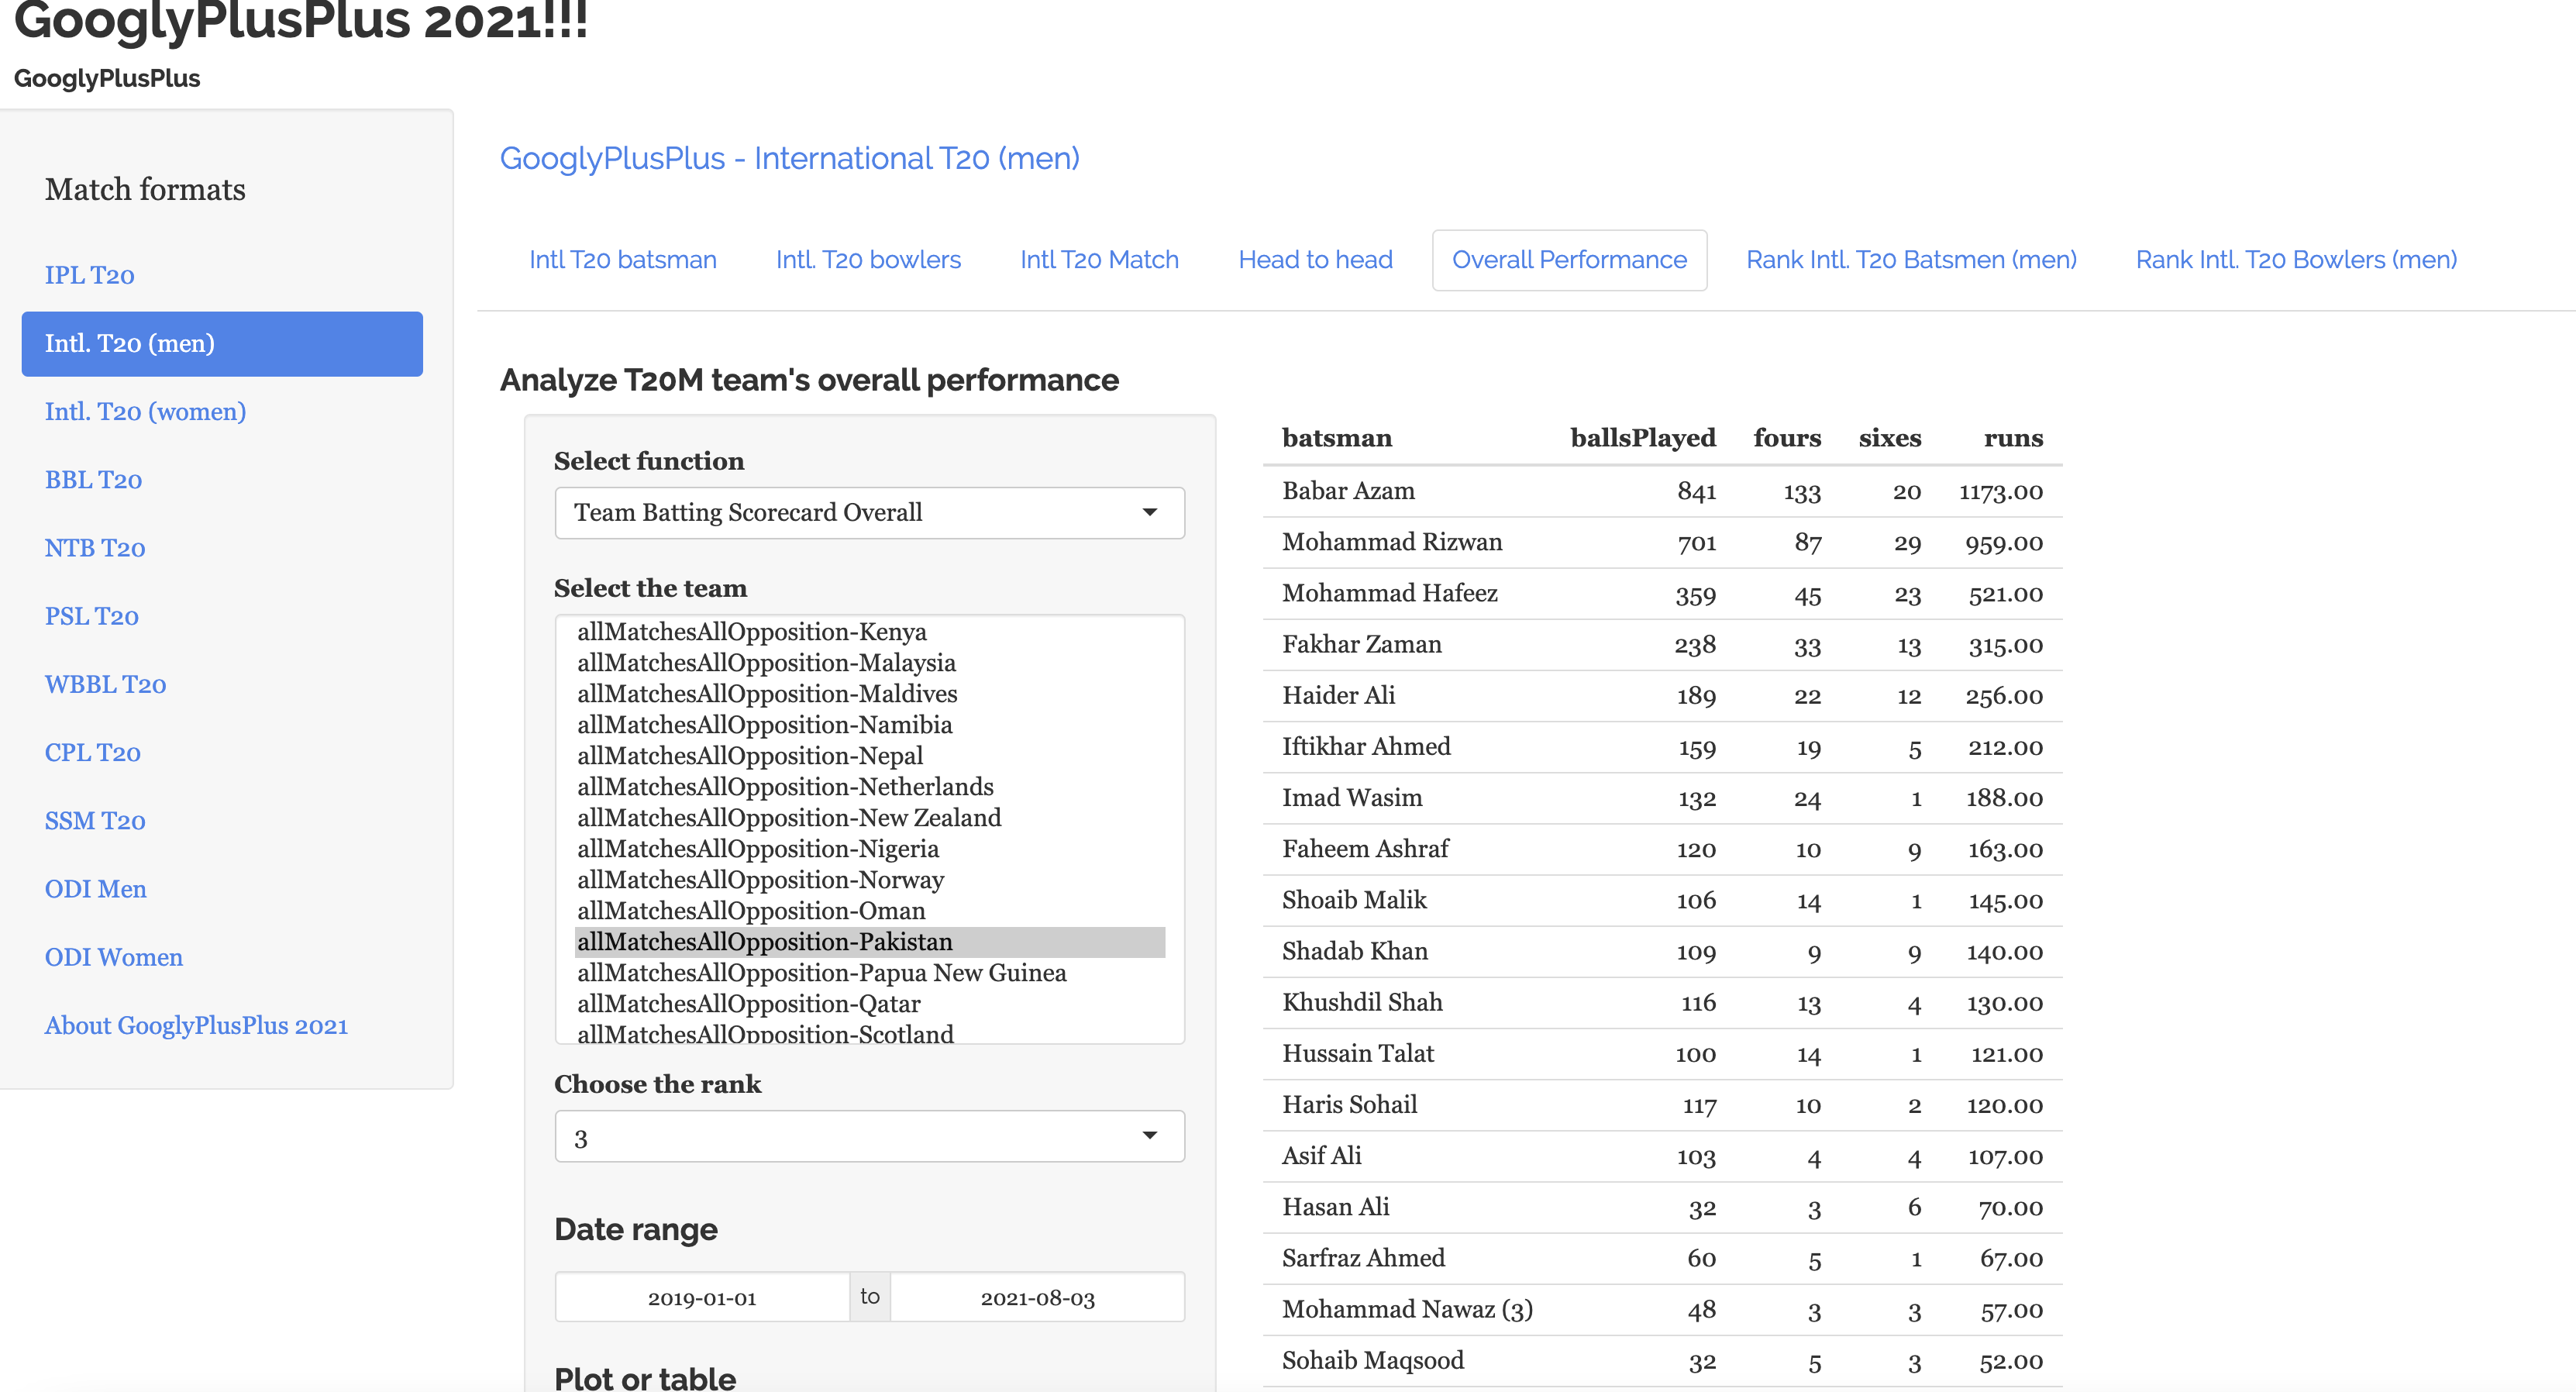
For Punjab Kings KL Rahul and Chris Gayle are the leading scorers for the period 2018-2021
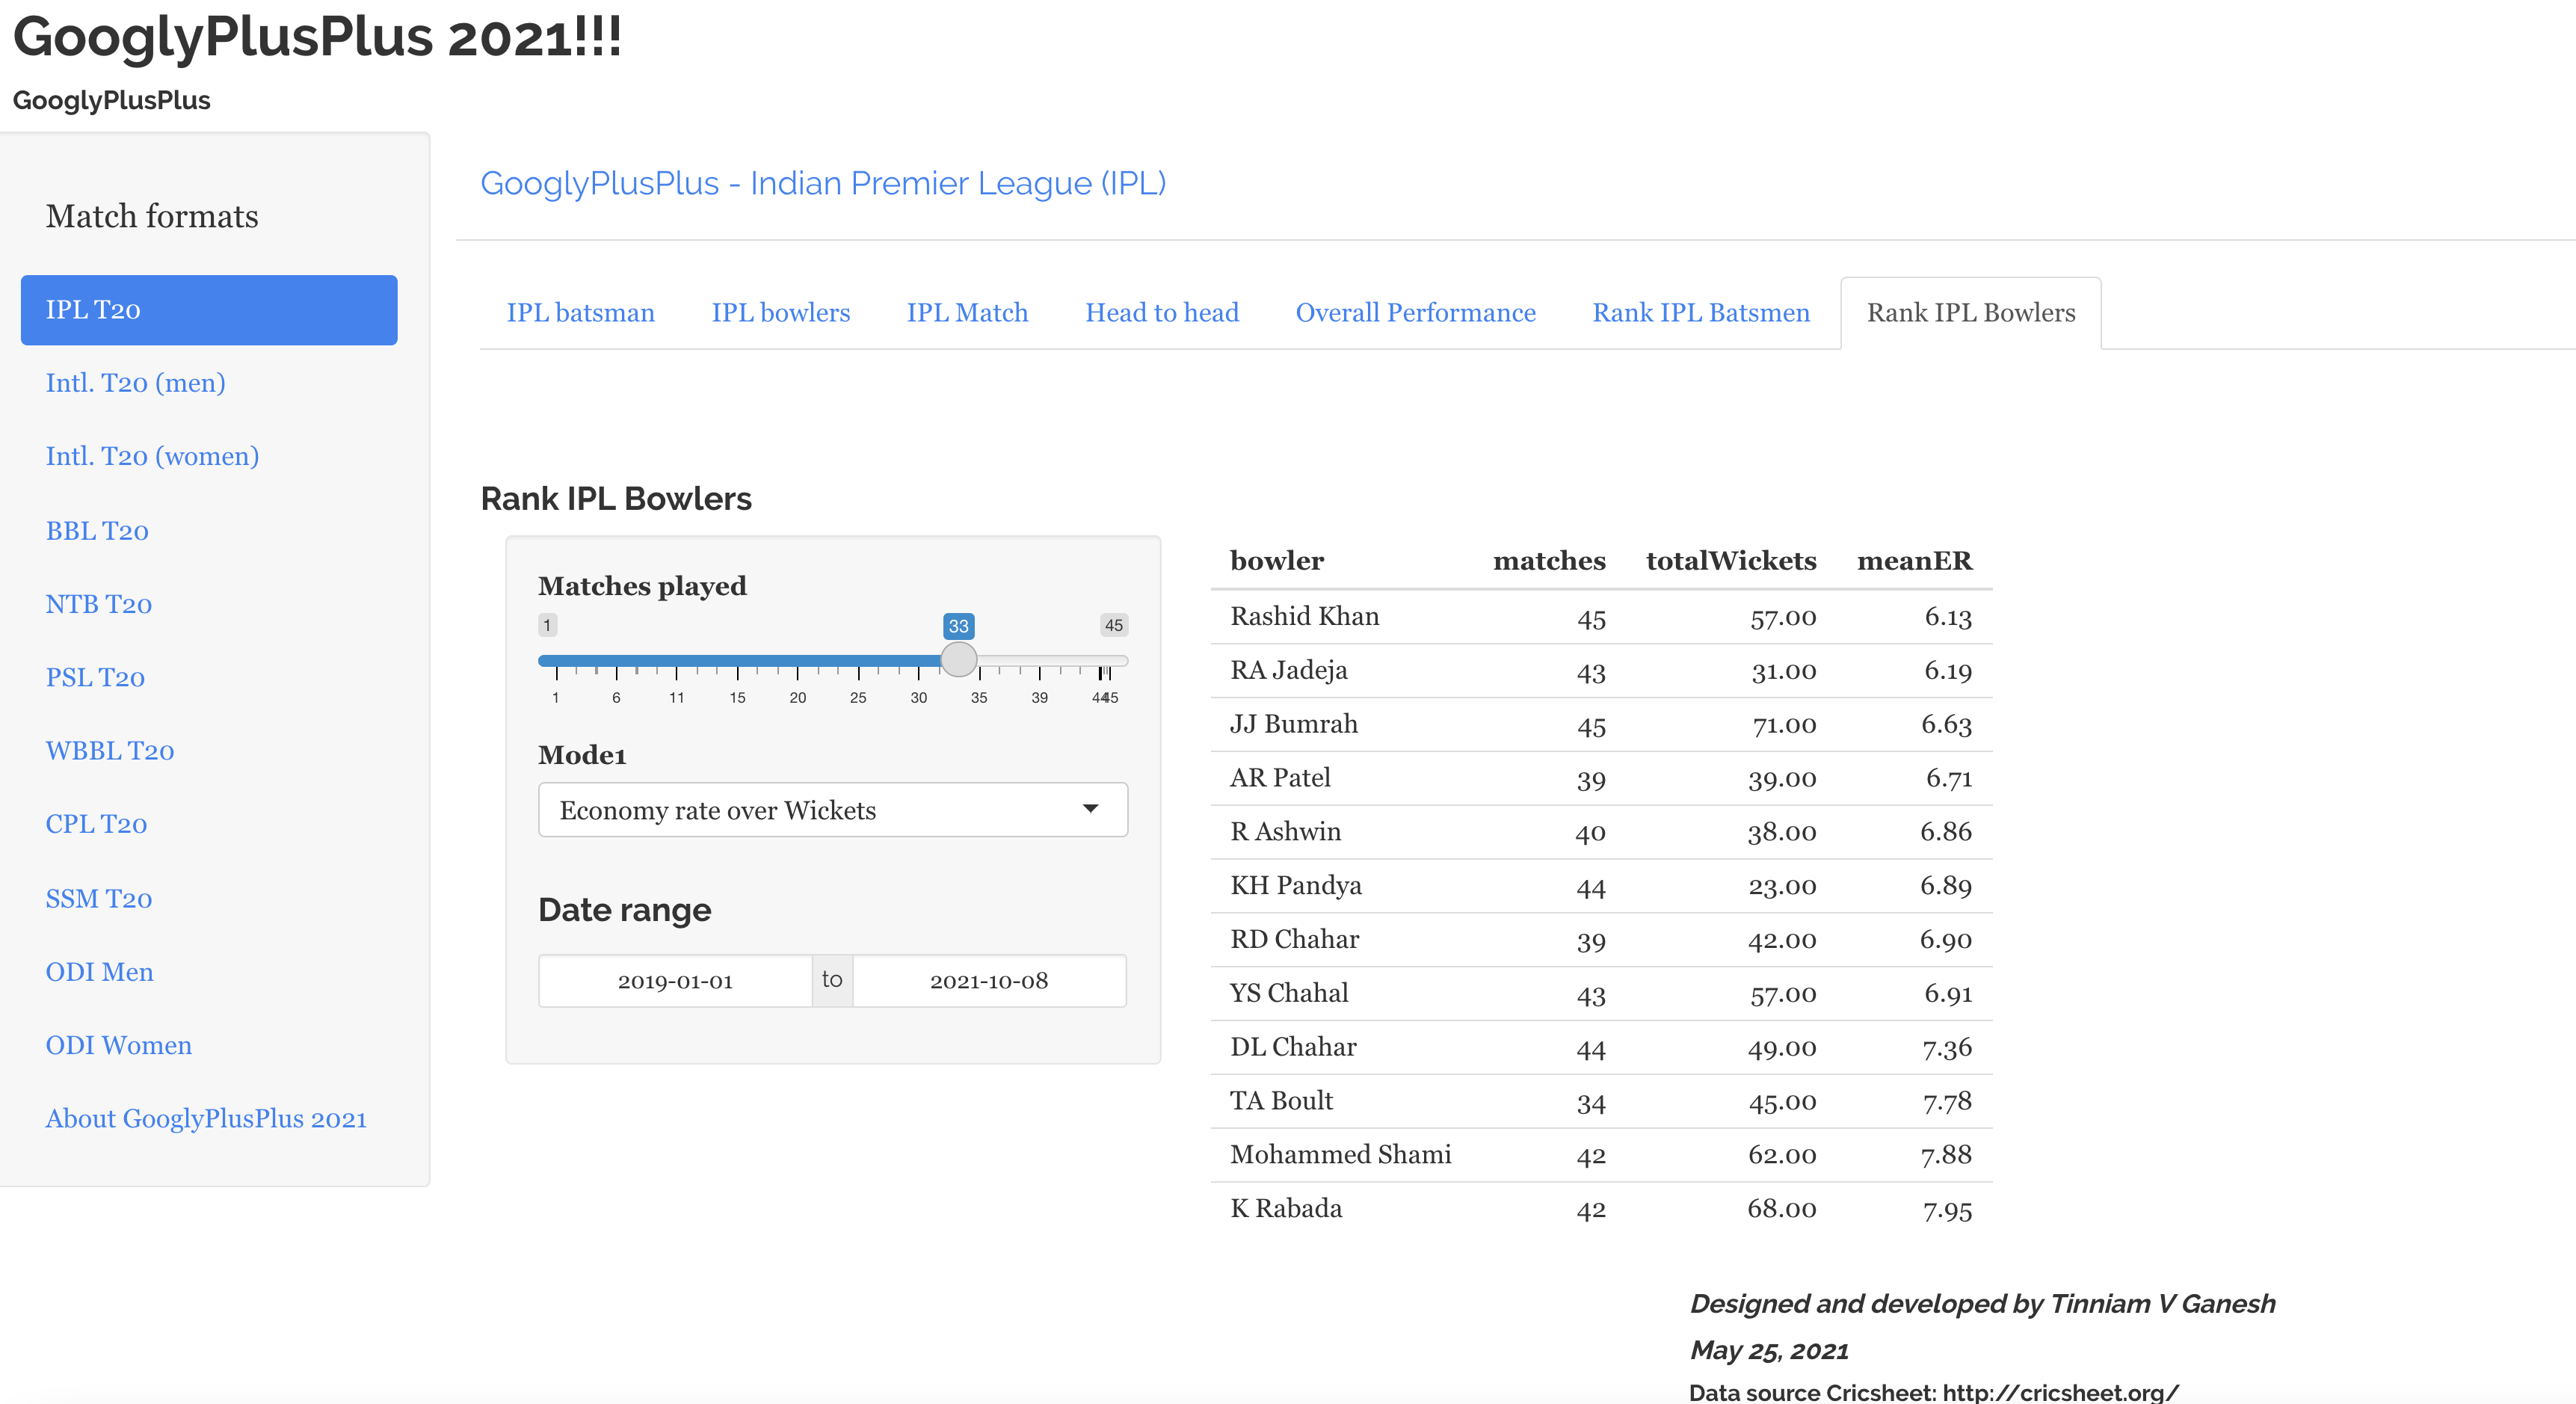
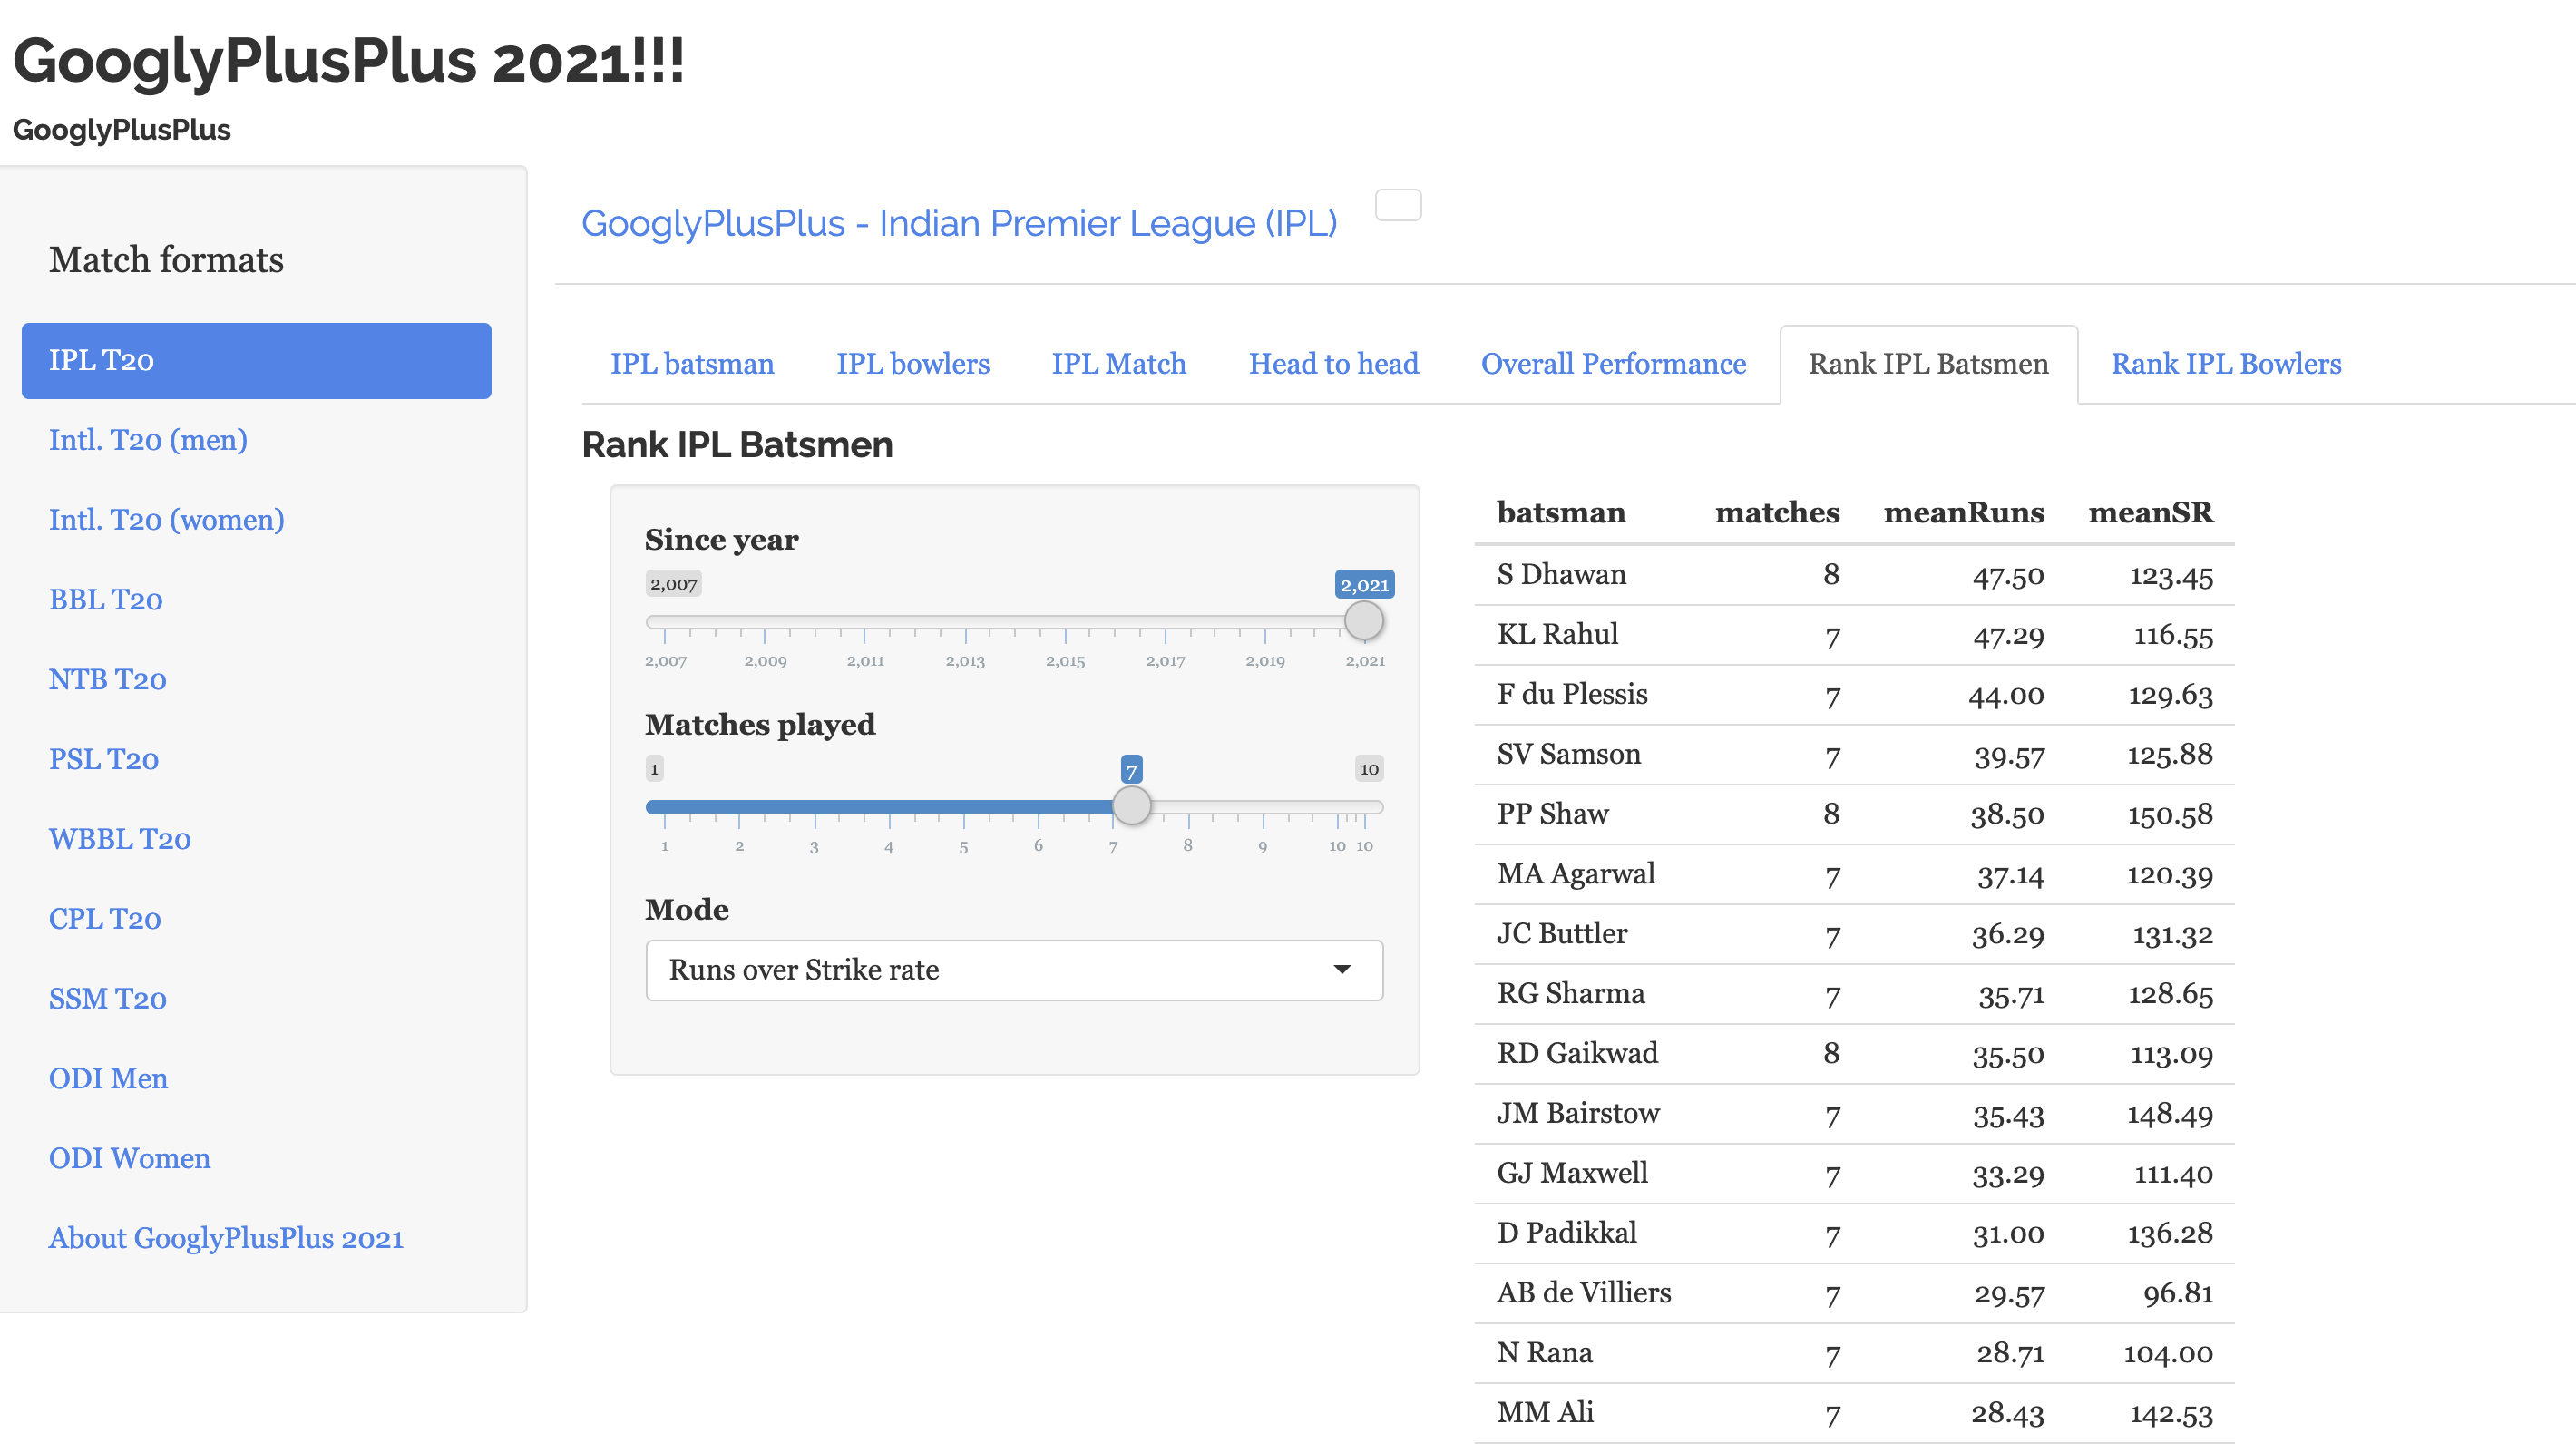
g) Current ranking of batsmen IPL 2021
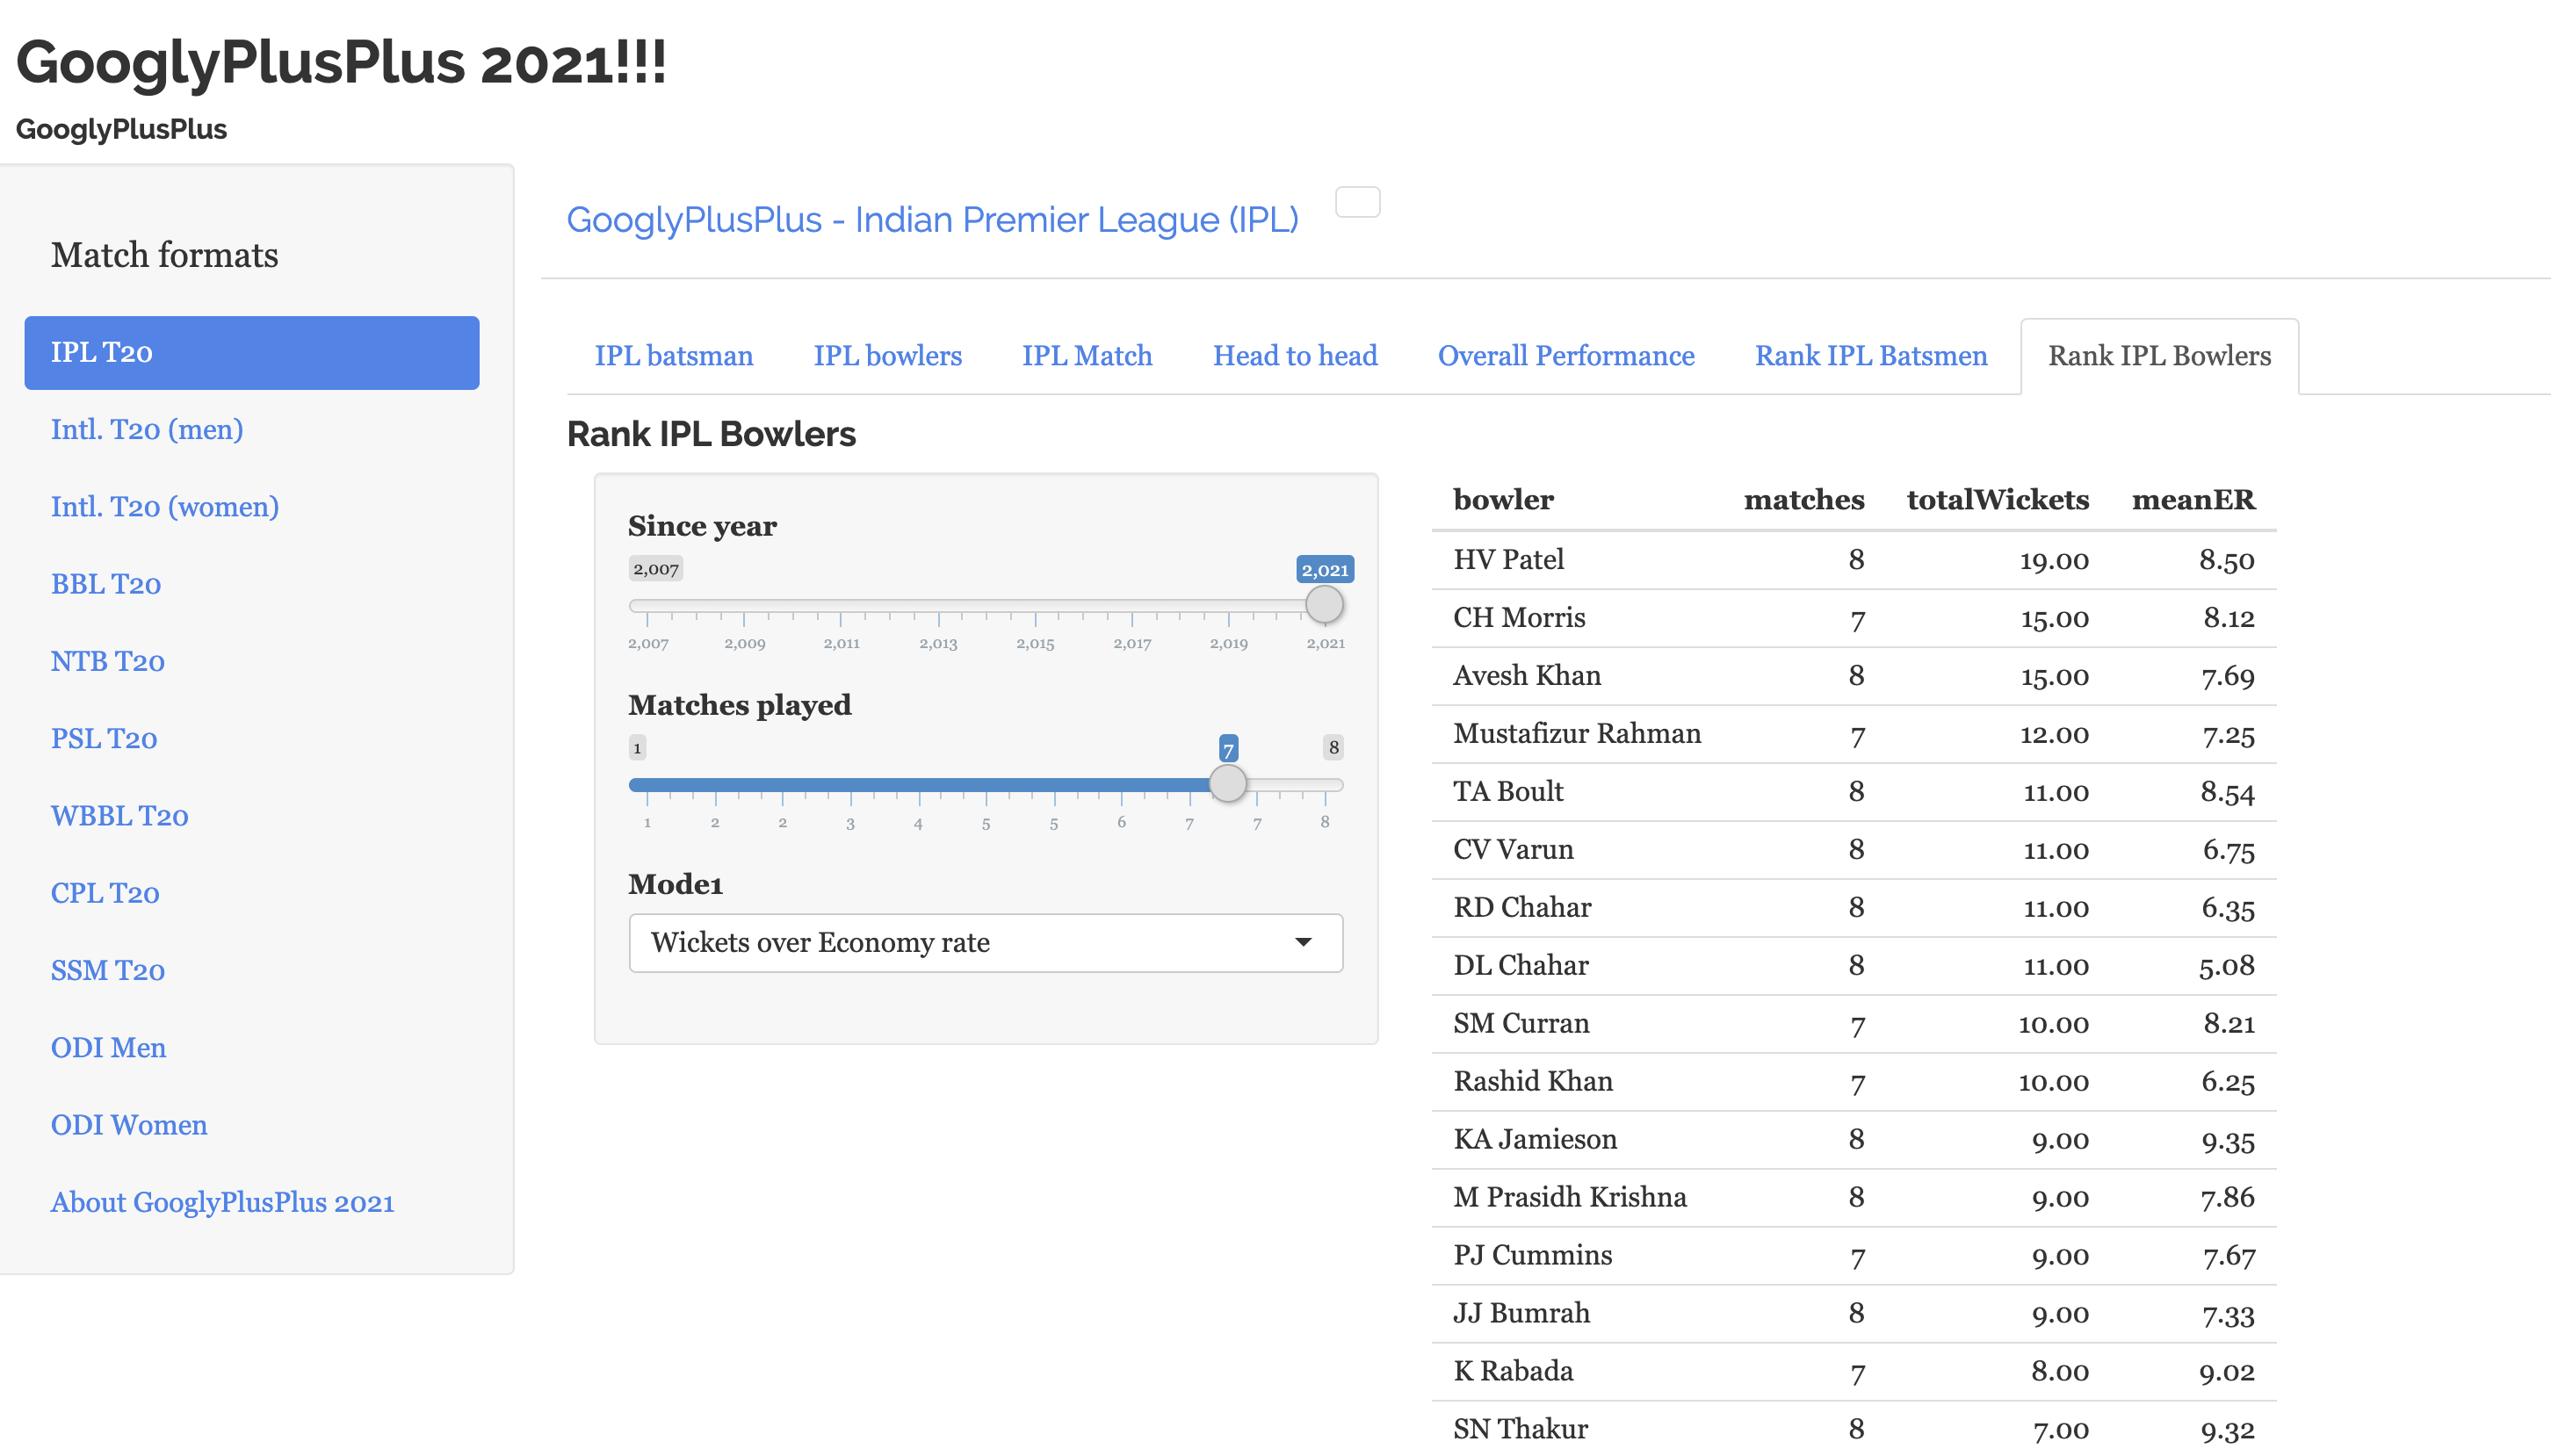
h) Current ranking of bowlers IPL 2021
Also you analyse individual batsman and bowlers
i) Batsman analysis
To see Rituraj Gaikwad performance checkout the batsman tab
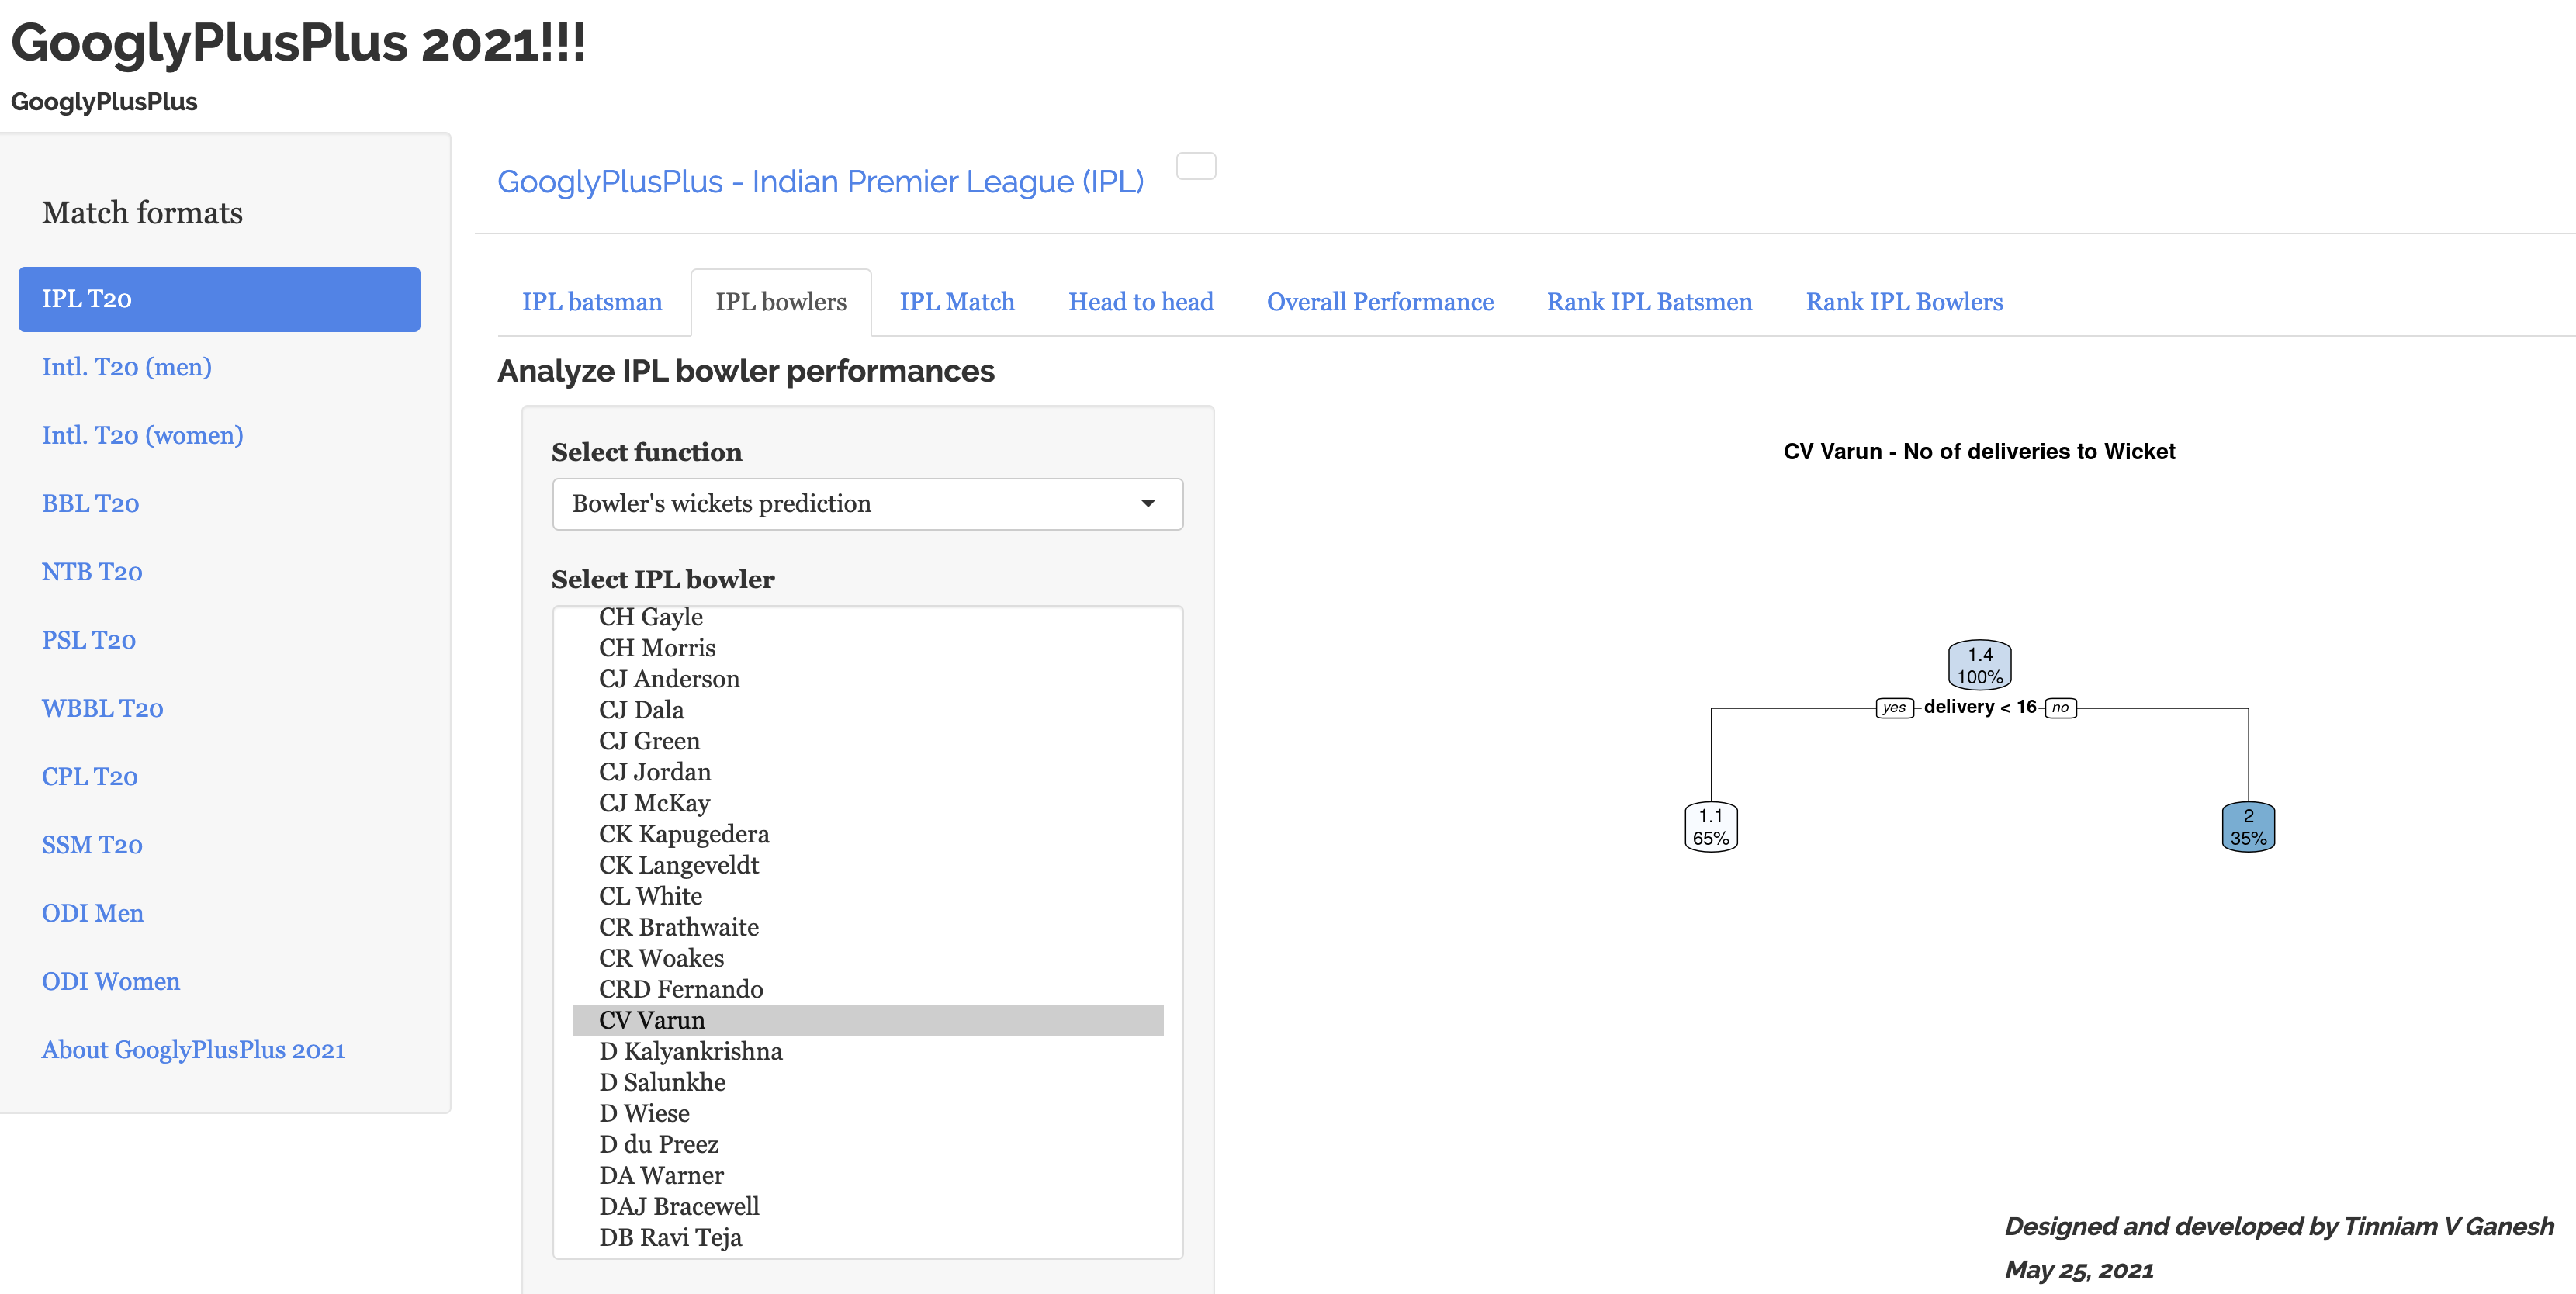
j) Bowler analysis
Performance of Varun Chakaravarty
Remember to check out GooglyPlusPlus2021 for your daily analysis of matches, teams, batsmen and bowlers. Your ride will be waiting for you!!!
You can clone/fork GooglyPlusPlus2021 from github at gpp2021-6
GooglyPlusPlus2021 has been updated with all completed 31 matches
This latest update of GooglyPlusPlus2021 includes new controls which allow for granular analysis of teams and matches. This version includes a new ‘Date Range’ widget which will allow you to choose a specific interval between which you would like to analyze data. The Date Range widget has been added to 2 tabs namely
a) Head-to-Head
b) Overall Performance
Important note:
This change is applicable to all T20 formats and ODI formats that GooglyPlusPlus2021 handles. This means you can do fine-grained analysis of the following formats
a. IPL b. Intl. T20 (men) c. Intl. T20 (women)
d. BBL e. NTB f. PSL
g. WBB h. CPL i. SSM
j. ODI (men) k. ODI (women)
Important note 1: Also note that all charts in GooglyPlusPlus2021 are interactive. You ca hover over the charts to get details of the data below. You can also selectively filter in bar charts using double-click and click. To know more about how to use GooglyPlusPlus2021 interactively, please see my post GooglyPlusPlus2021 is now fully interactive!!
You can clone/download the code for GooglyPlusPlus2021 from Github at GooglyPlusPlus2021
GooglyPlusPlus2021 is now fully interactive. Please read the below post carefully to see the different ways you can interact with the data in the plots.
There are 2 main updates in this latest version of GooglyPlusPlus2021
a) GooglyPlusPlus gets all ‘touchy, feely‘ with the data and now you can interact with the plot/chart to get more details of the underlying data. There are many ways you can slice’n dice the data in the charts. The examples below illustrate a few of this. You can interact with plots by hover’ing, ‘click’ing and ‘double-click’ing curves, plots, barplots to get details of the data.
b) GooglyPlusPlus also includes the ‘Super Smash T20’ league from New Zealand. You can analyze batsmen, bowlers, matches, teams and rank Super Smash (SSM) also
Note: GooglyPlusPlus2021 can handle a total of 11 formats including T20 and ODI. They are
Within these 11 x 7 = 77 tabs you can analyze batsmen, bowlers, matches, head-to-head, team vs all other teams and rank players for T20 and ODI. In addition all plots have been made interactive so there is a lot more information that you can get from these charts
Below I have randomly included some charts for different formats to show how you can interact with them
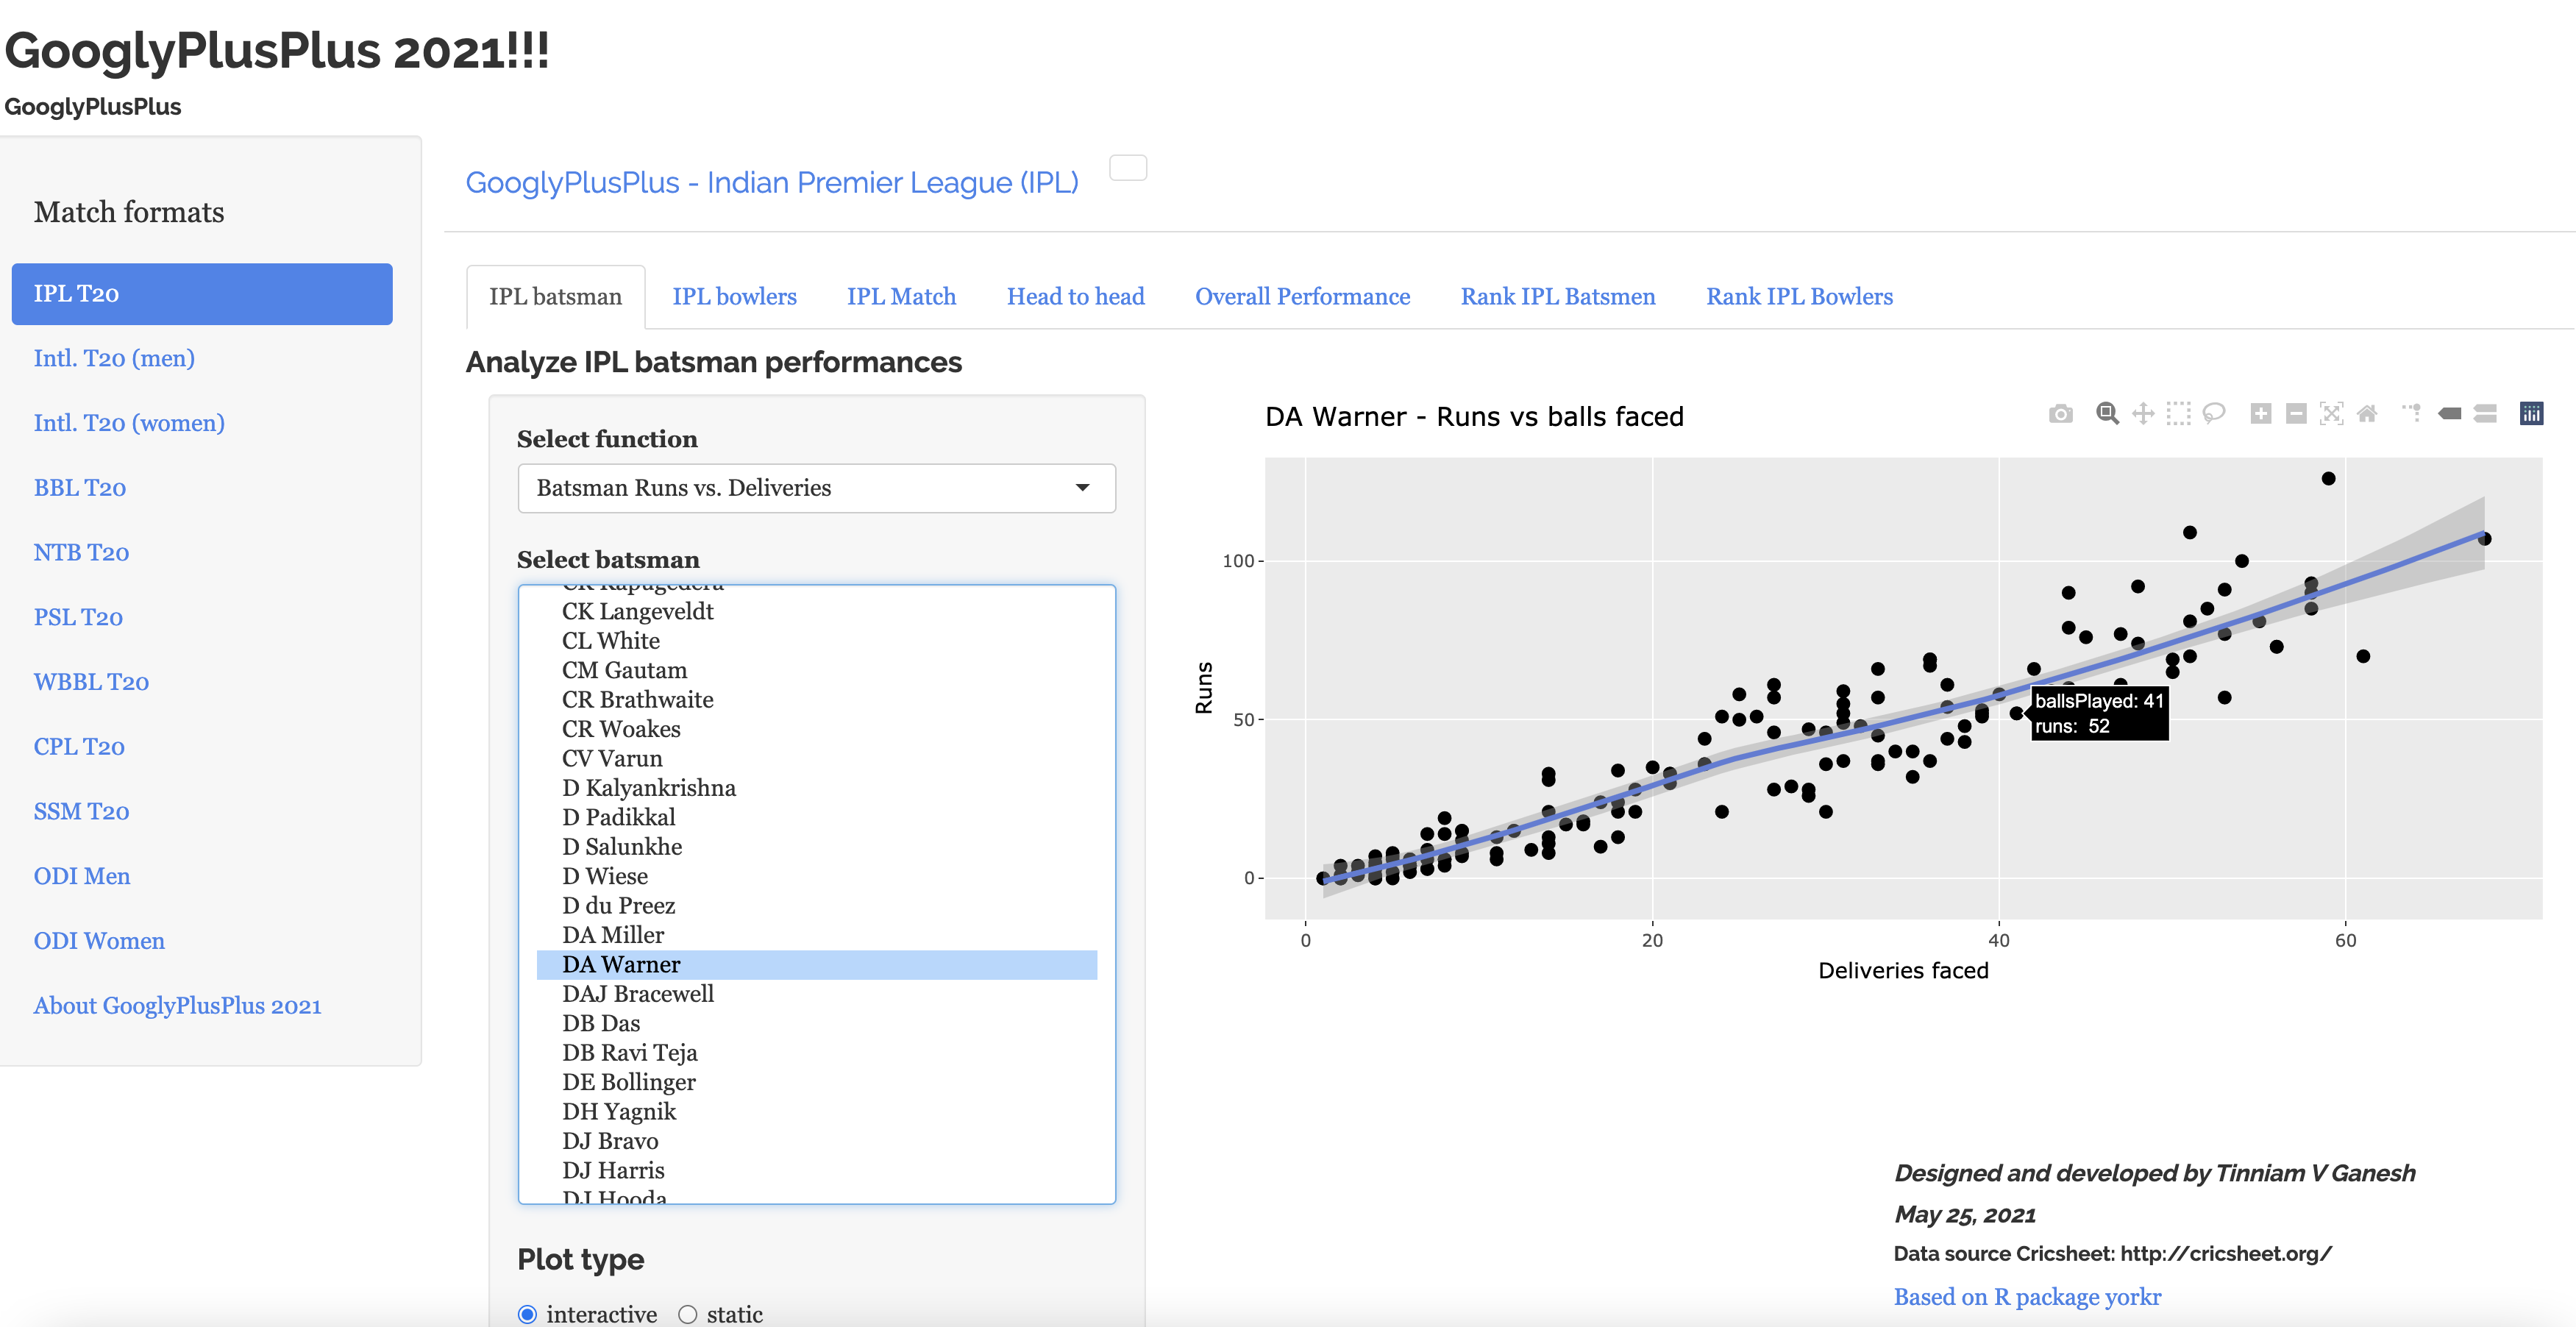
a) Batsman Analysis – Runs vs Deliveries (IPL)
Mouse-over/Hover
The plot below gives the number of runs scored by David Warner vs Deliveries faced.
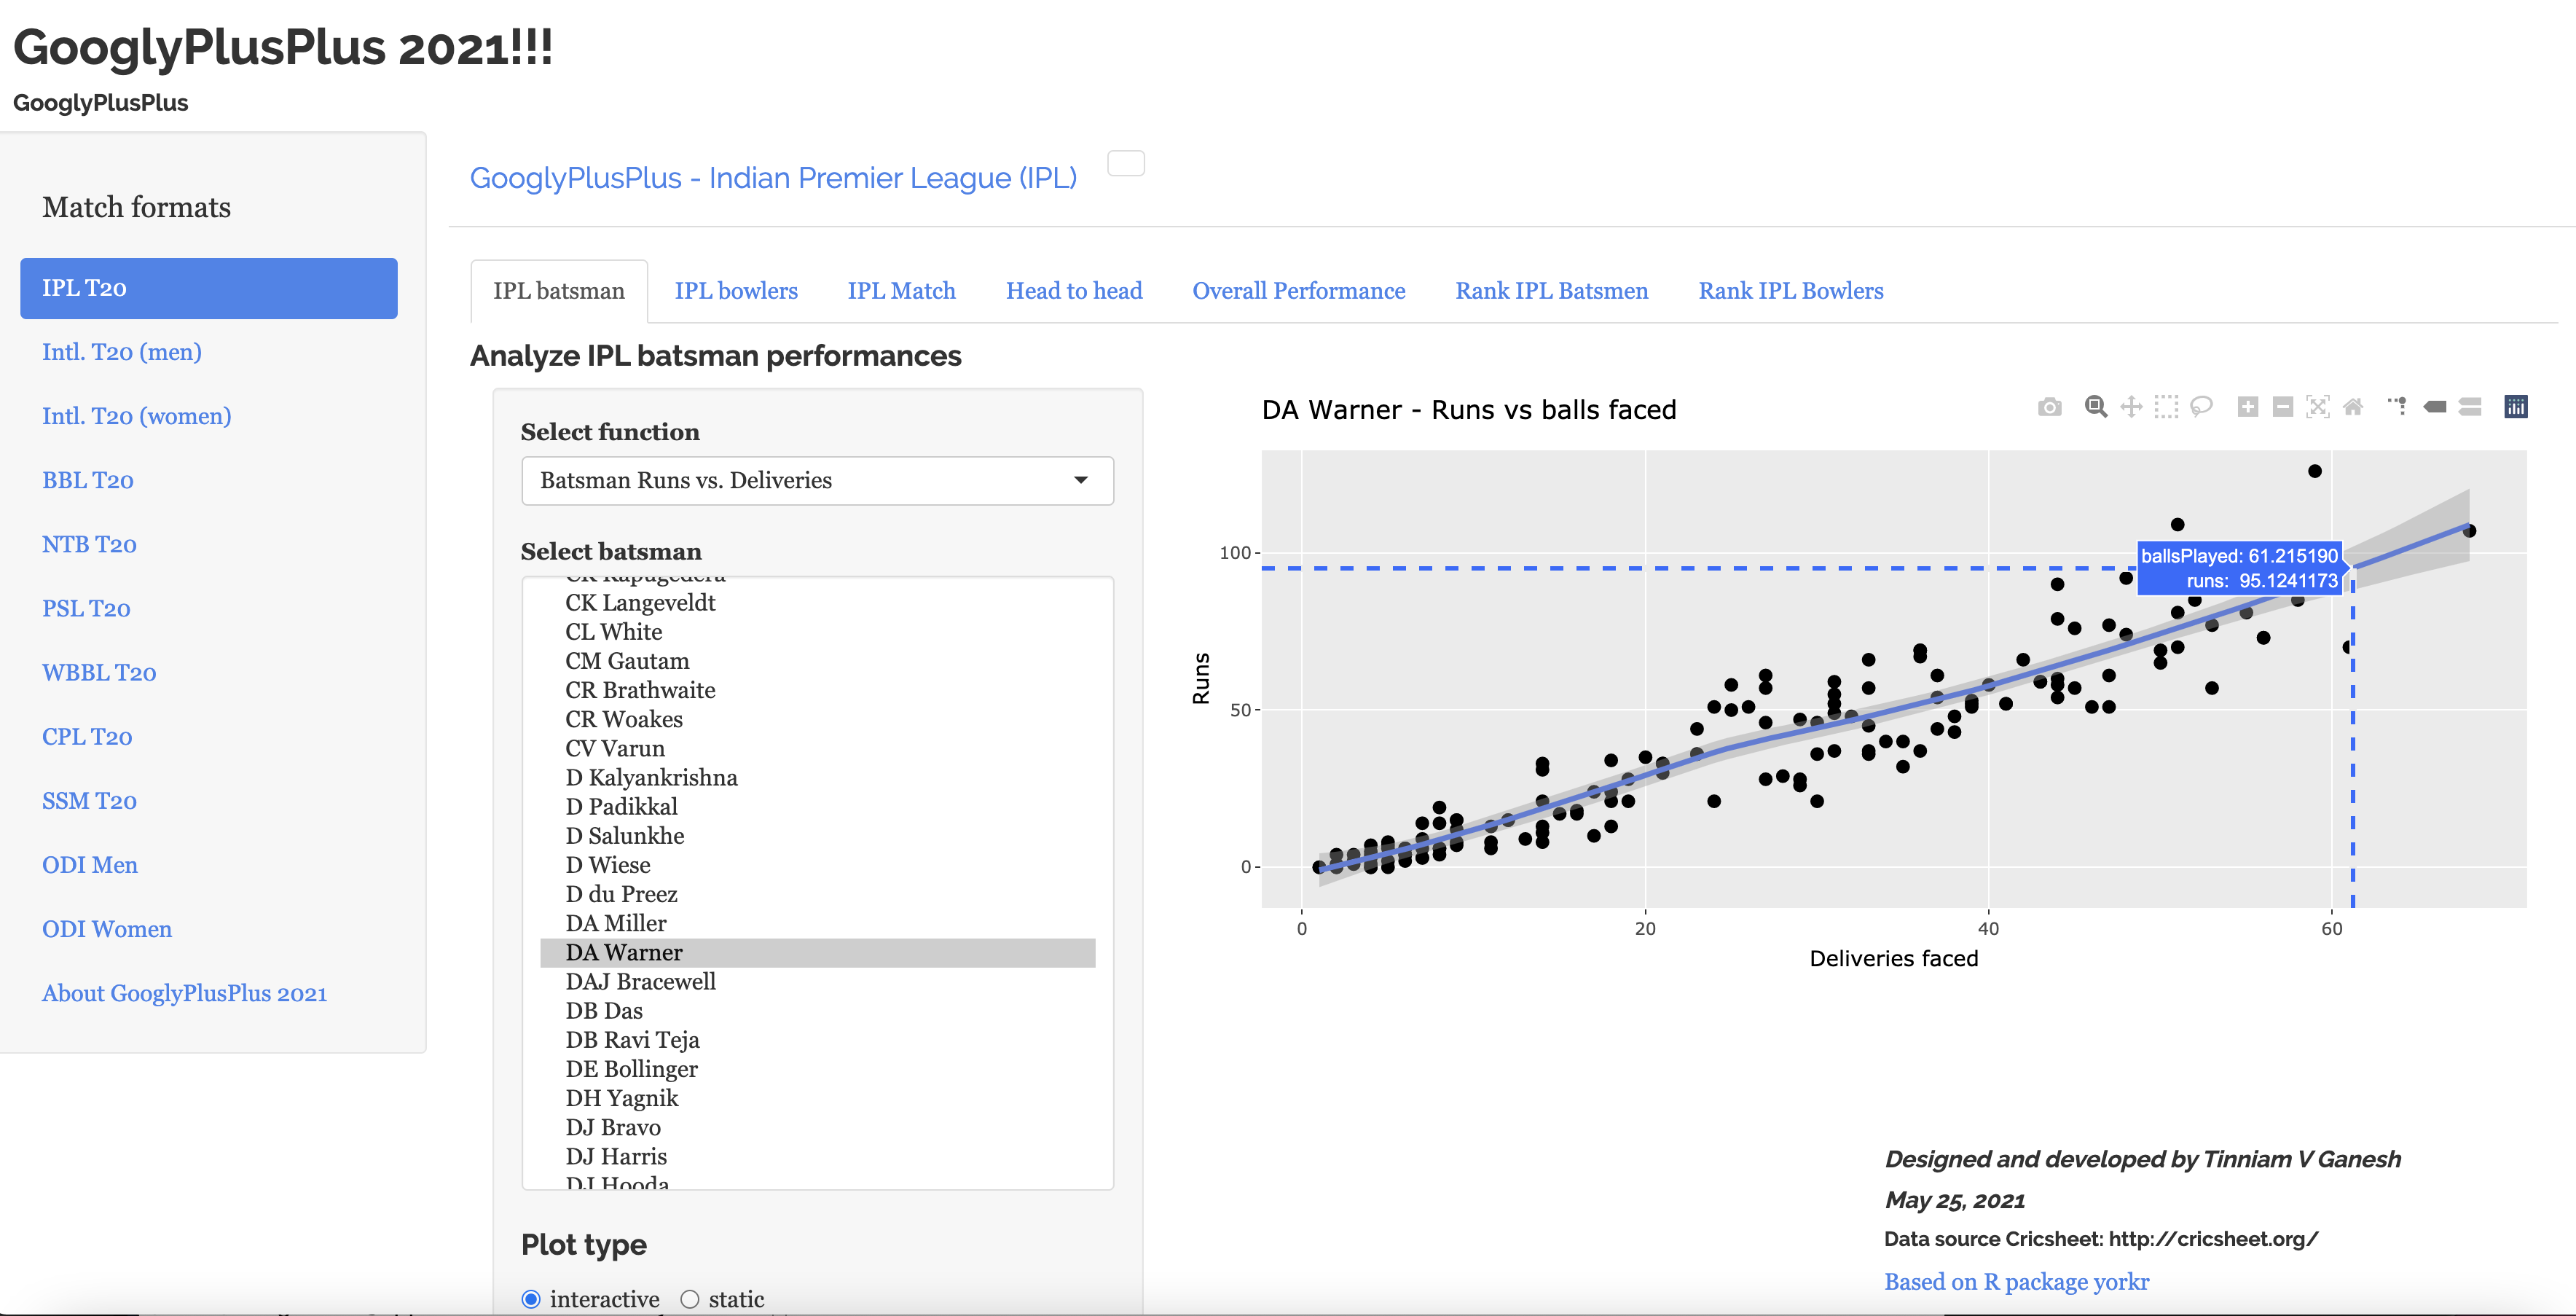
b) Batsman Analysis – Runs vs Deliveries (IPL) (prediction)
Since a 2nd order regression line,with confidence intervals(shaded area), has been fitted in the above plot, we can predict the runs given the ‘balls faced’ as below
Click ‘Toggle Spike lines’ (use palette on top-right)
By using hover(mouse-over) on the curve we can determine the predicted number of runs Warner will score given a certain number of deliveries
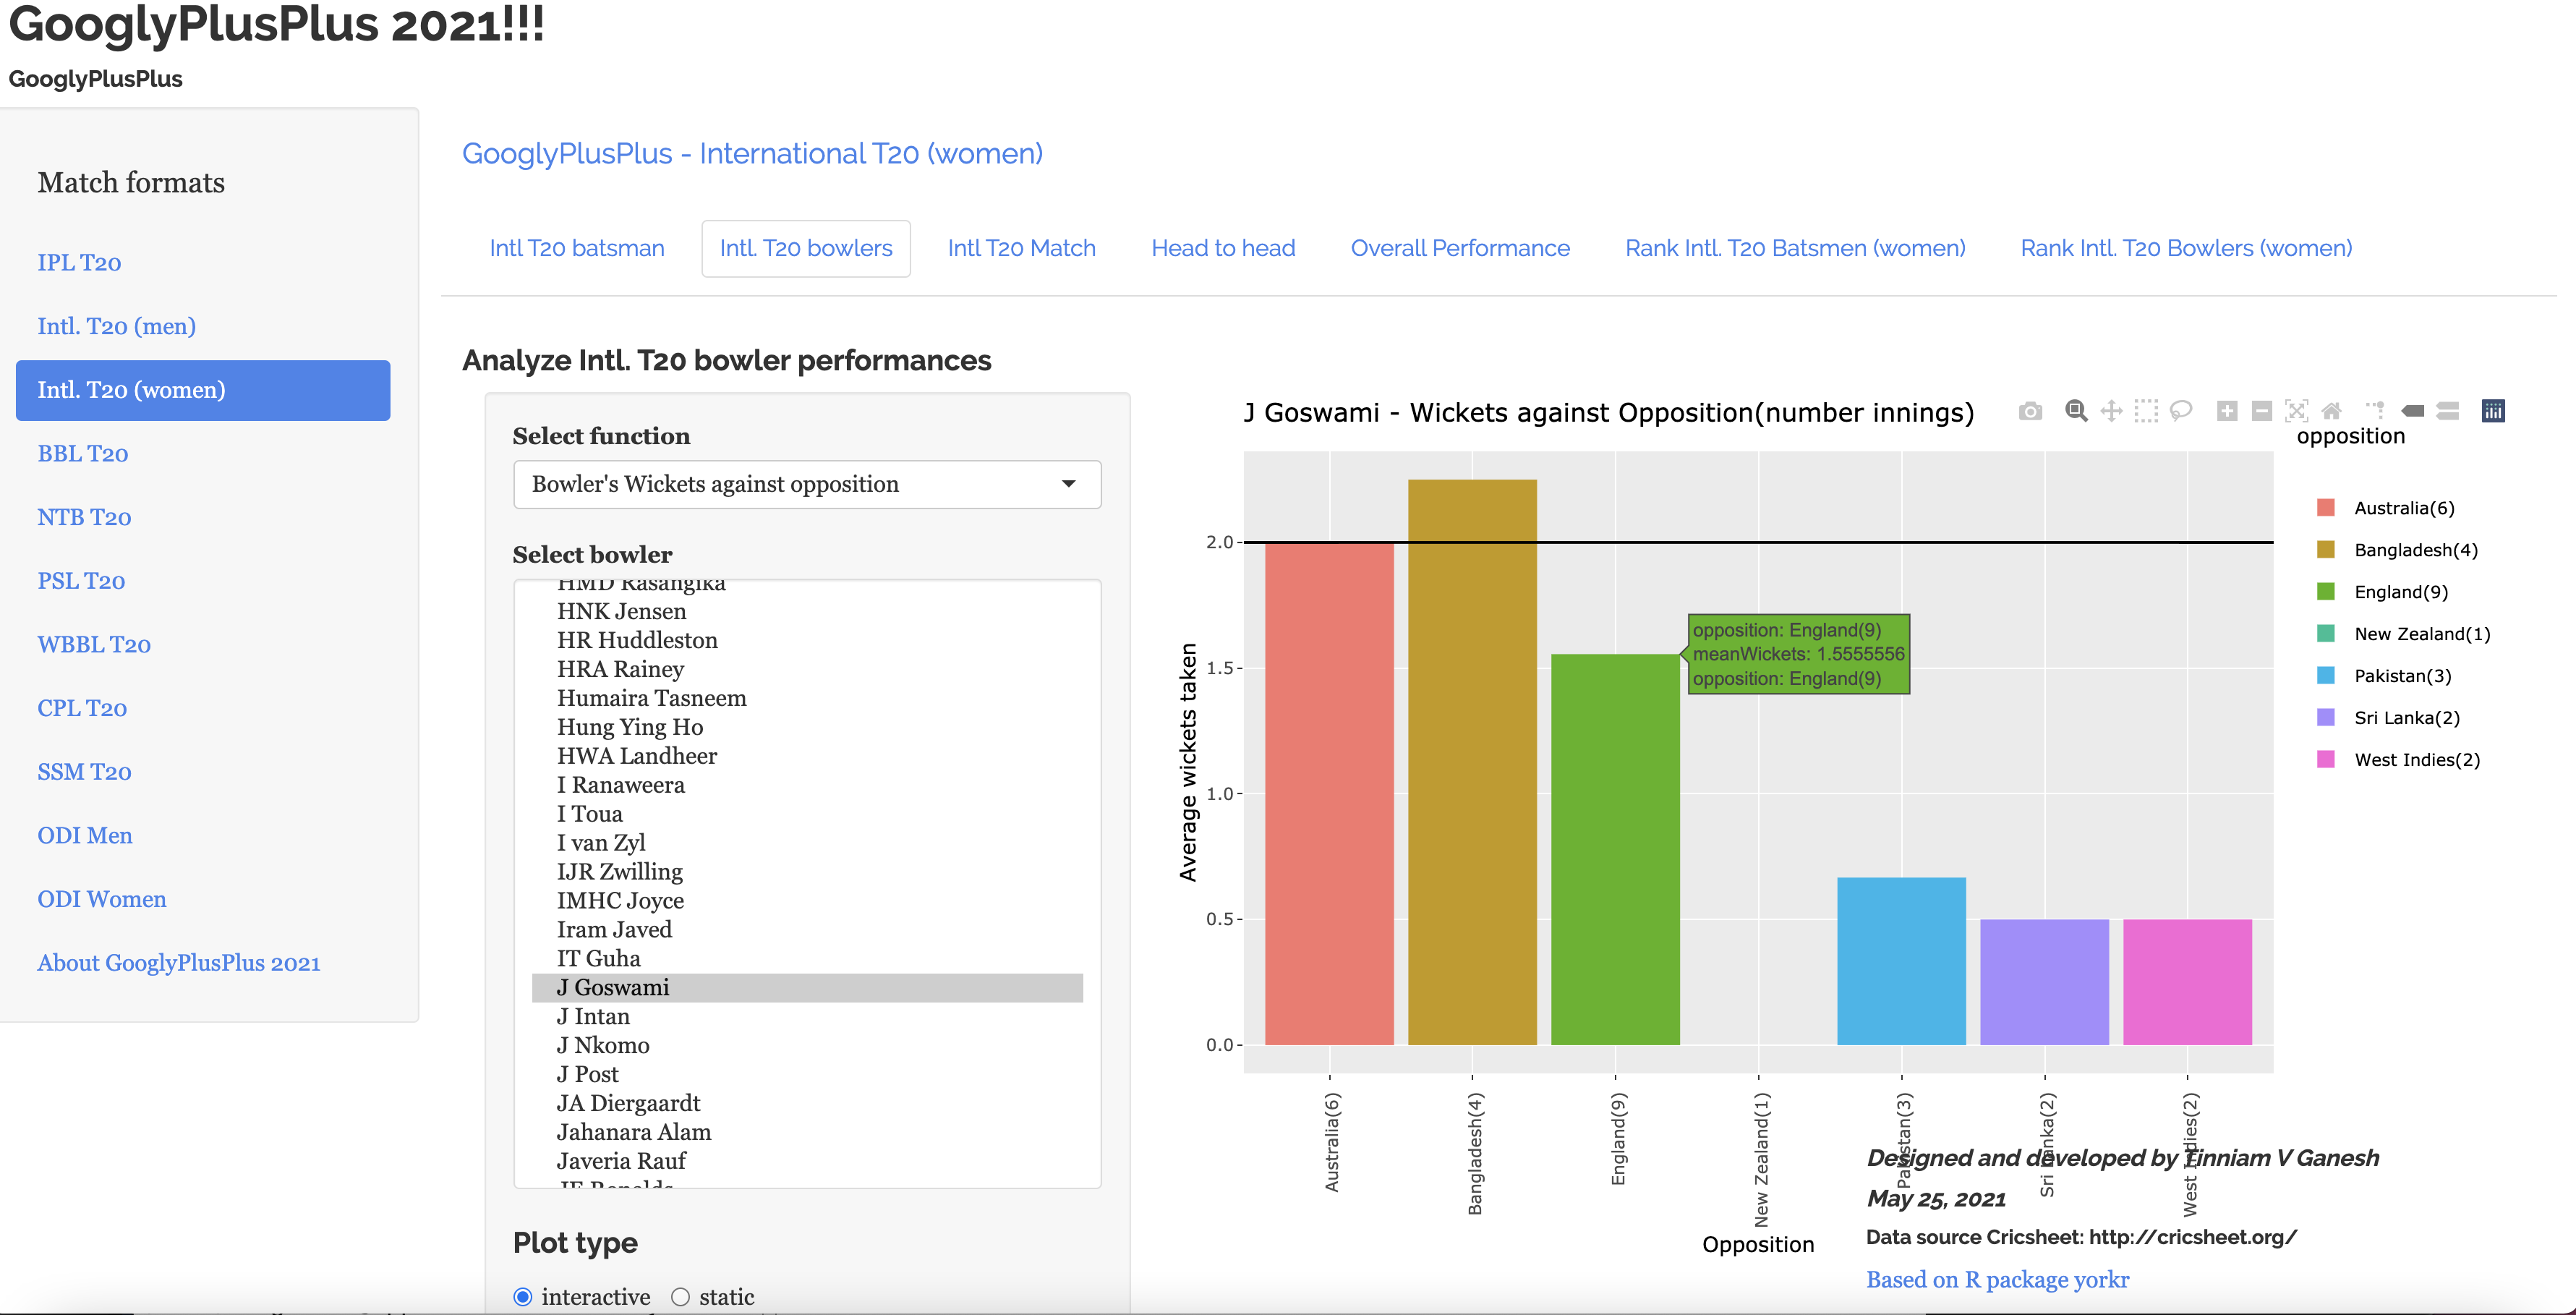
c) Bowler Analysis – Wickets against opposition – Intl. T20 (women)
Jhulan Goswami’s wickets against opposition countries in Intl. T20 (women)
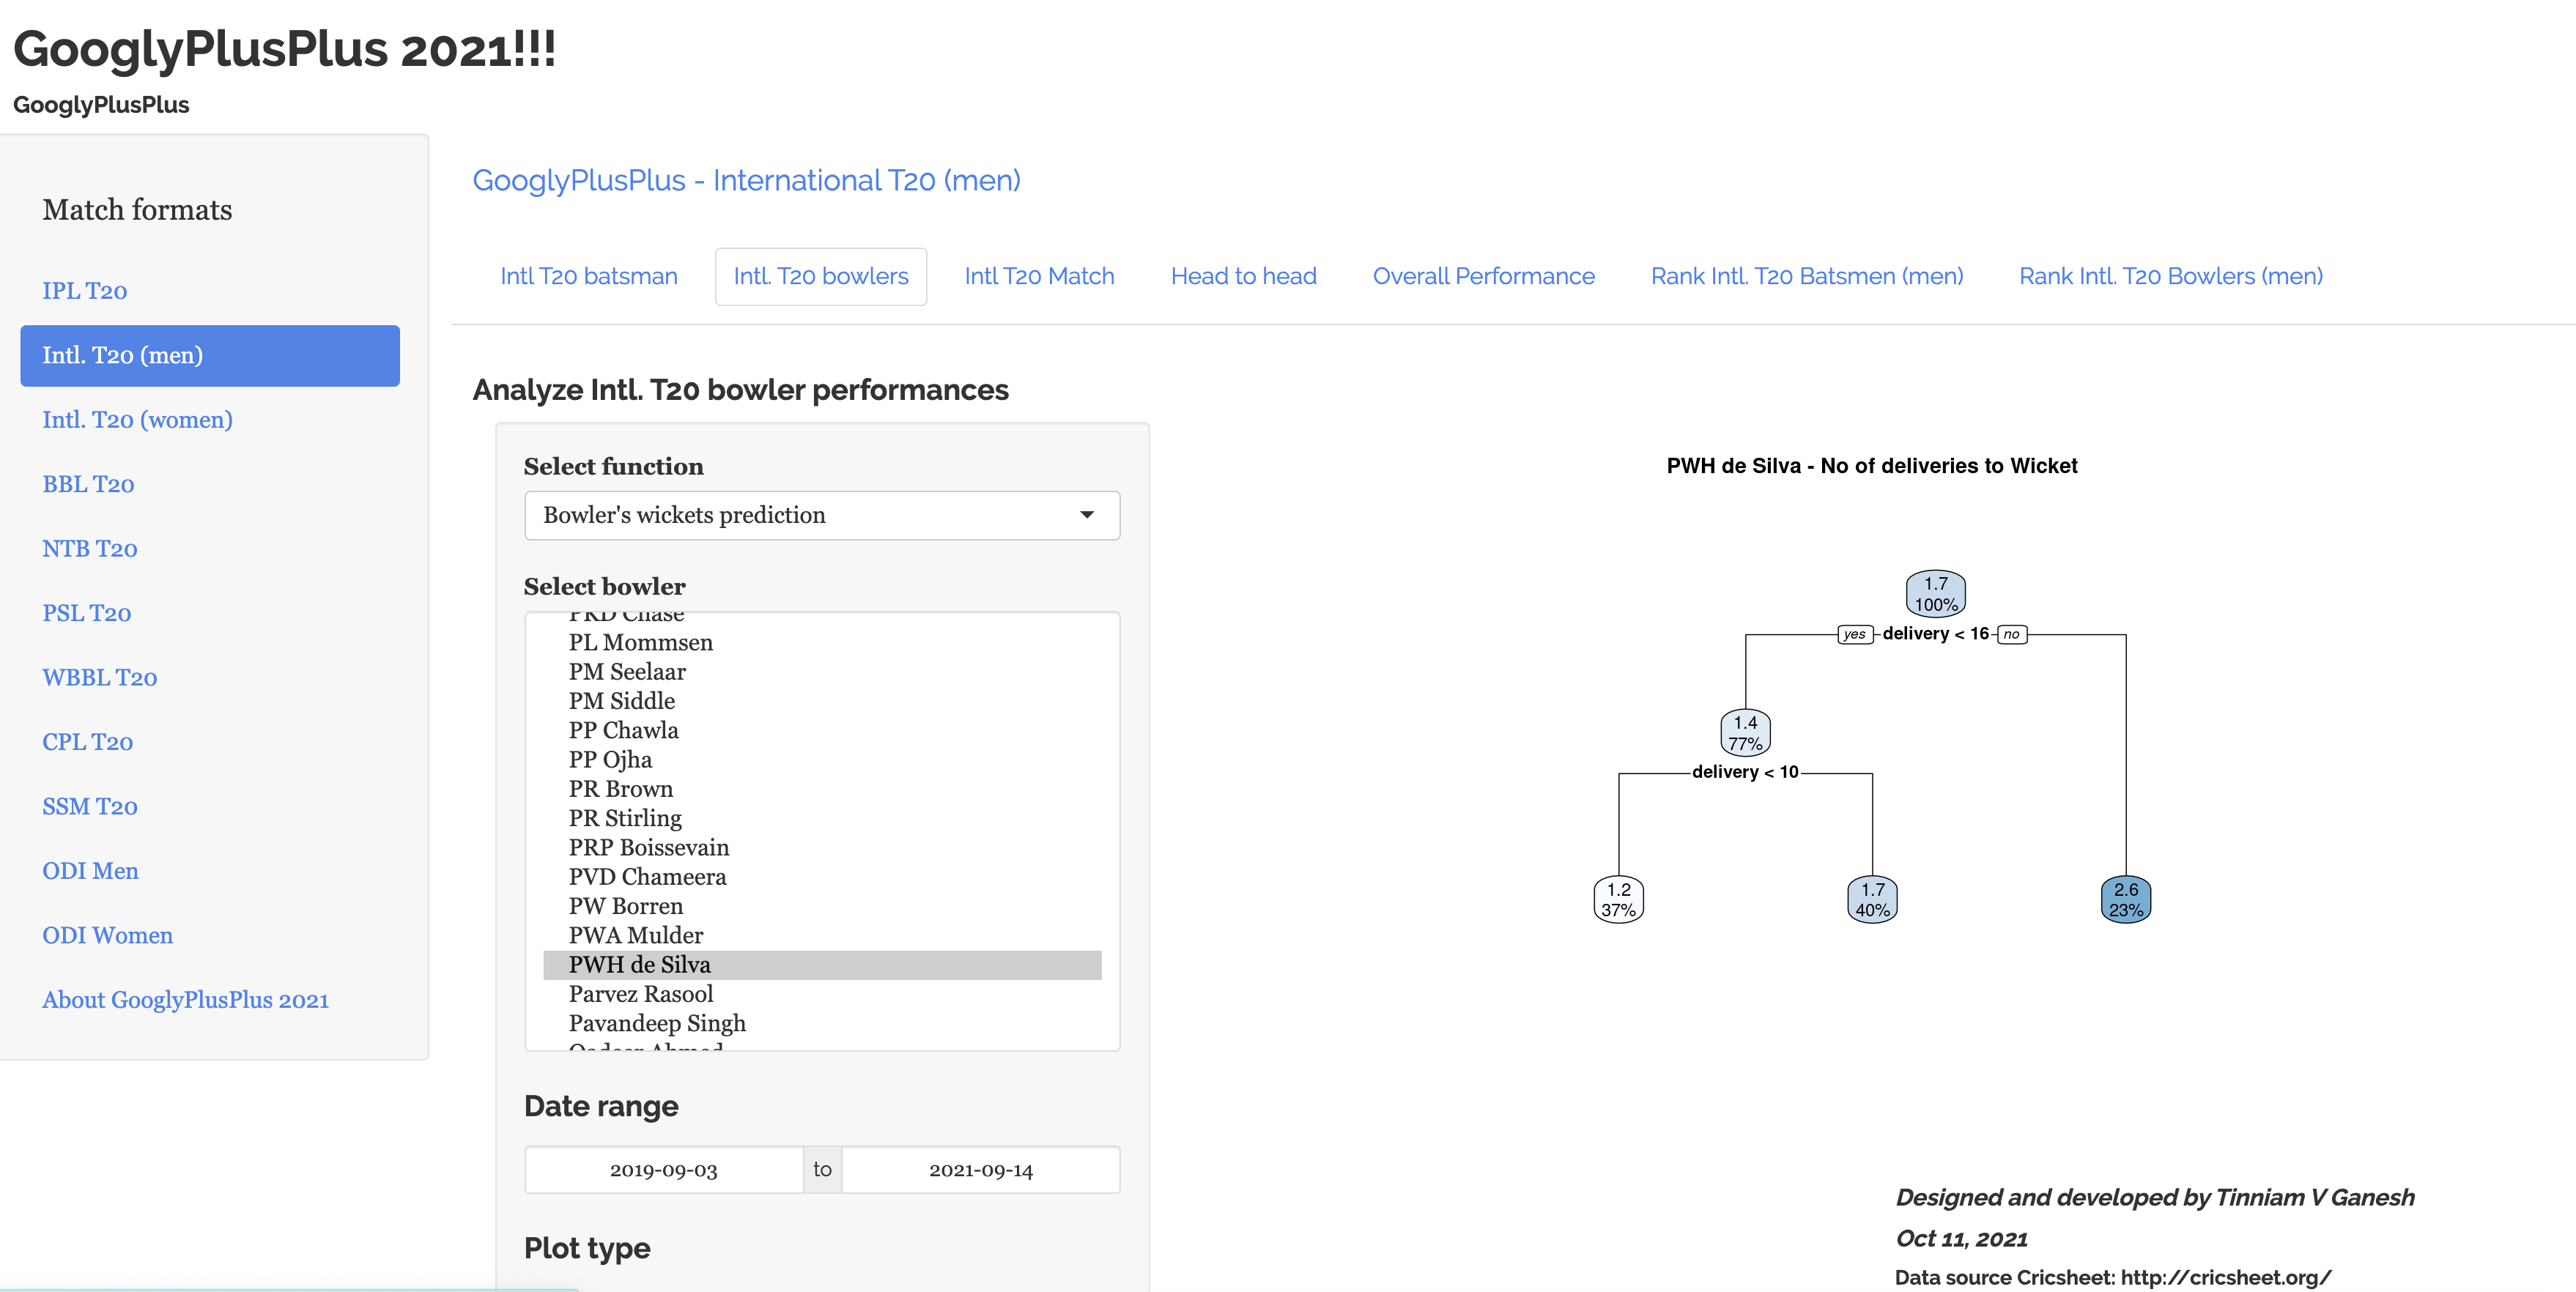
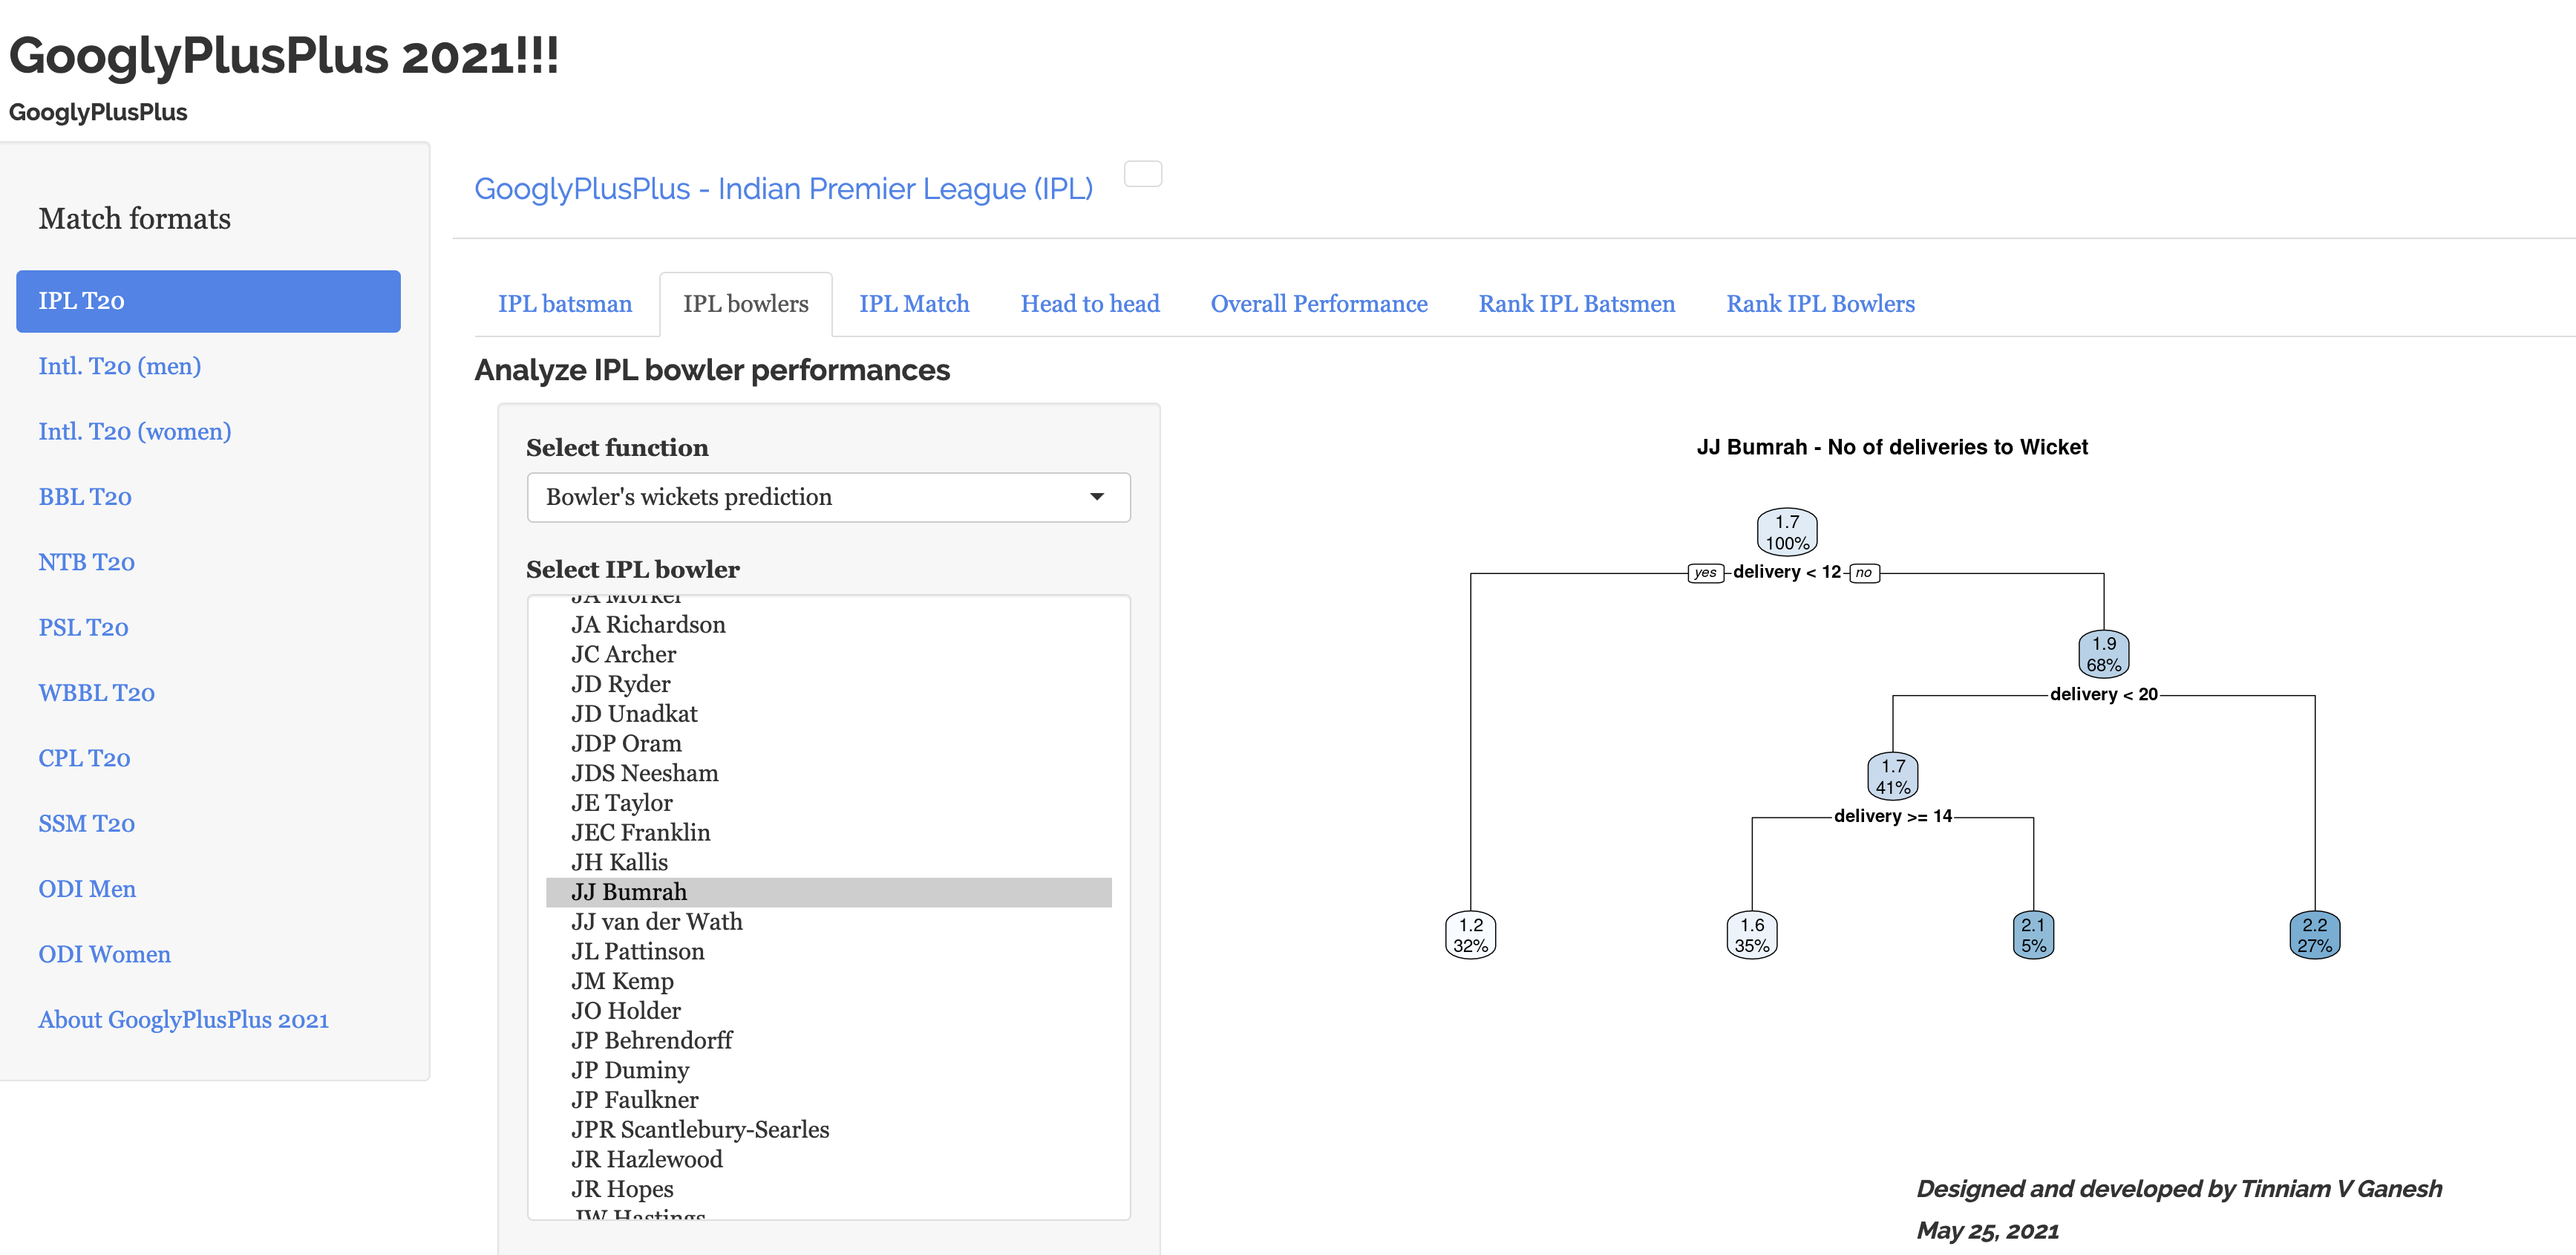
Note: Some plots are non-interactive, like the one below which predicts the number of wickets Bumrah will take based on number of deliveries bowled
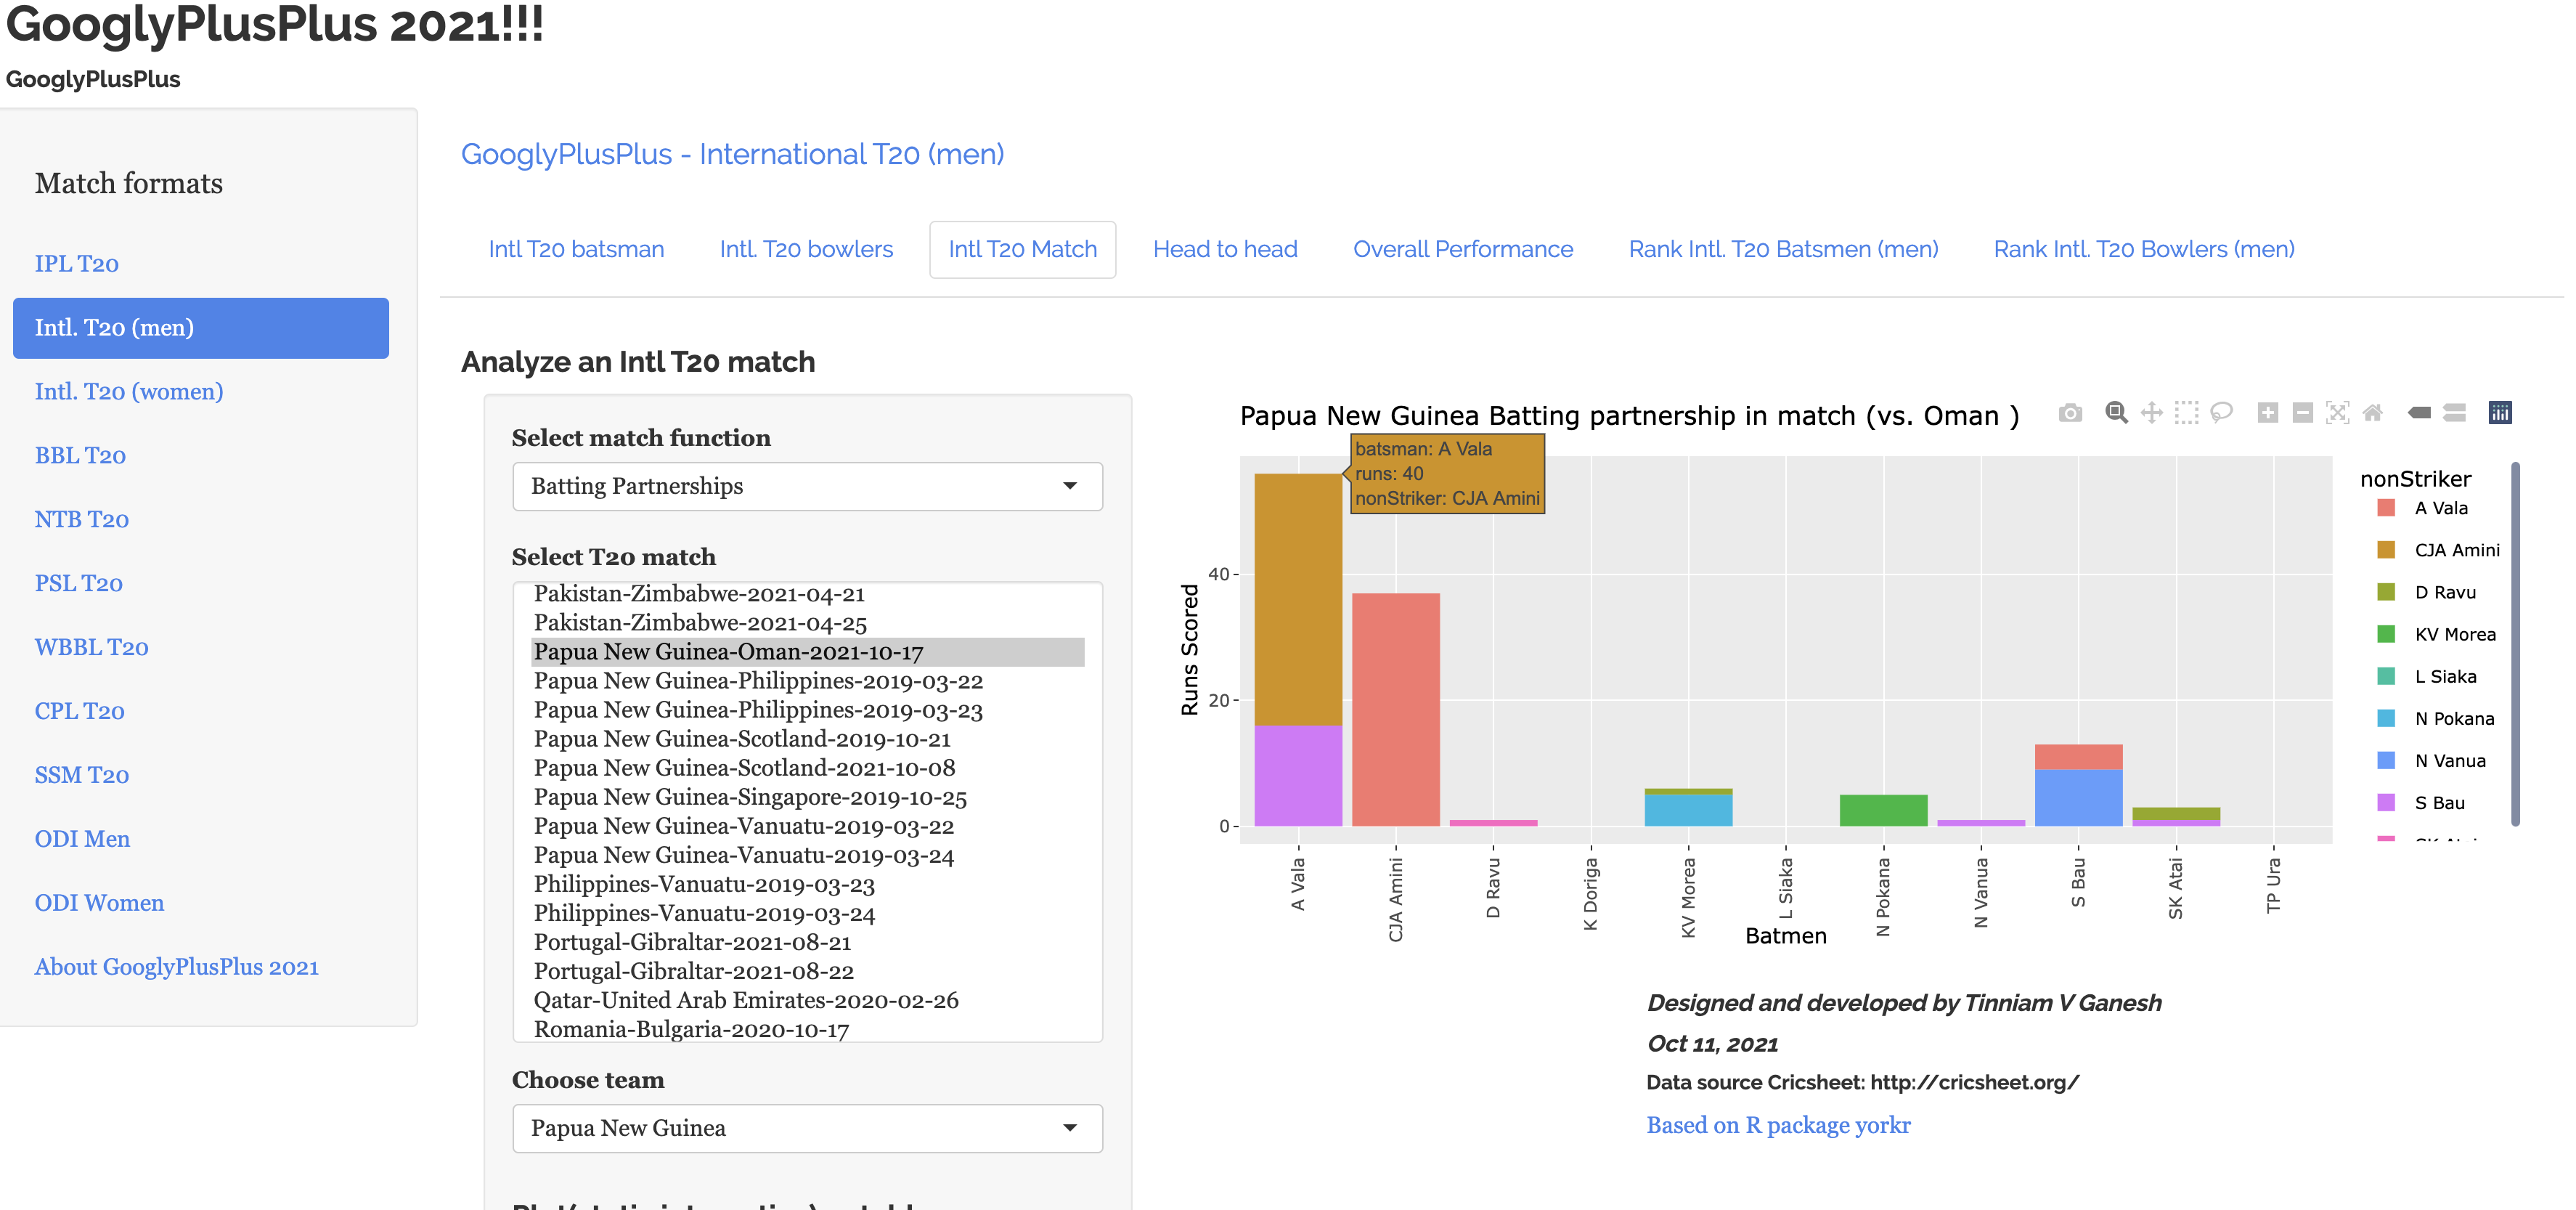
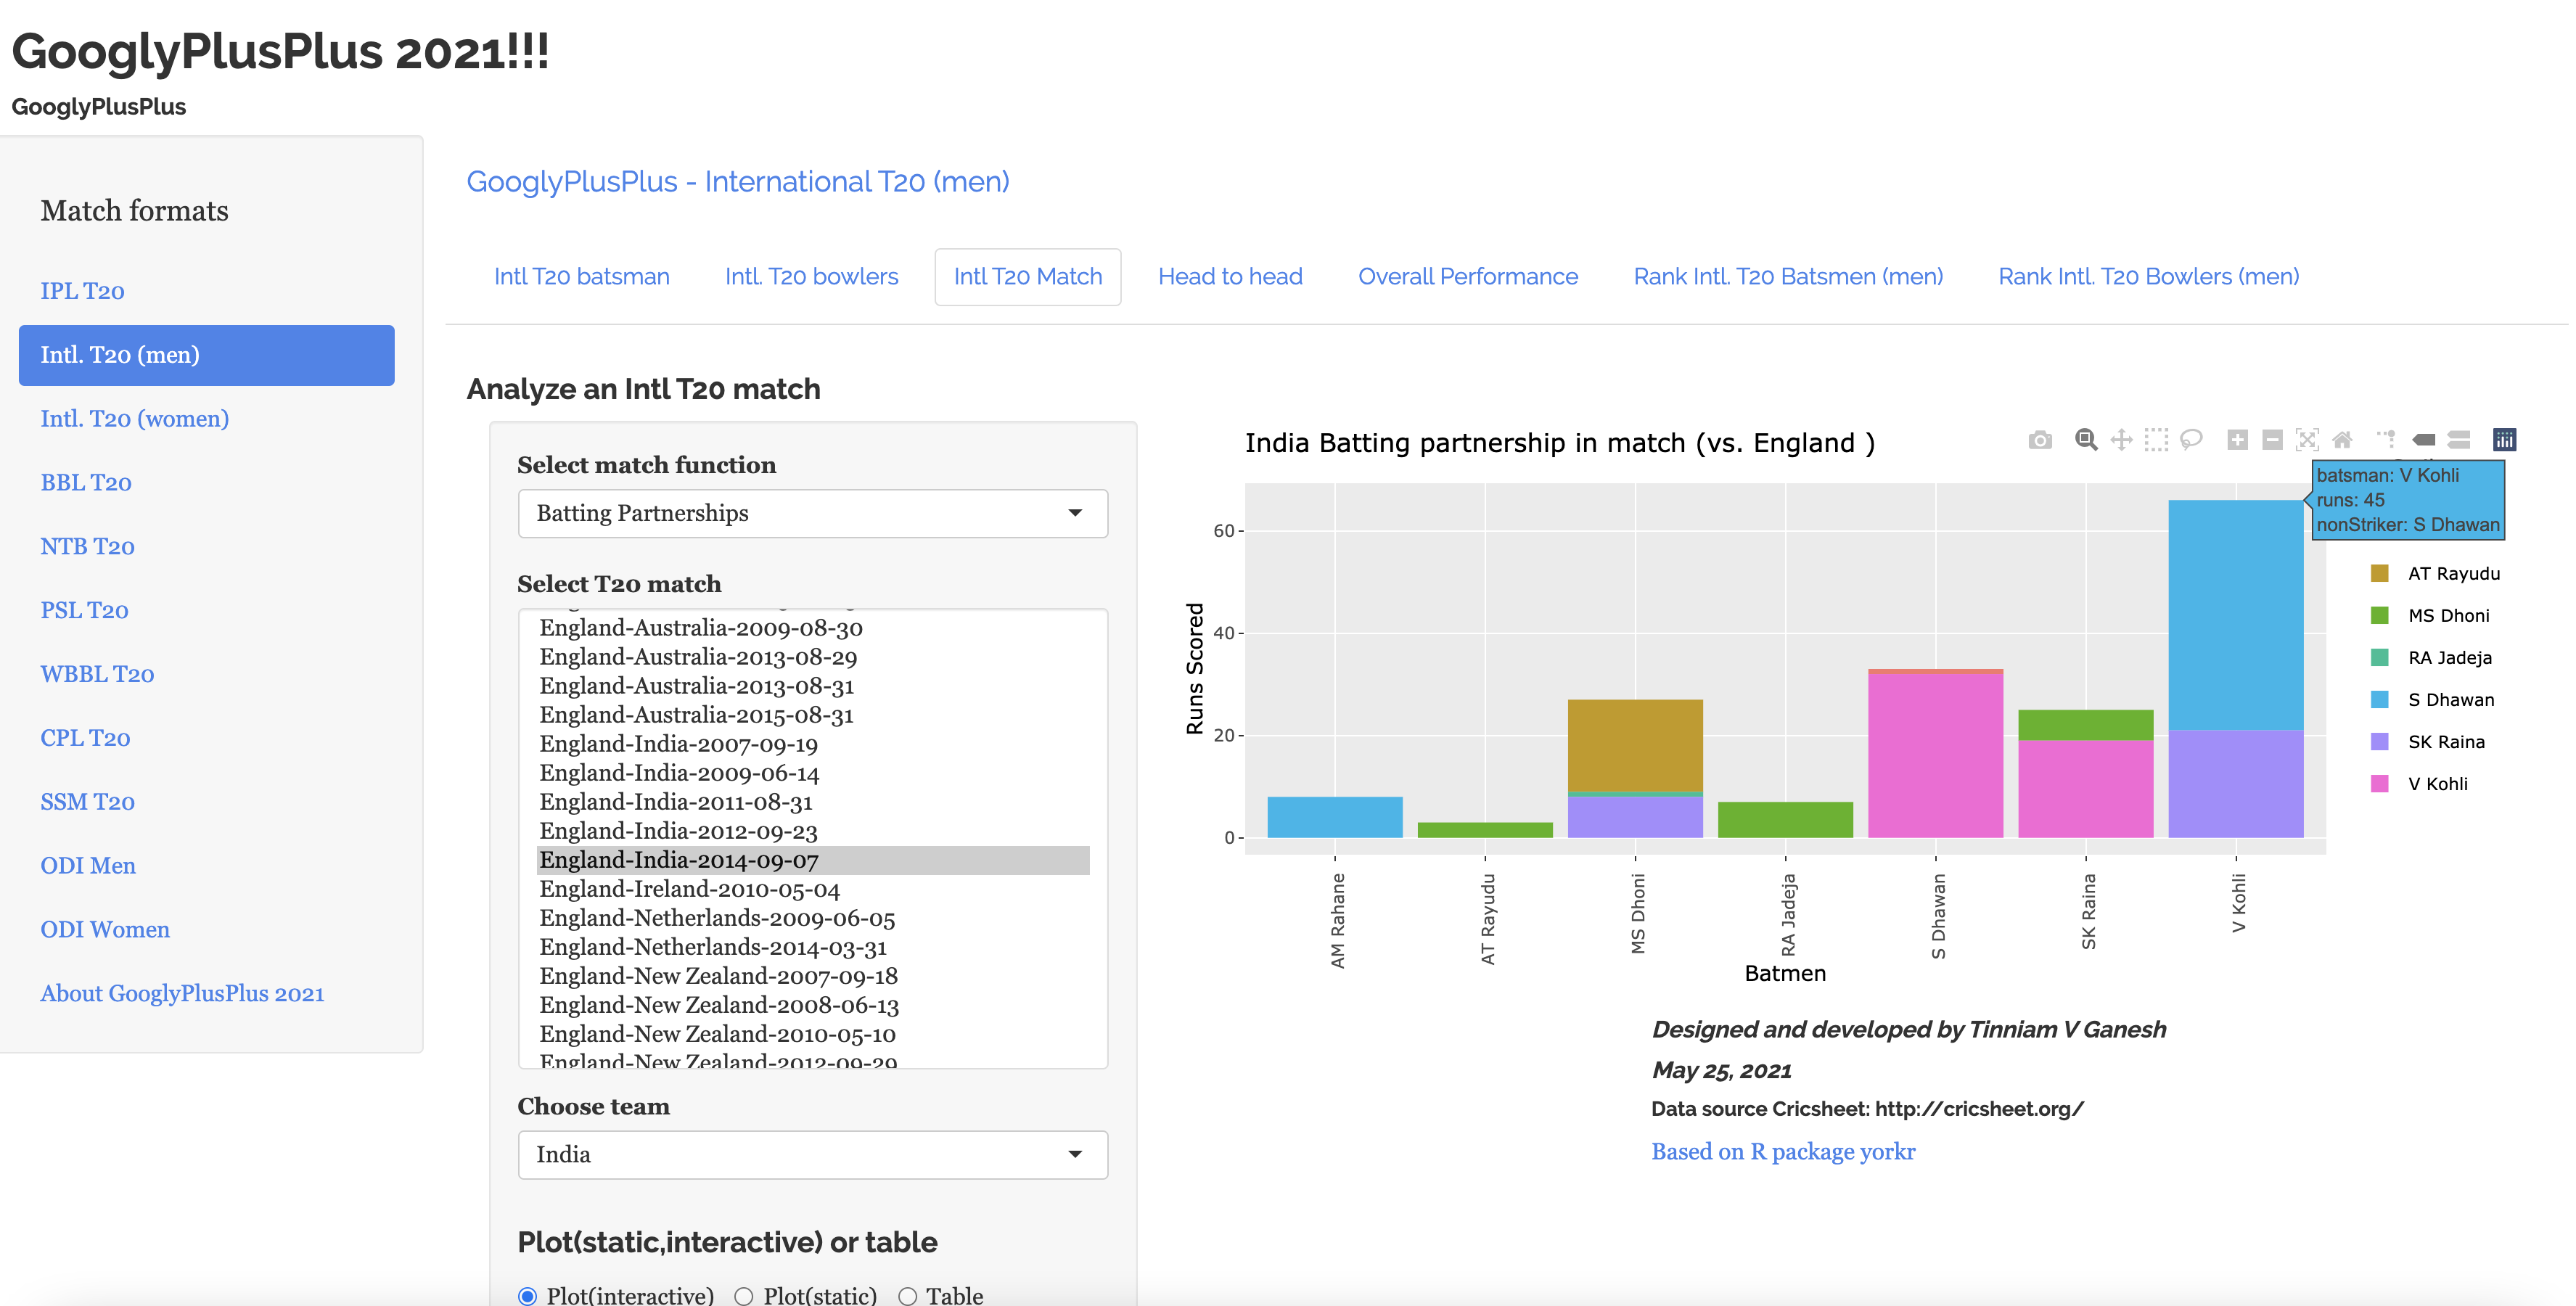
e) Match Analysis – Batsmen Partnership -Intl. T20 (men)
India vs England batting partnership between Virat Kohli & Shikhar Dhawan in all matches between England and India
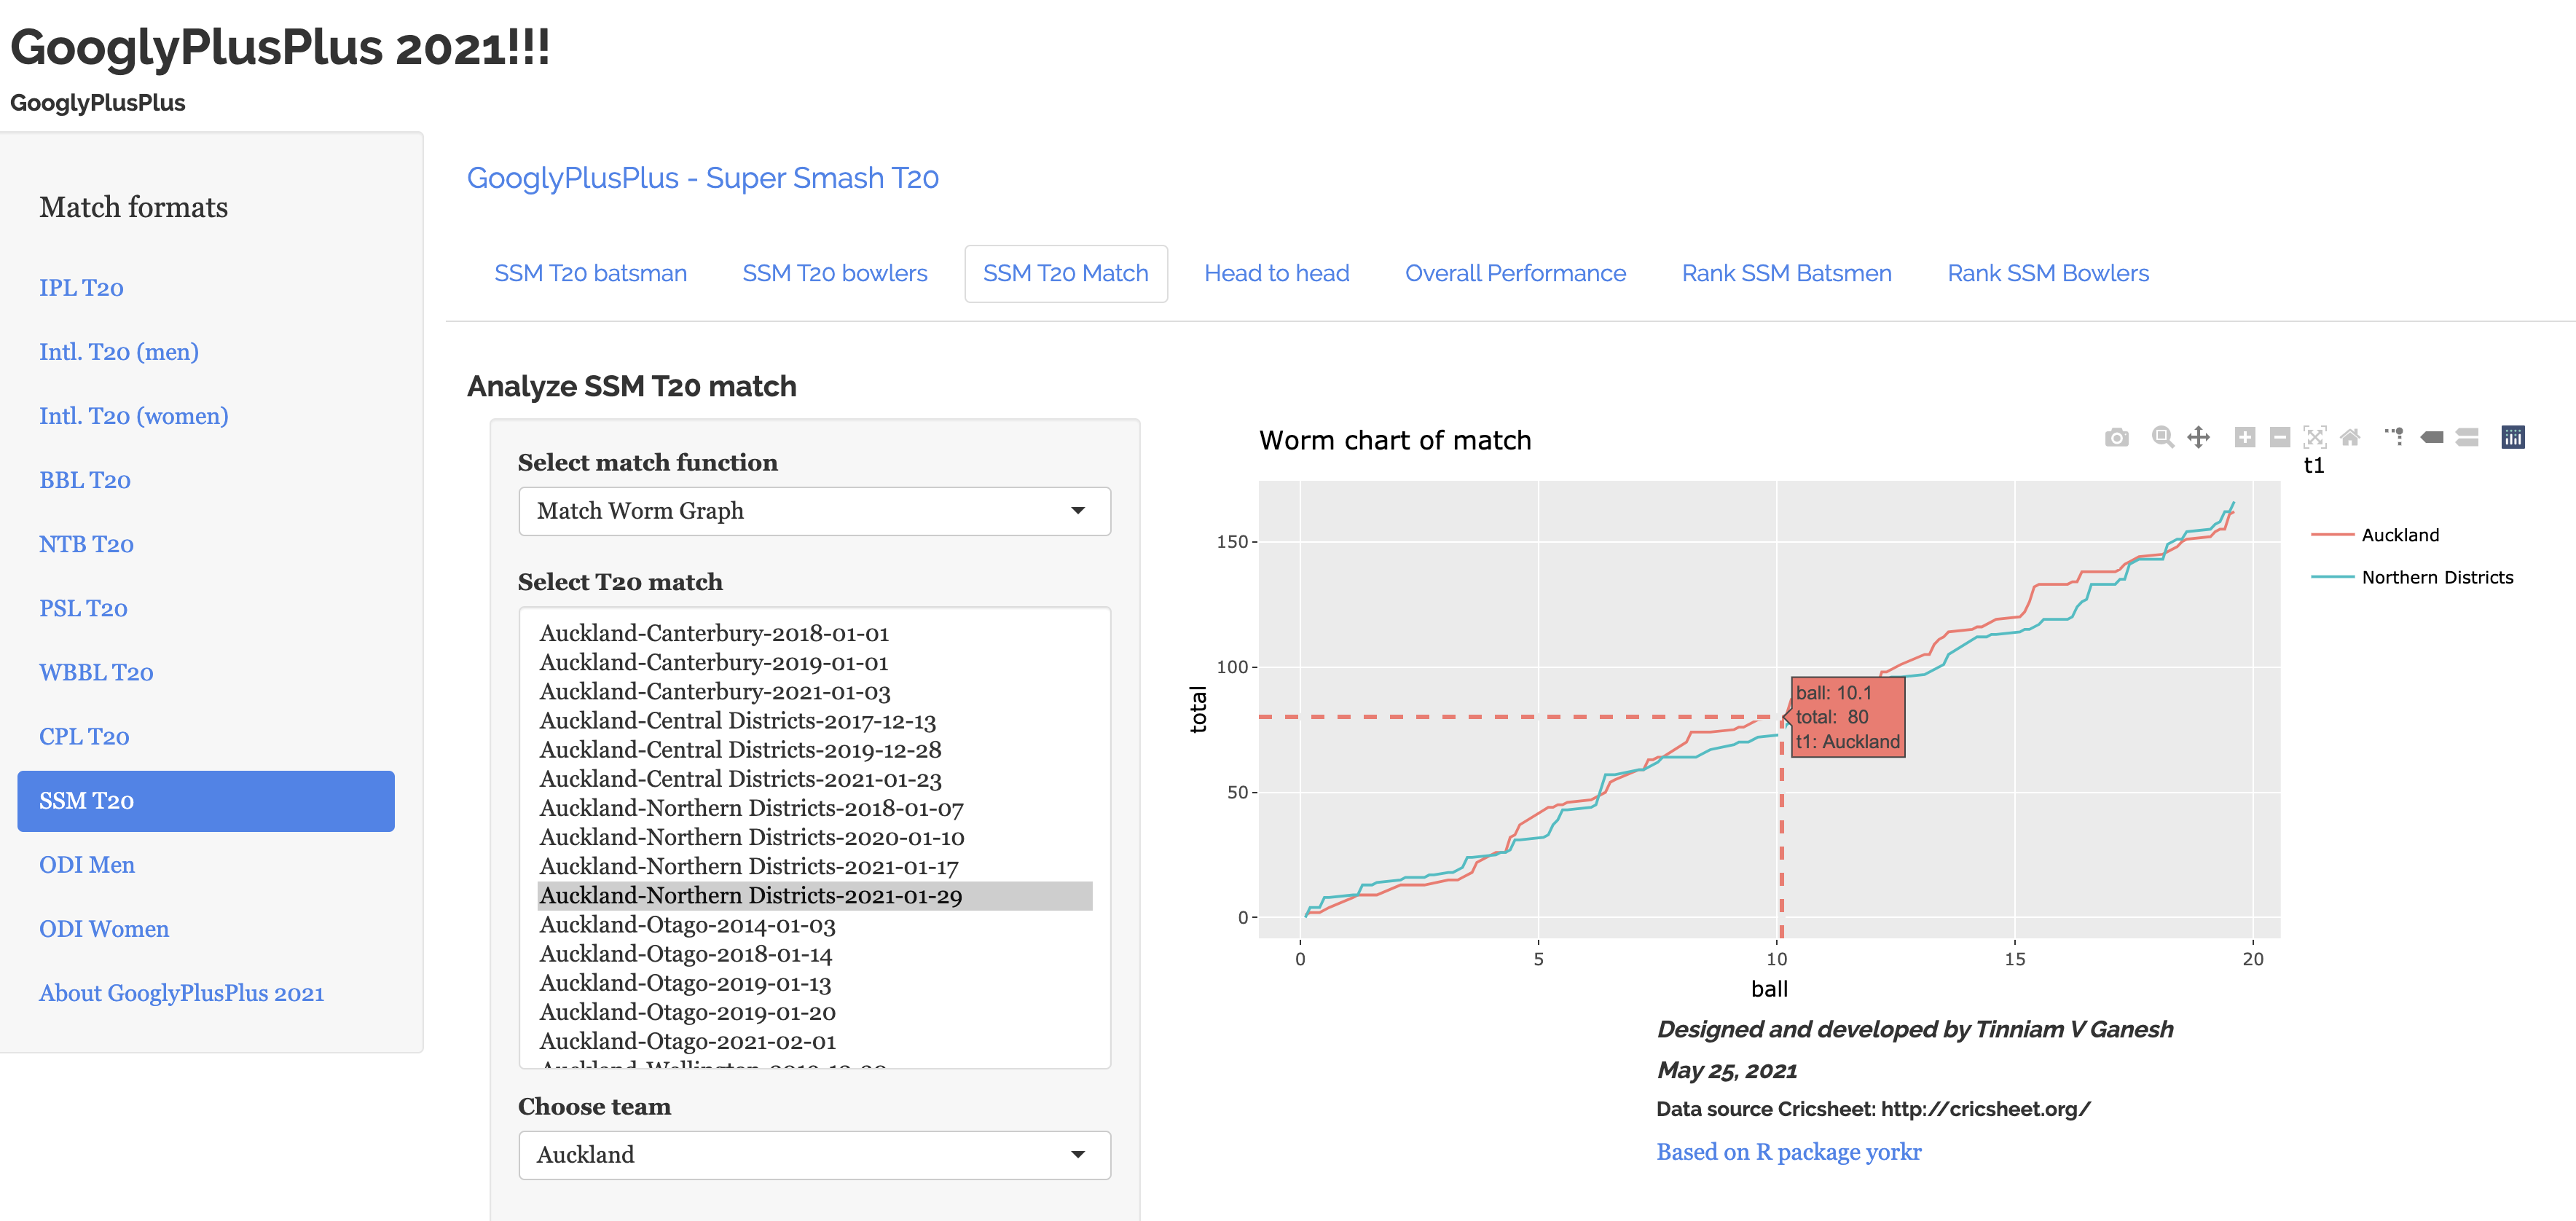
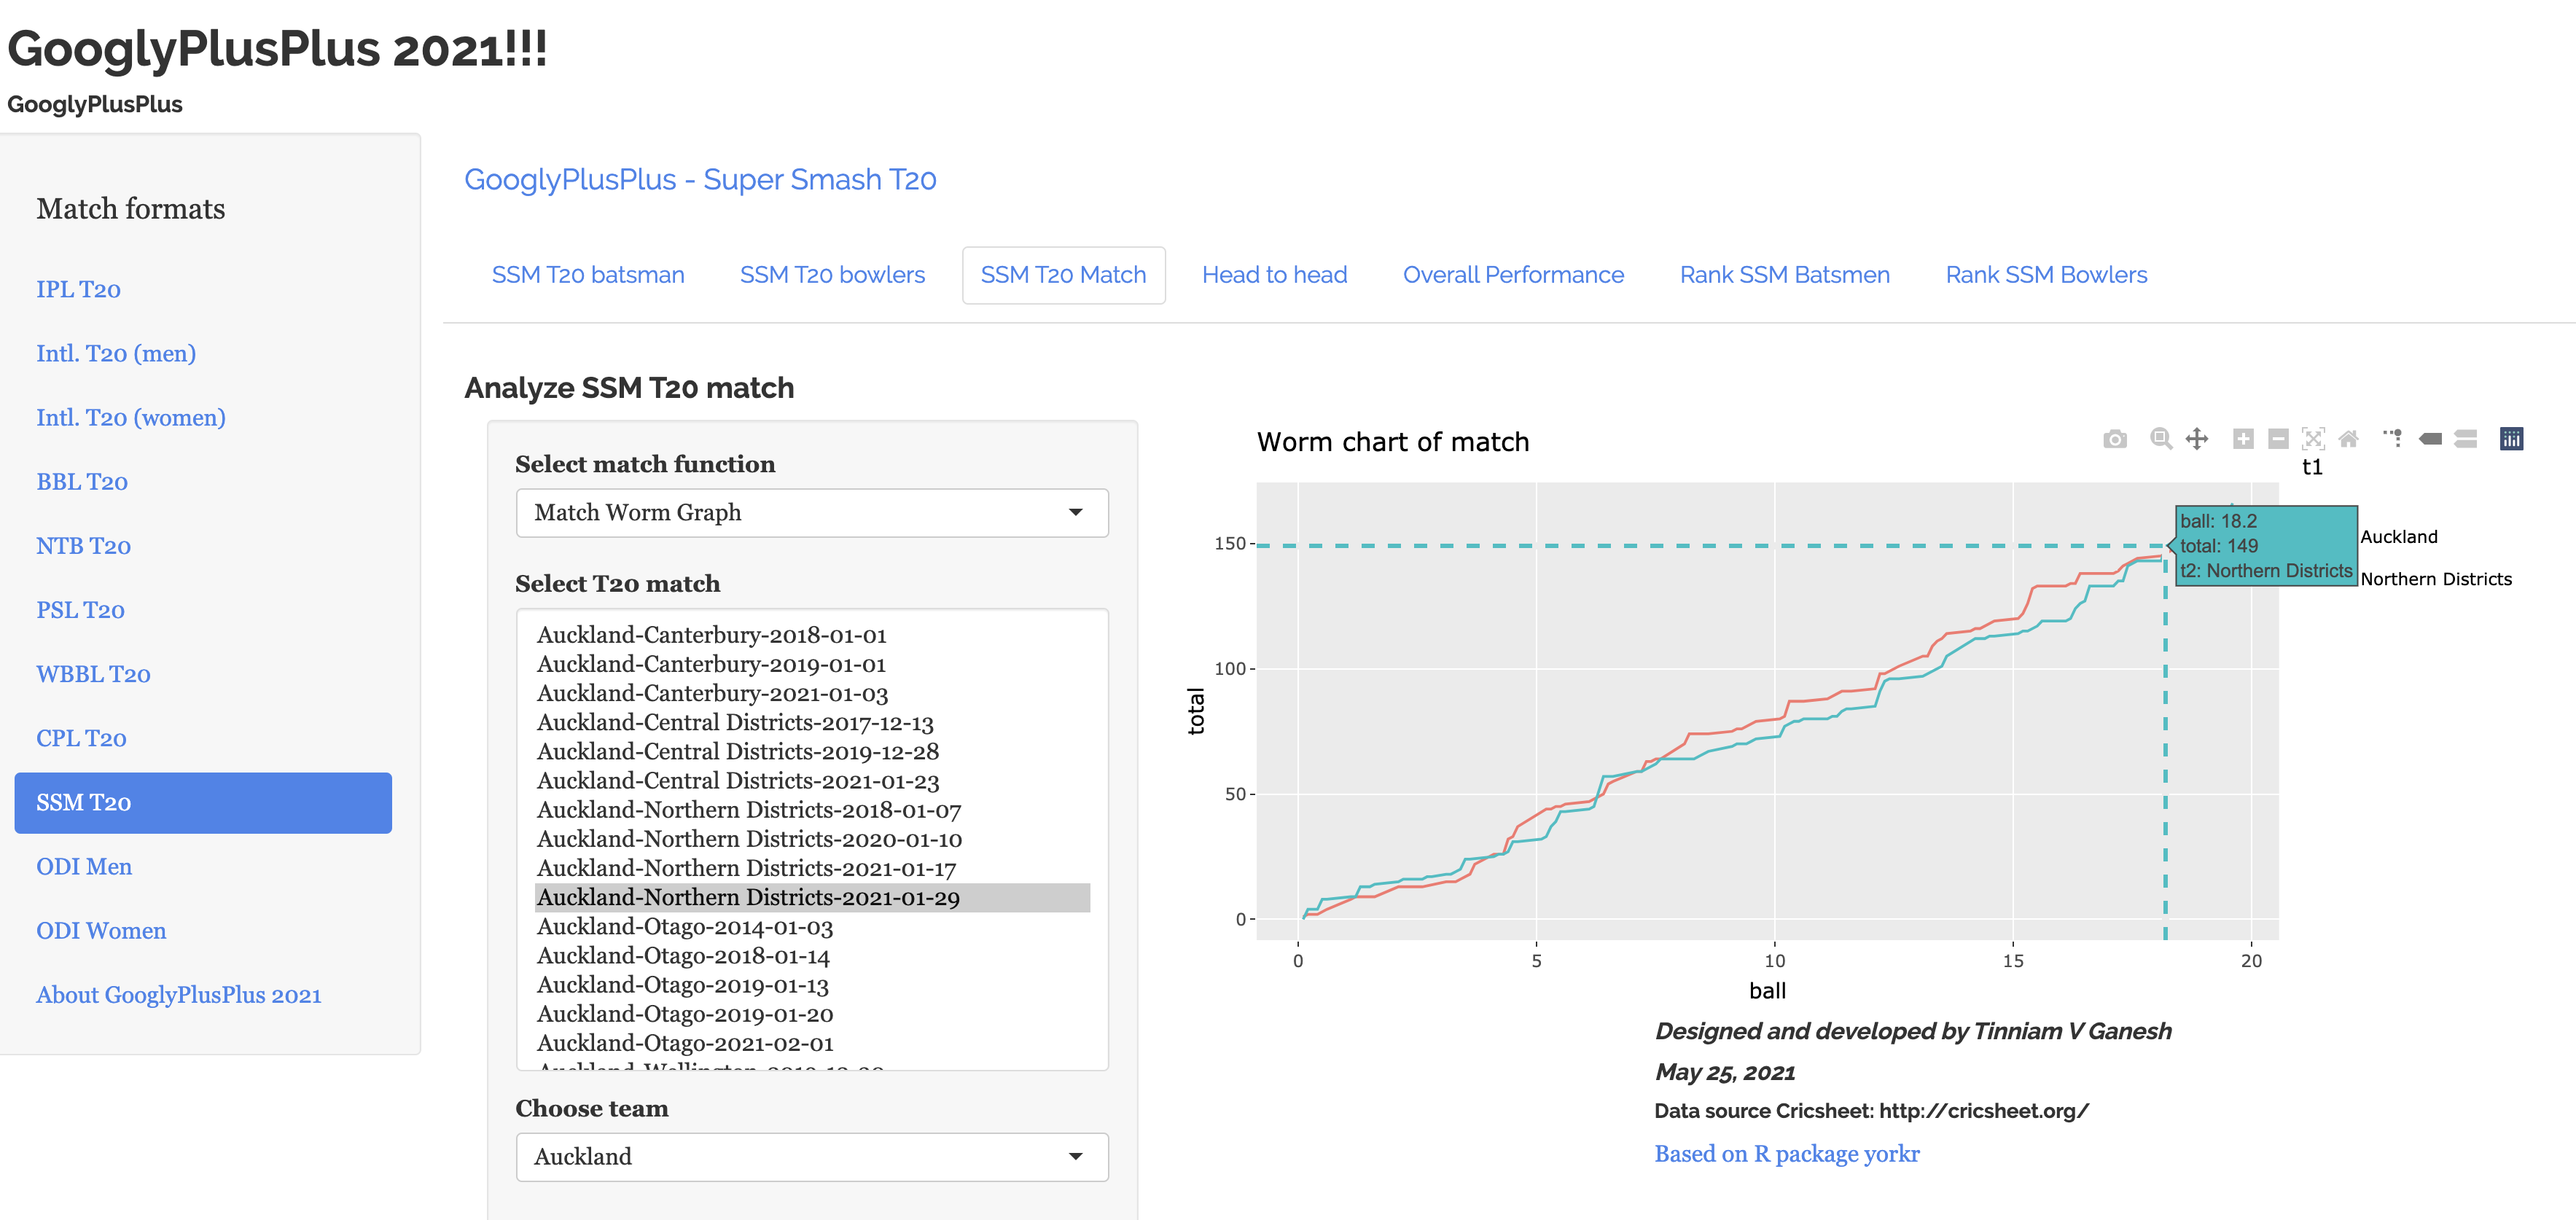
f) Match Analysis – Worm chart (Super Smash T20) SSM
i) Worm chart of Auckland vs Northern Districts (29 Jan 2021).
ii) The final cross-over happens around the 2nd delivery of the 19th over (18.2) as Northern Districts over-takes Auckland to win the match.
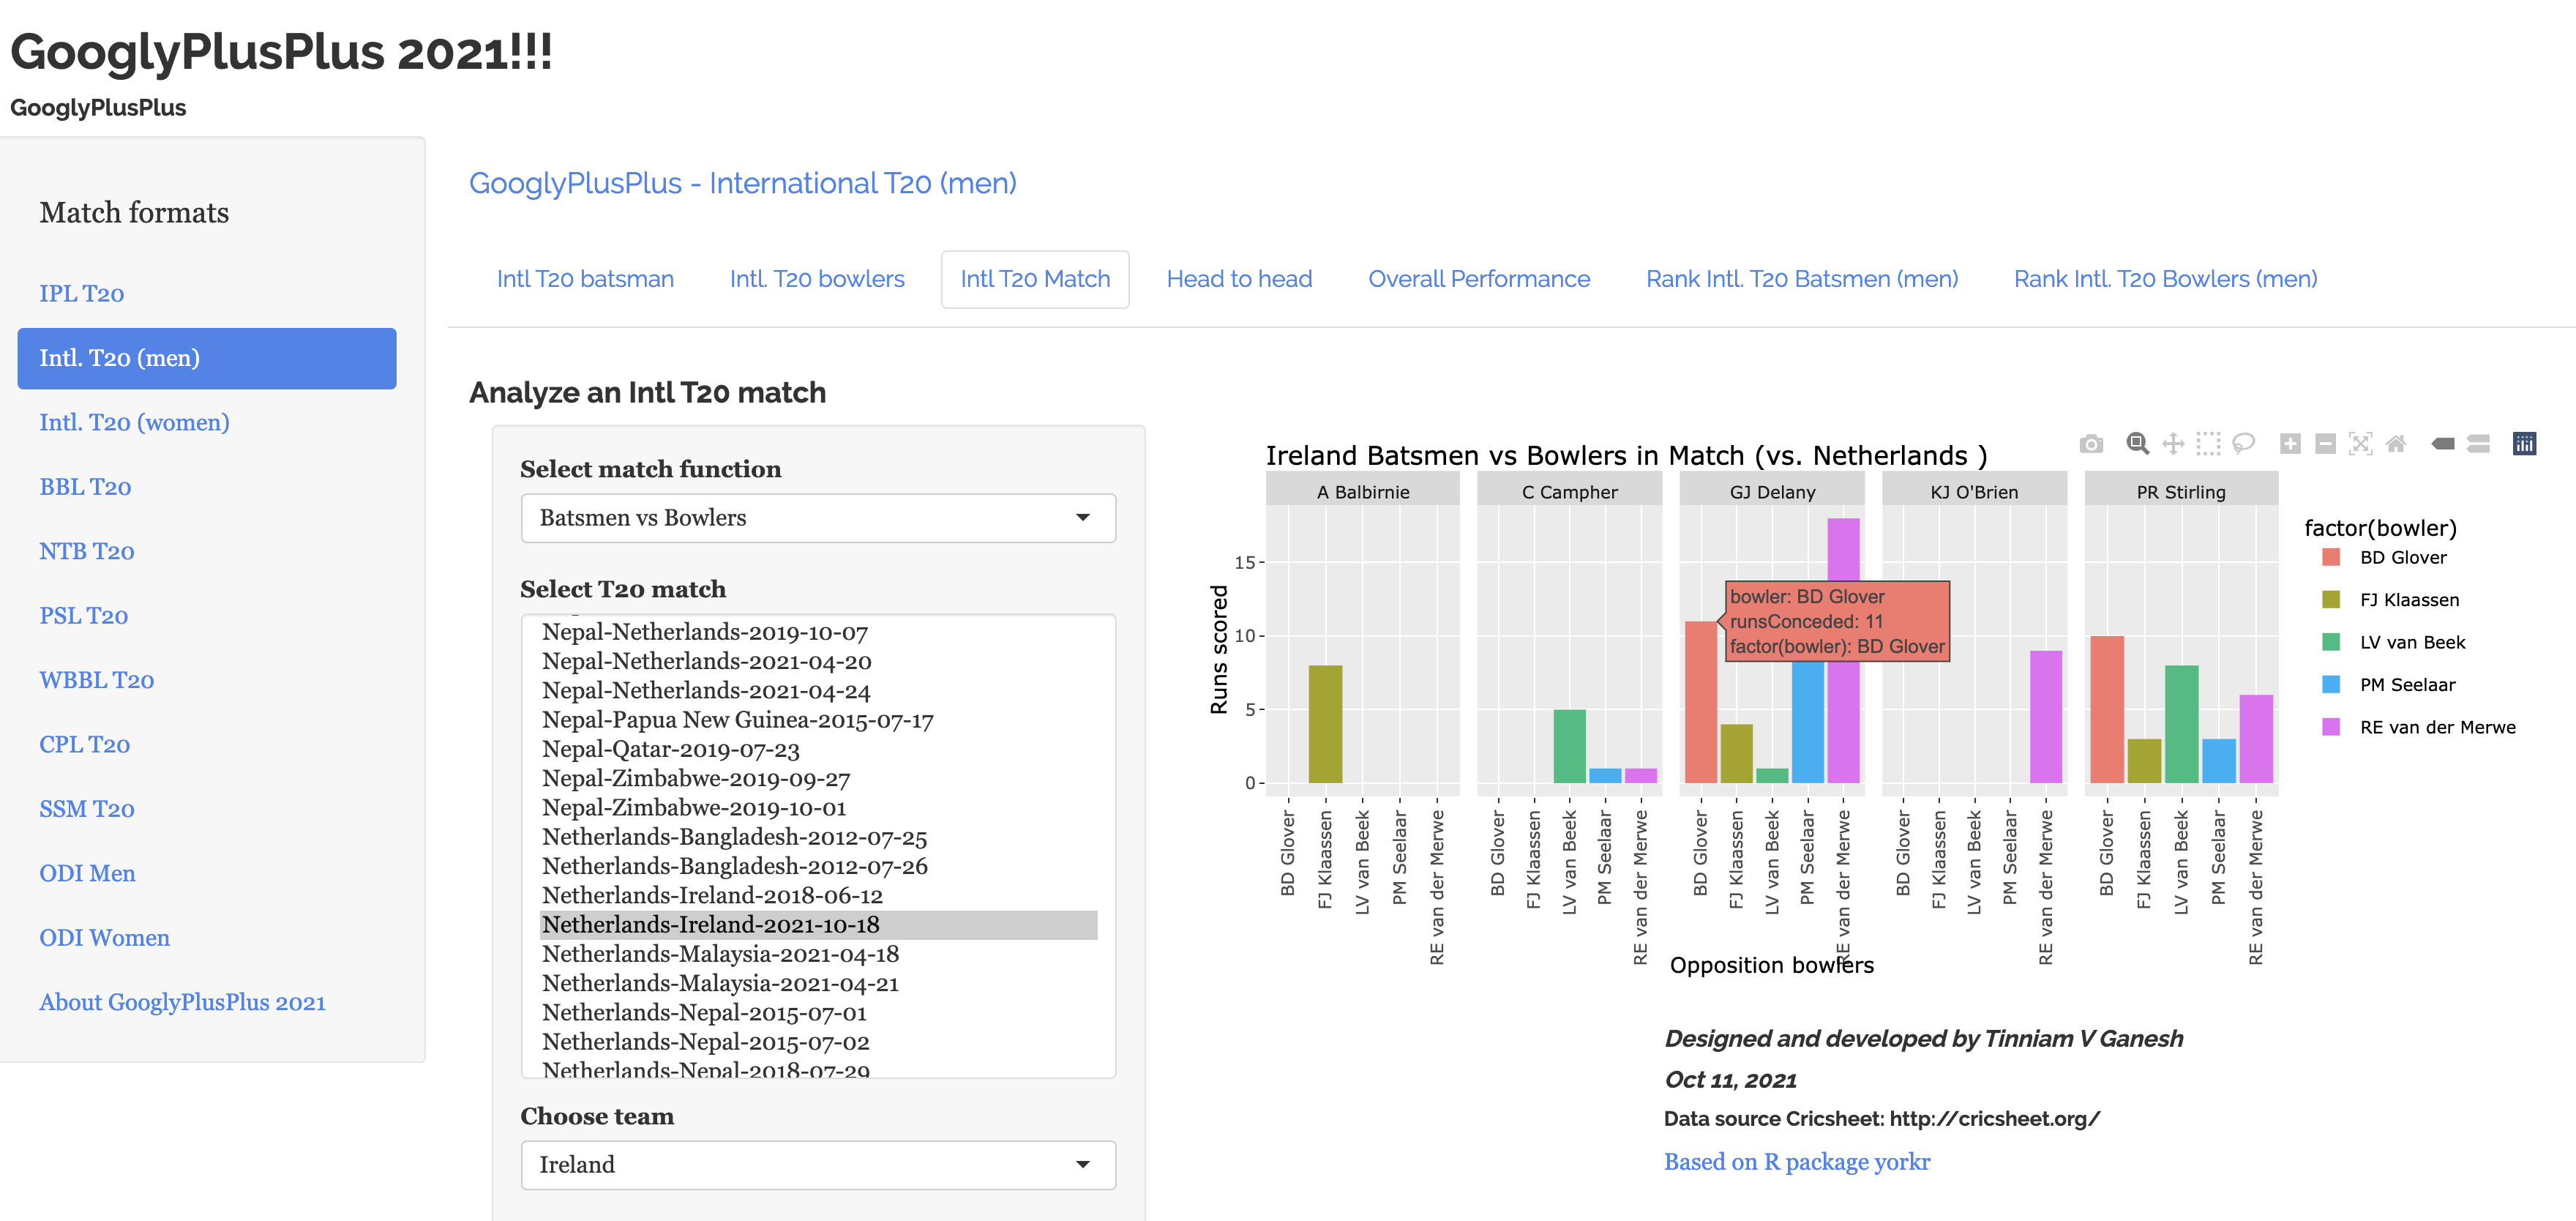
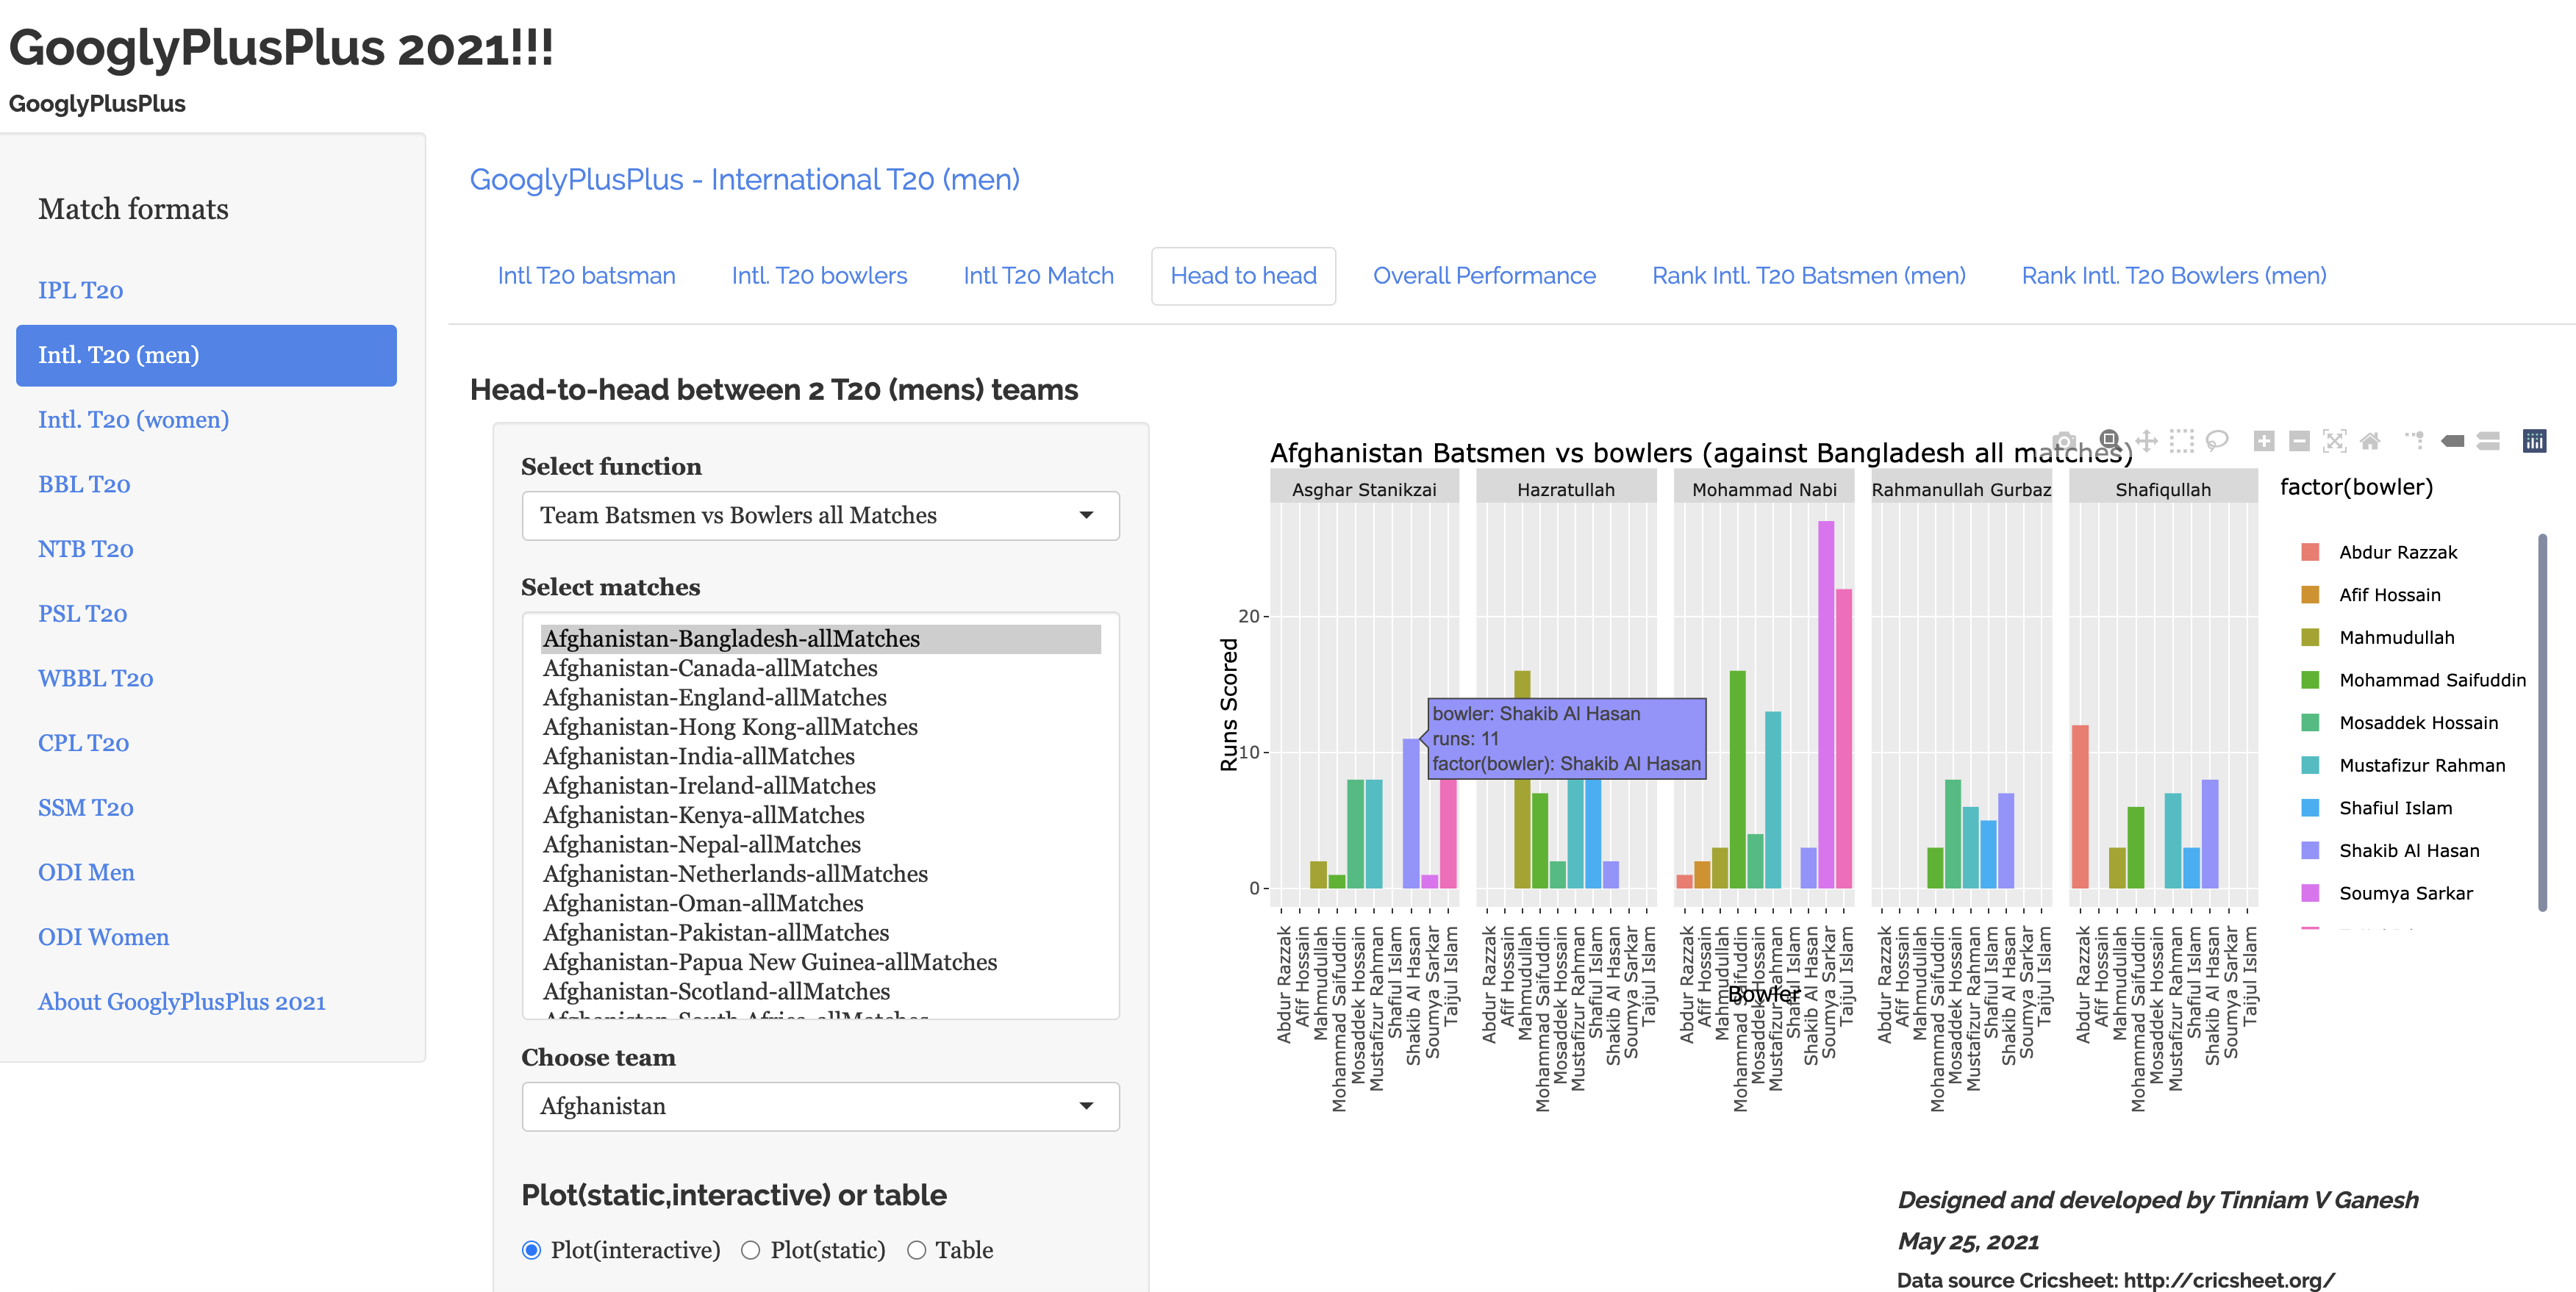
g) Head-to-head – Team batsmen vs bowlers (Bangladesh batsmen against Afghanistan bowlers) Intl. T20 (men)
Batting performance of Shakib-al-Hasan (Bangladesh) against Afghanistan bowlers in Intl. T20 (men)
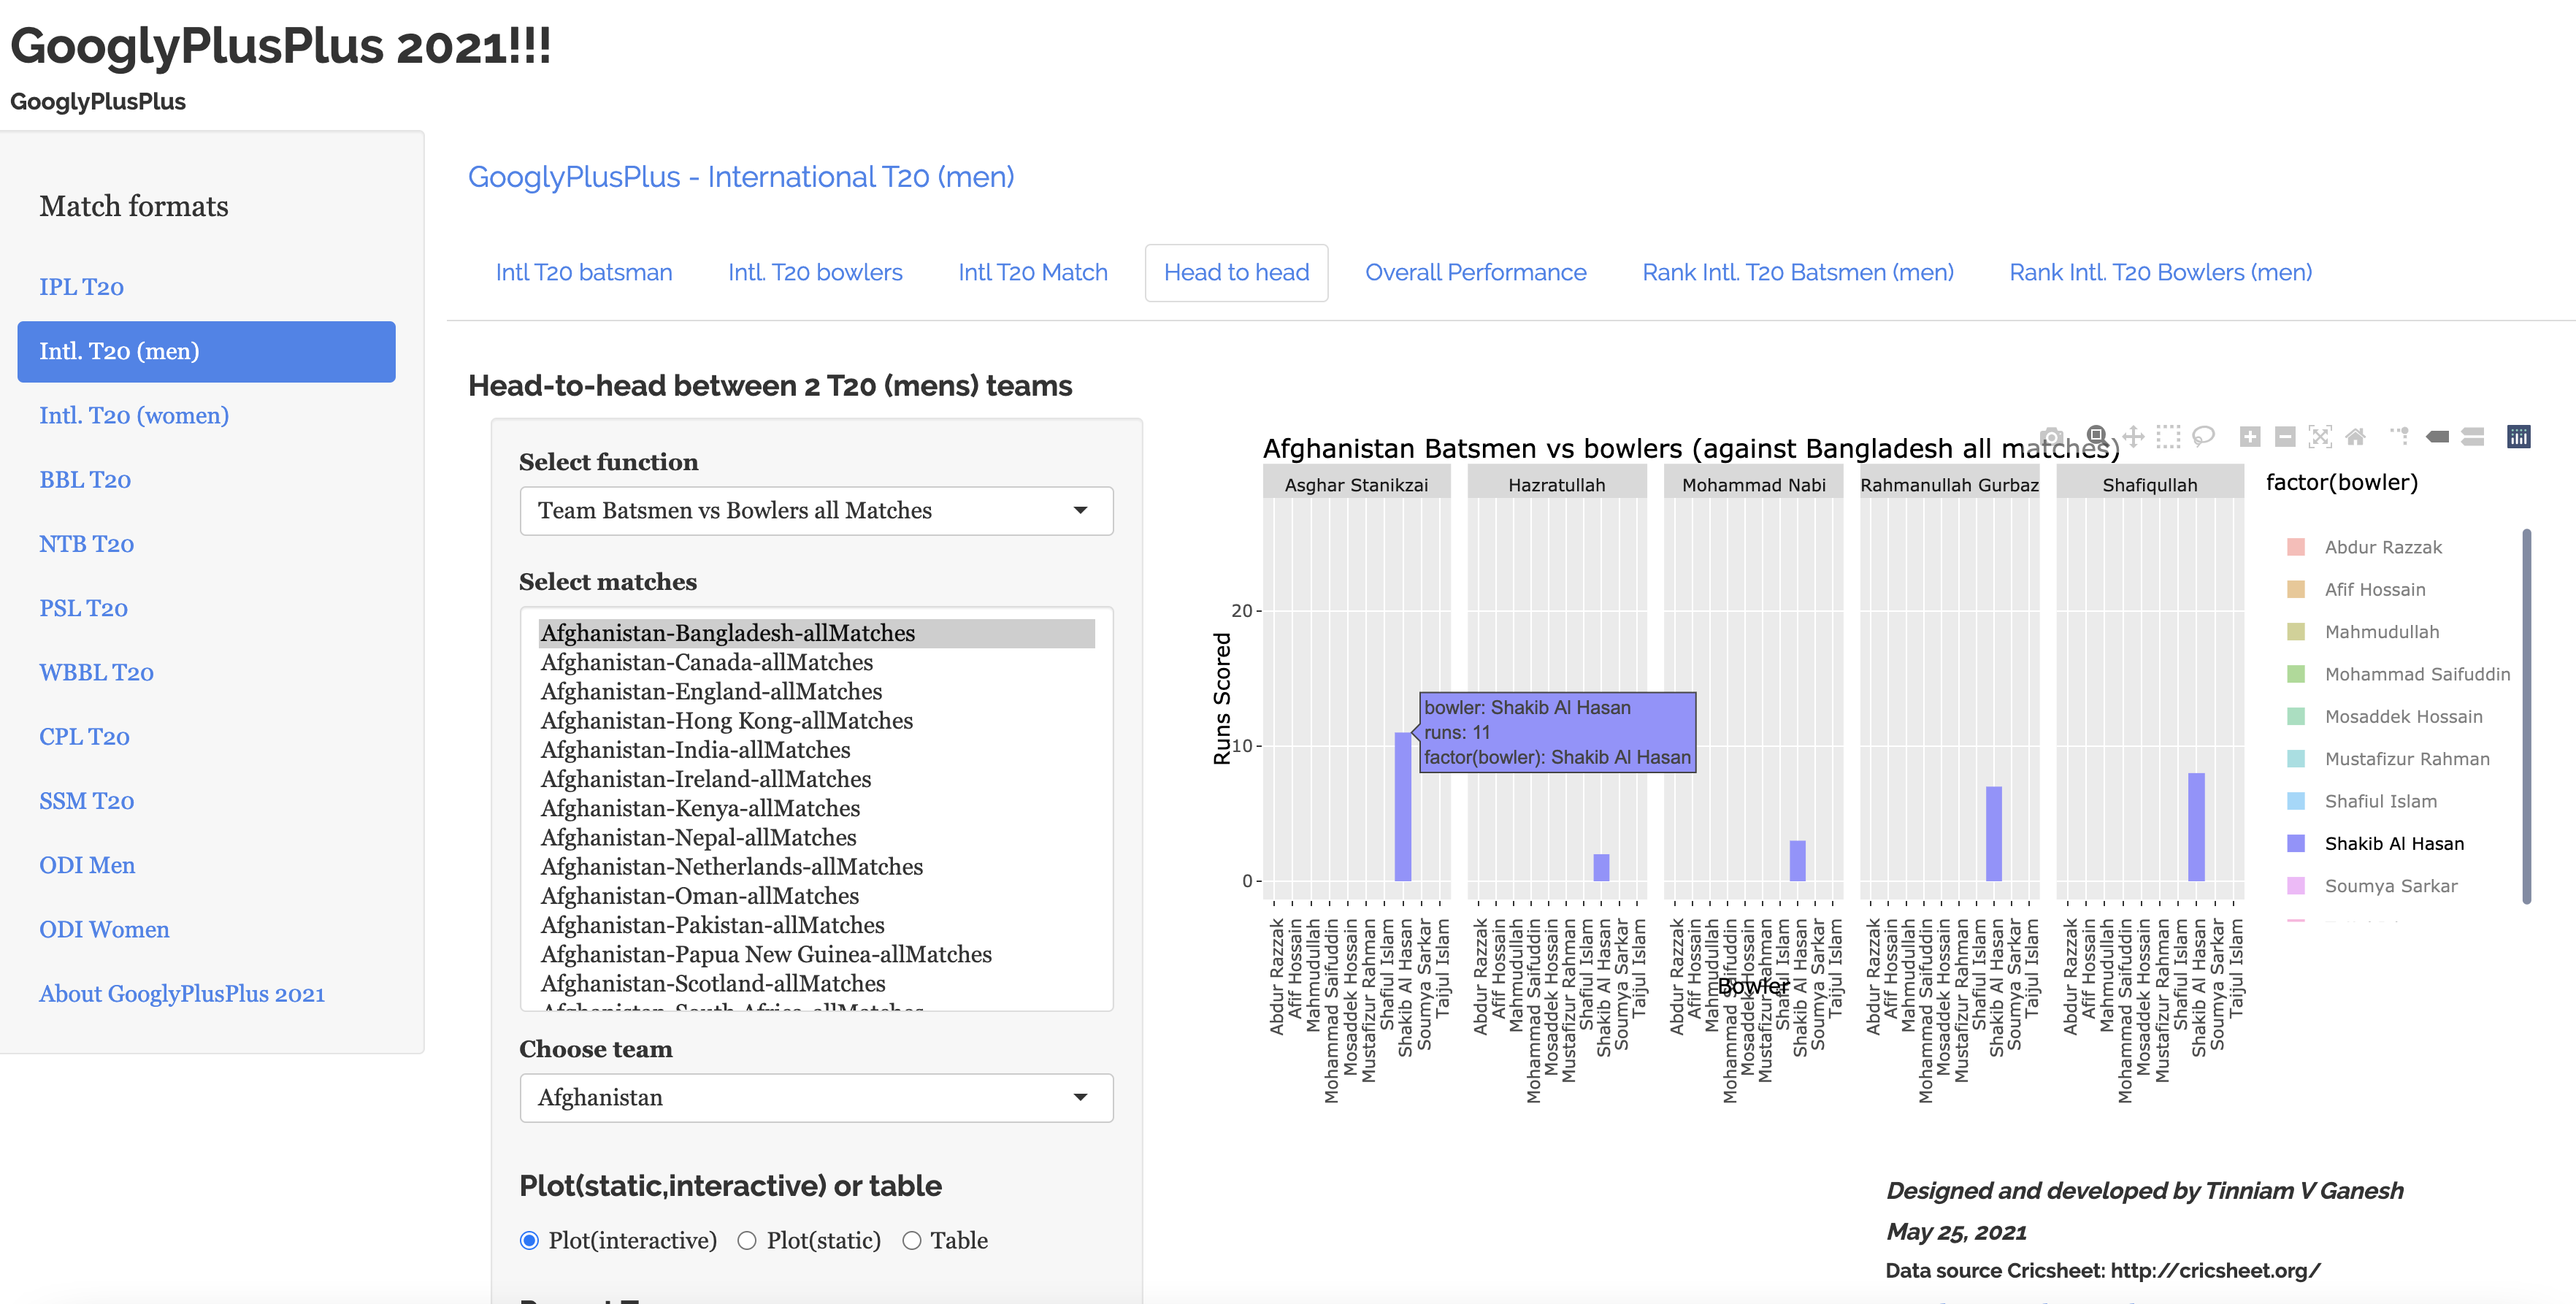
h) Head-to-head – Team batsmen vs bowlers (Bangladesh batsmen against Afghanistan bowlers) Intl. T20 (men) –Filter
Double click on Shakib-al-Hasan on the legend to get the performance of Shakib-al-Hasan against Afghanistan bowlers
Avoiding the clutter
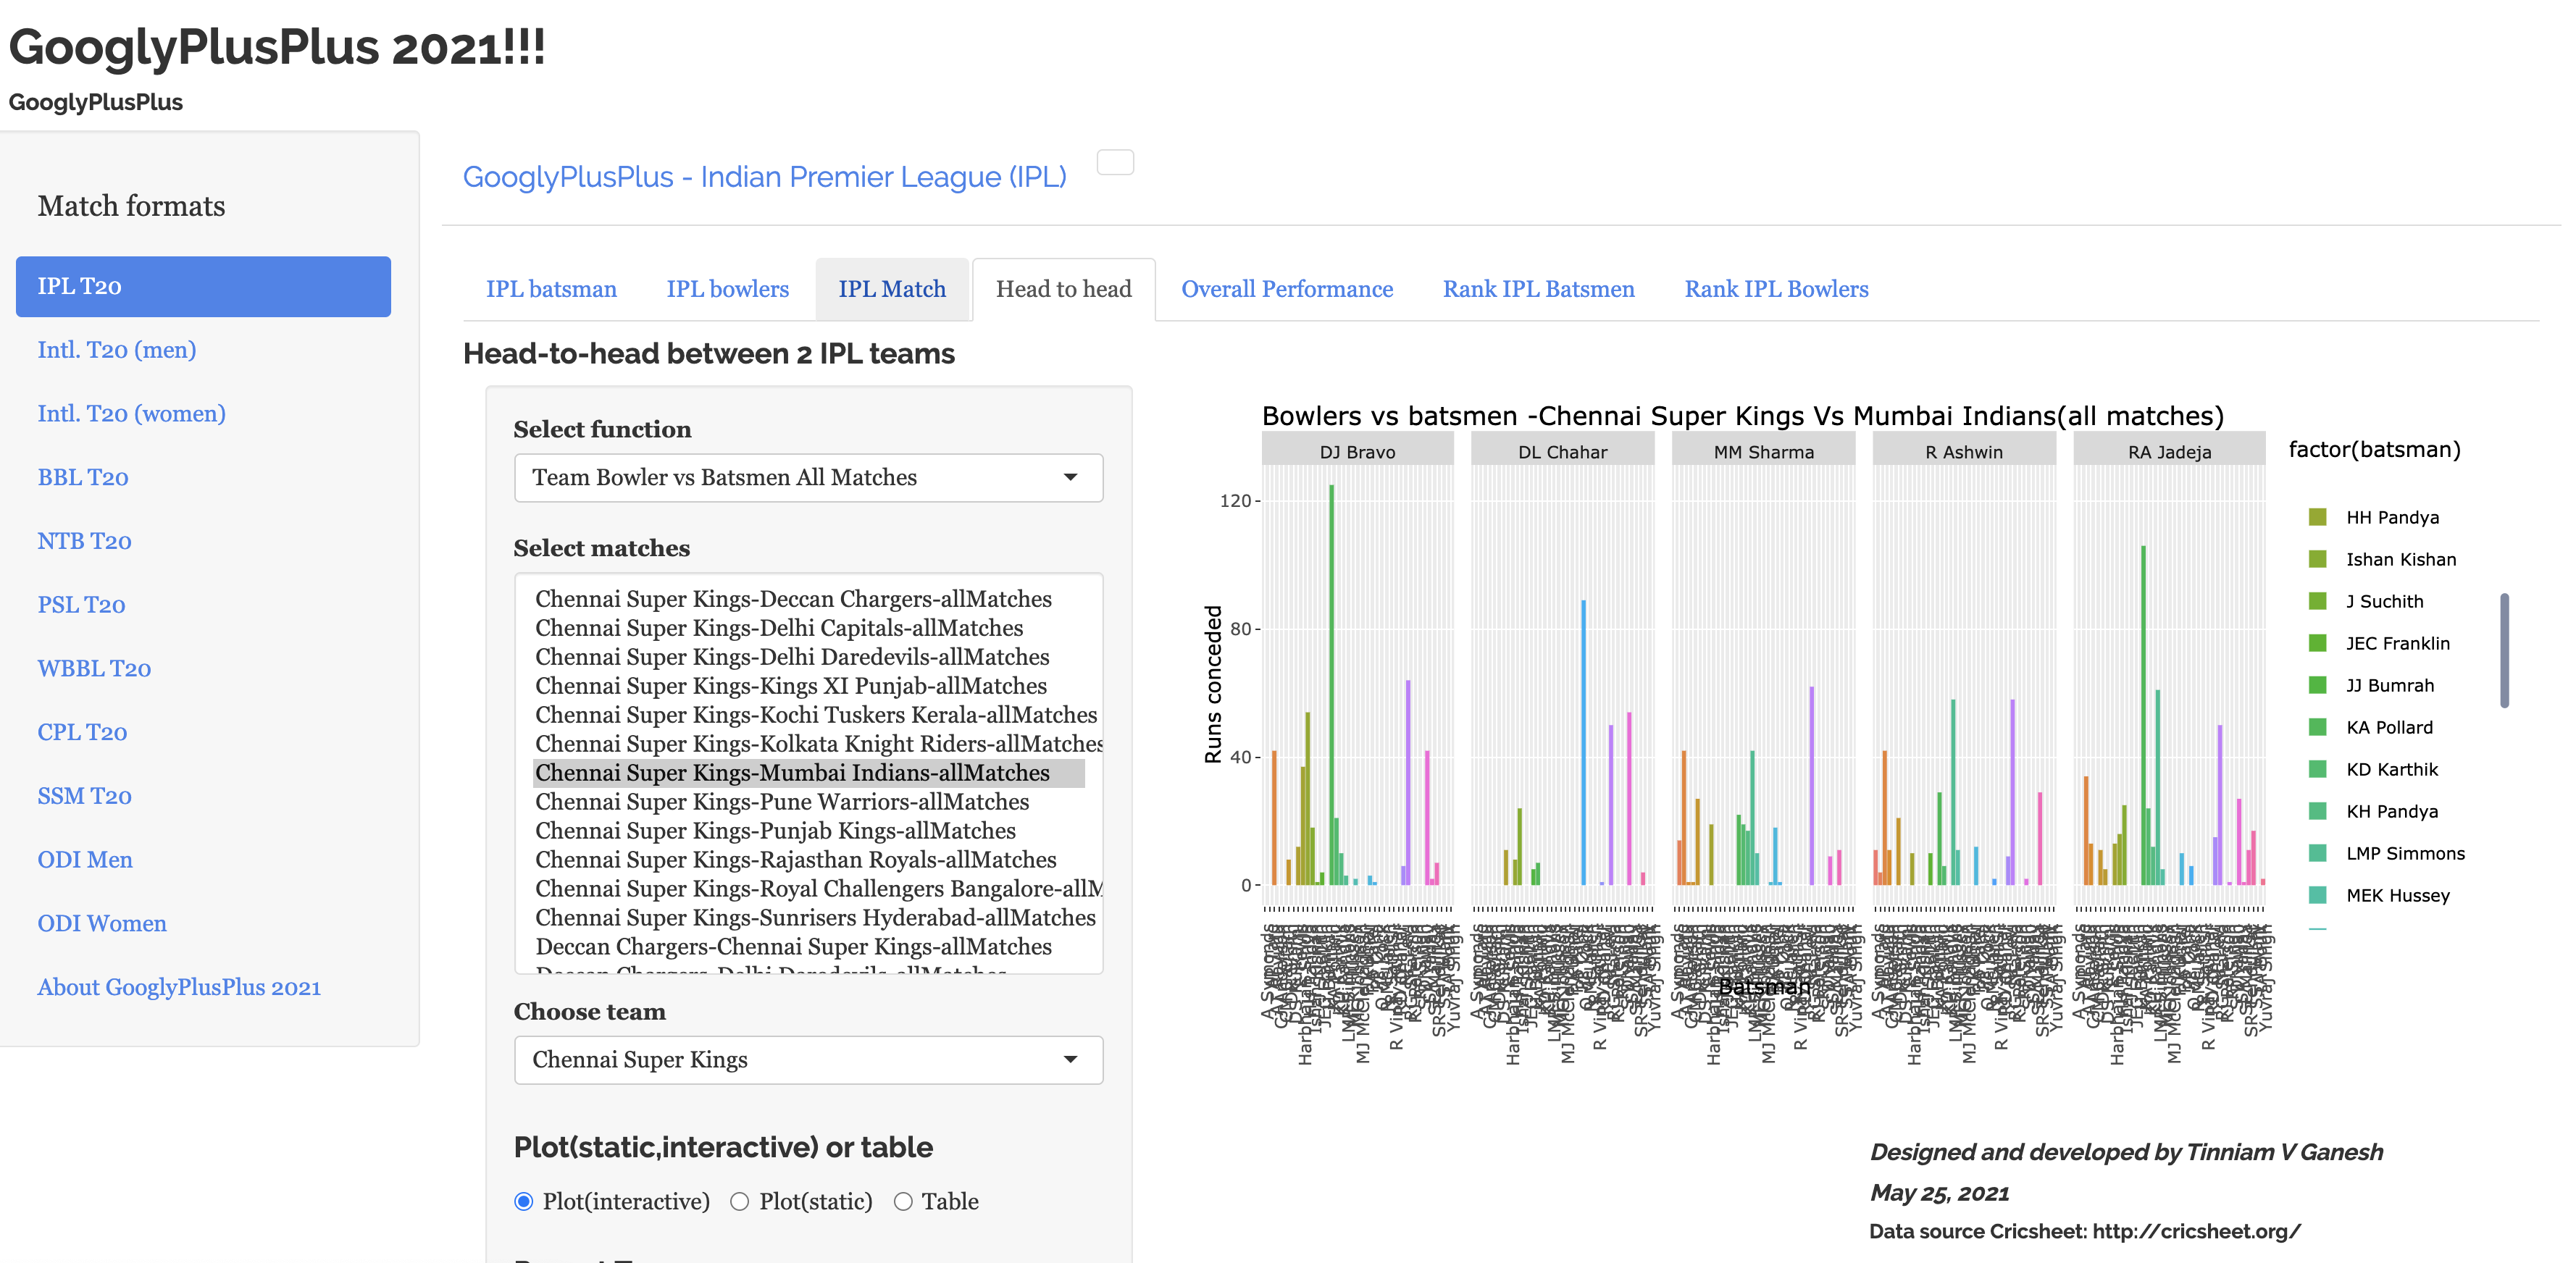
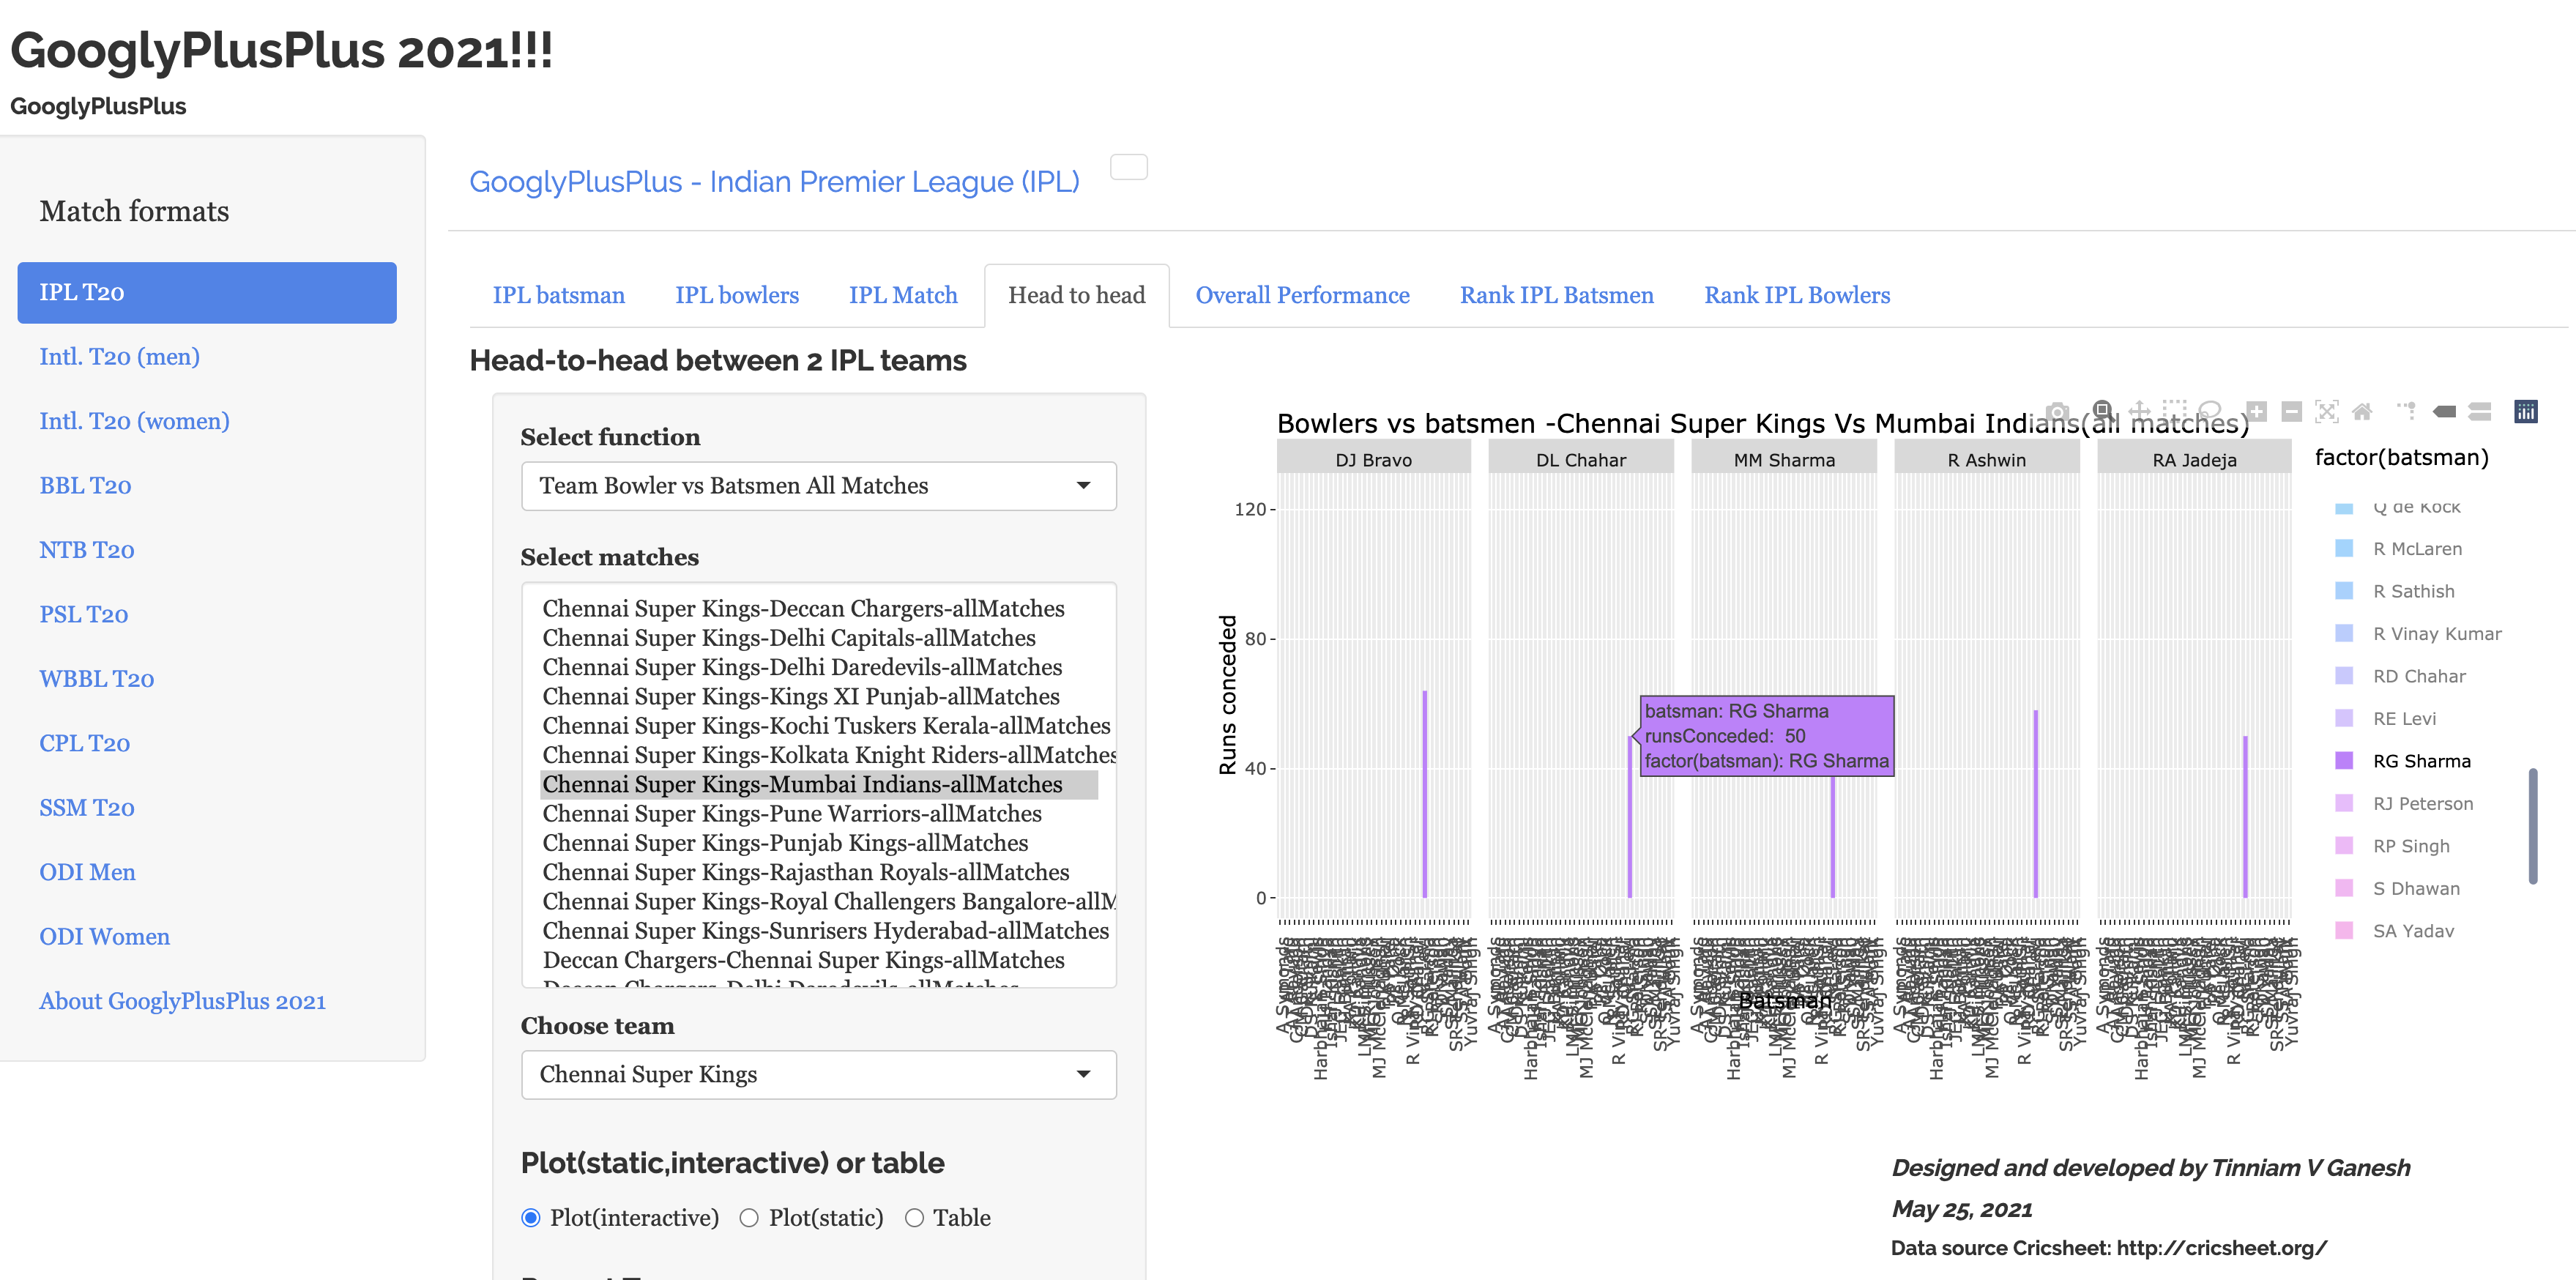
i) Head-to-head – Team bowler vs batsmen (Chennai Super Kings bowlers vs Mumbai Indians batsmen) – IPL
If you choose the above option the resulting plot is very crowded as shown below
To get the performance of Mumbai Indian (MI) batsmen (Rohit Sharma & Kieron Pollard) against Chennai Super Kings (CSK) bowlers in all matches do as told below
Steps to avoid clutter in stacked bar plots
1) This can be avoided by selectively choosing to filter out the batsmen we are interested in. say RG Sharma and Kieron Pollard. Then double-ciick RG Sharma, this is will bring up the chart with only RG Sharma as below
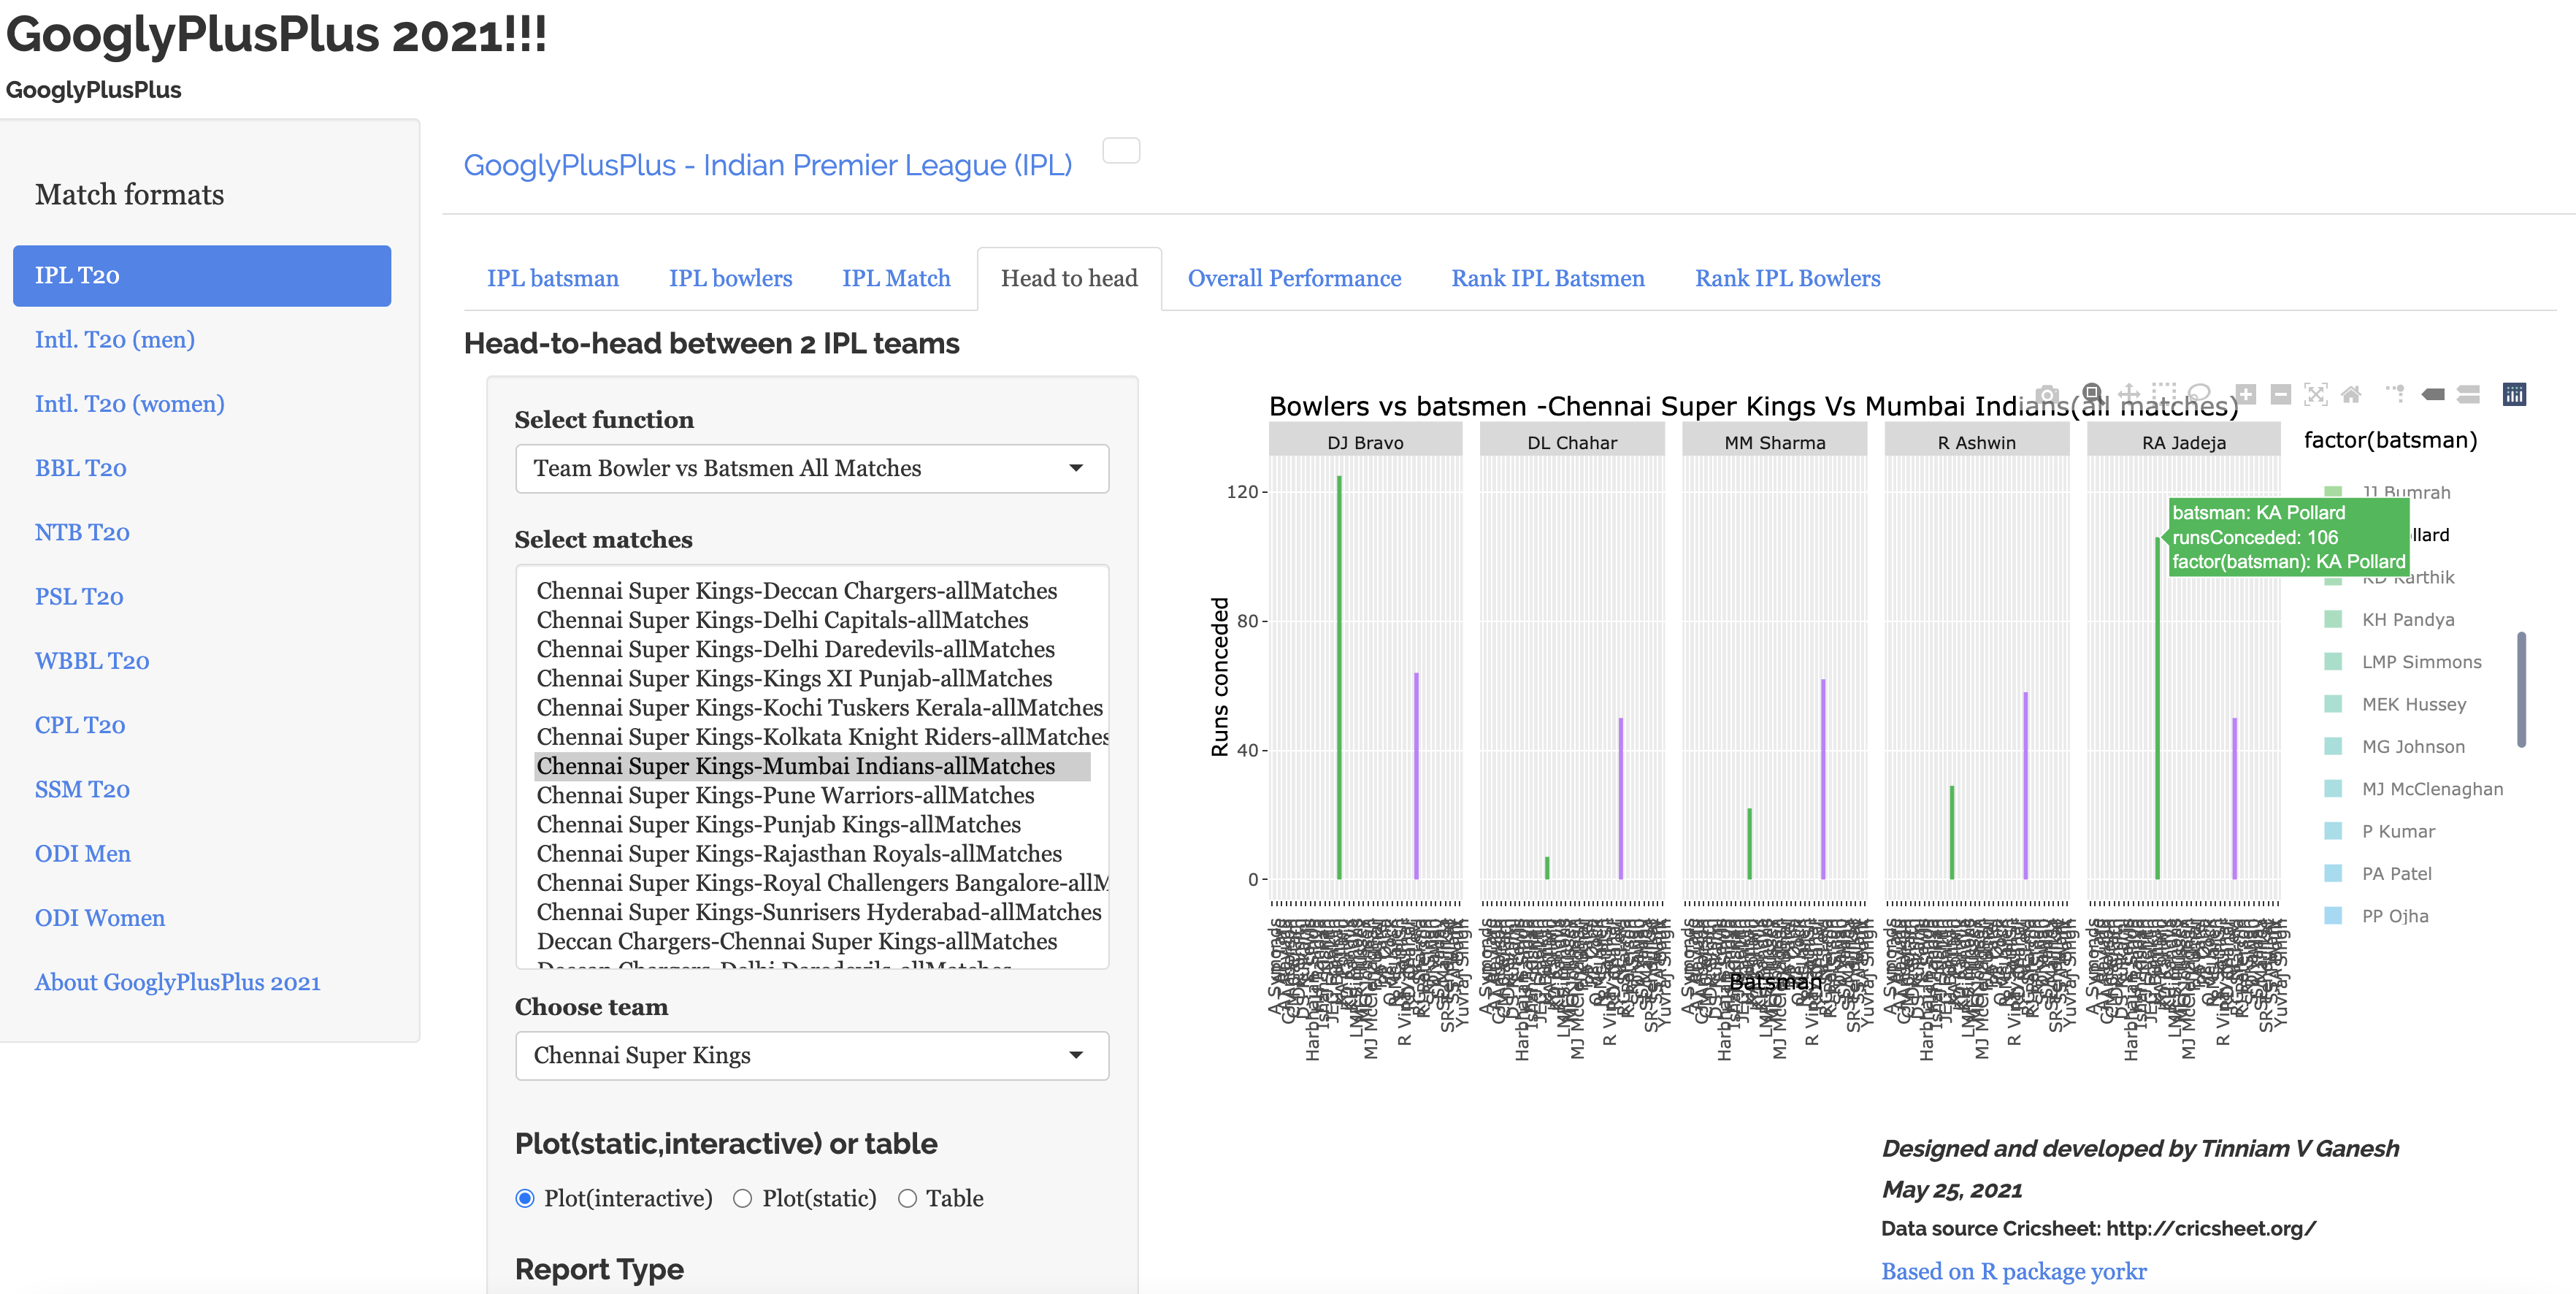
2) Now add additional batsmen you are interested in by single-clicking. In the example below Kieron Pollard is added
You can continue to add additional players that you are interested by single clicking.
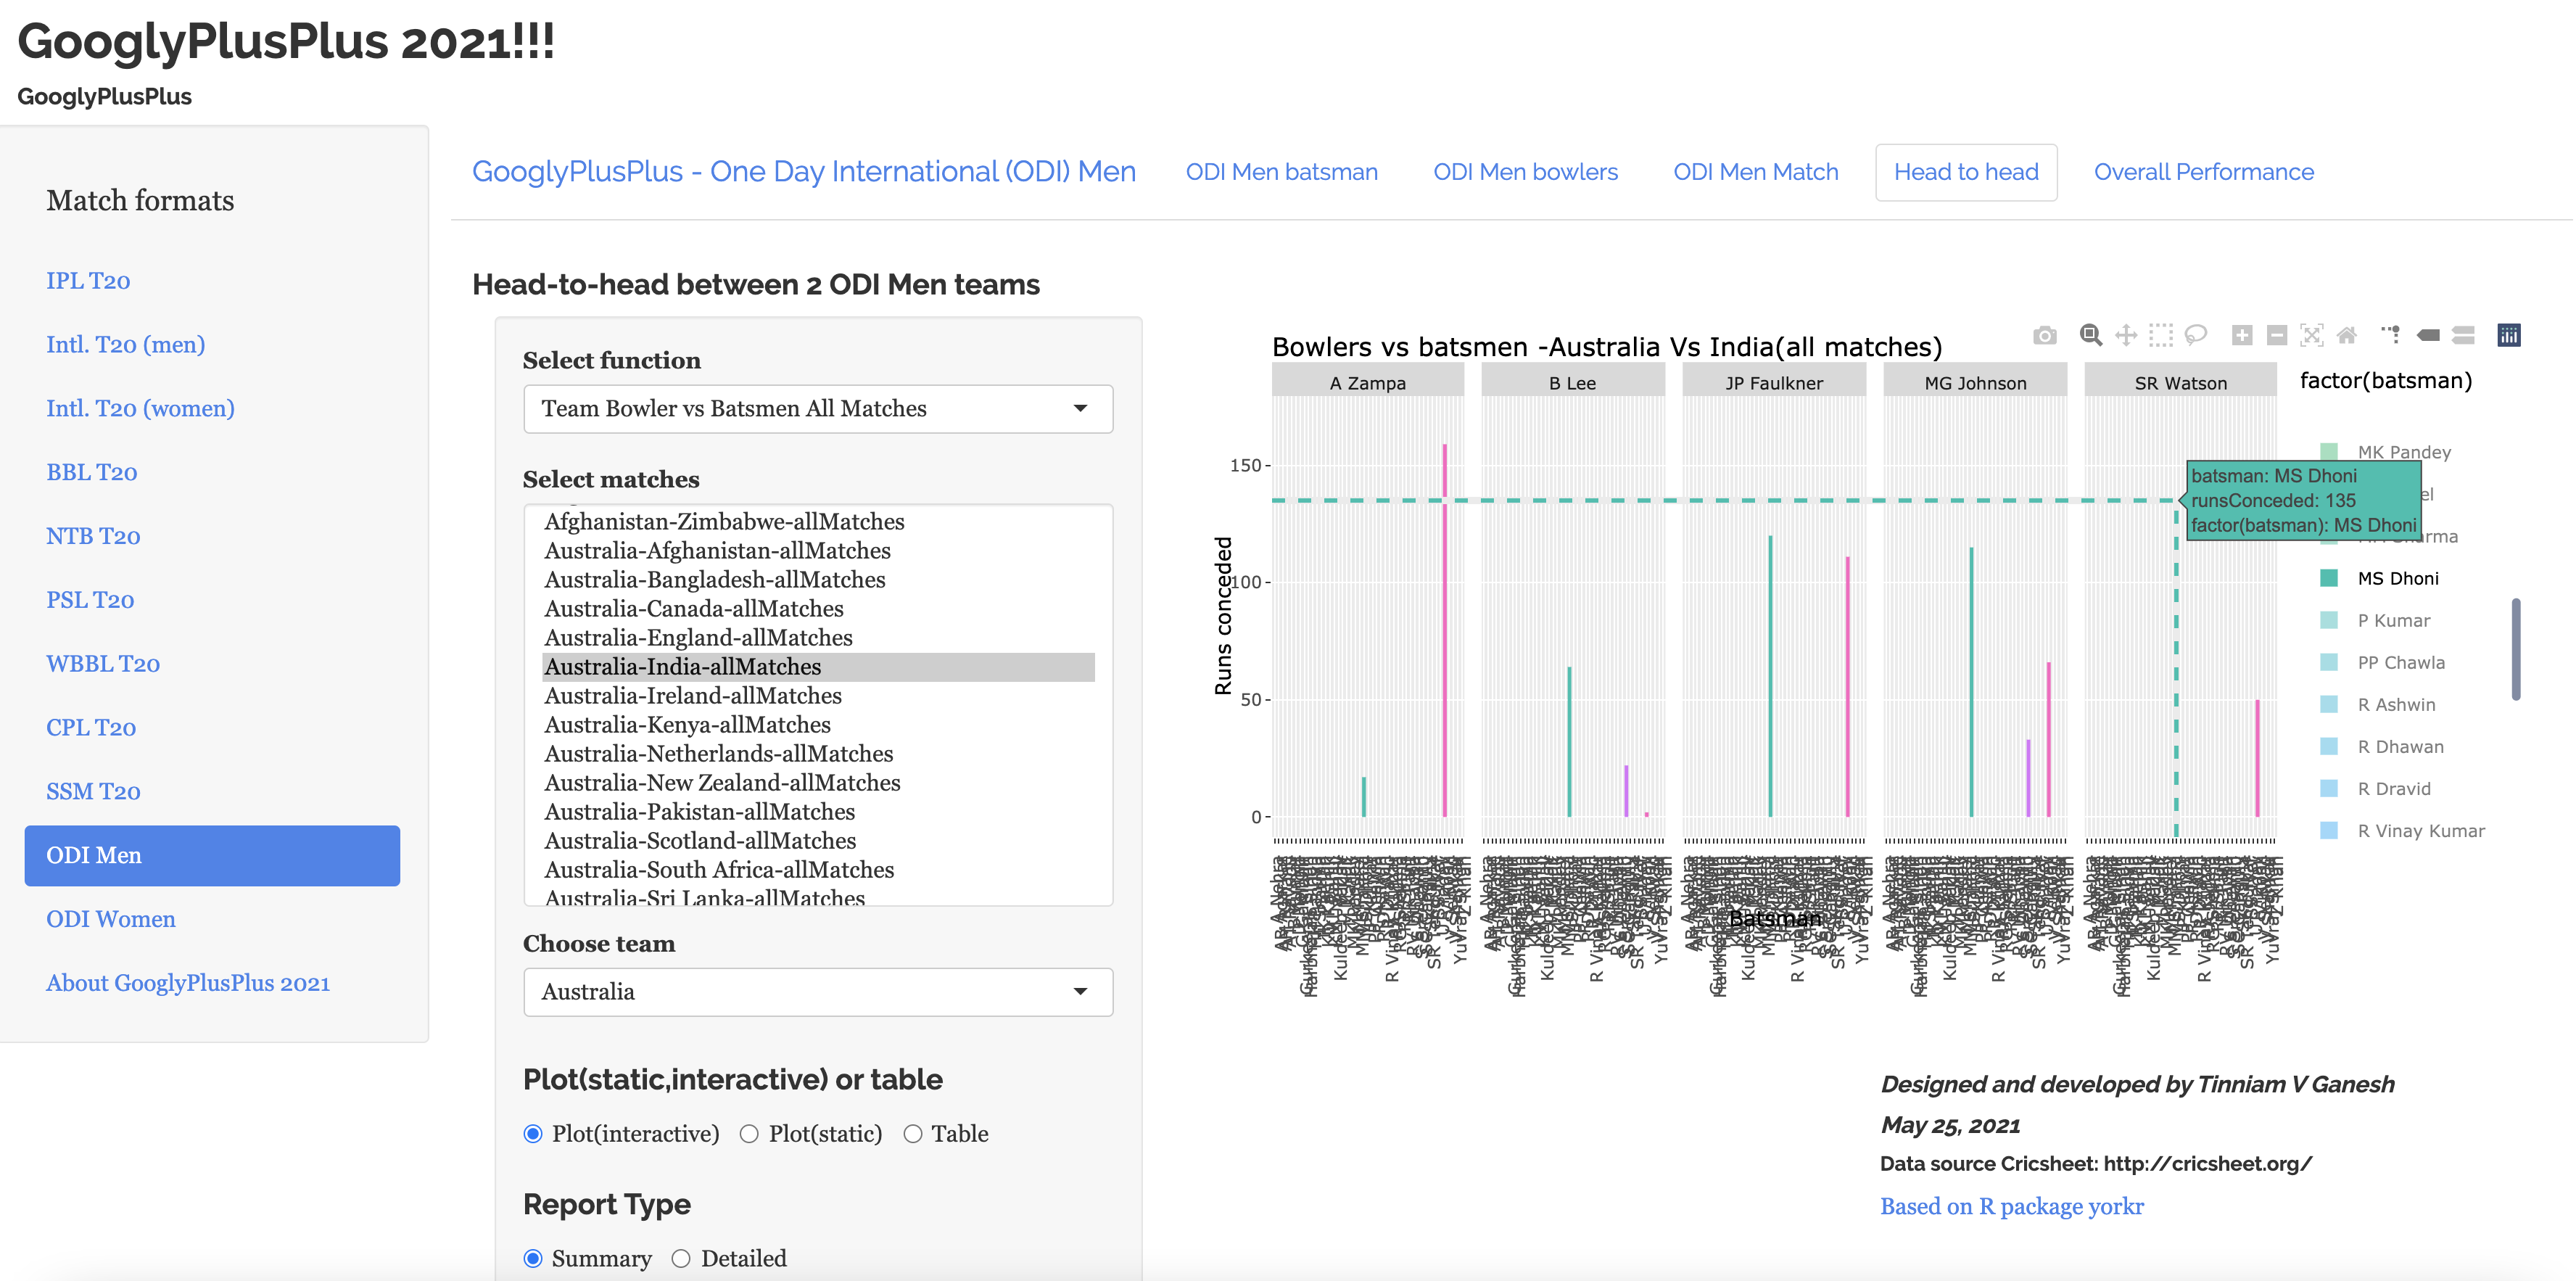
j) Head-to-head (Performance of Indian batsmen vs Australian bowlers)- ODI
In the plot V Kohli, MS Dhoni and SC Ganguly have been selected for their performance against Australian bowlers (use toggle spike lines)
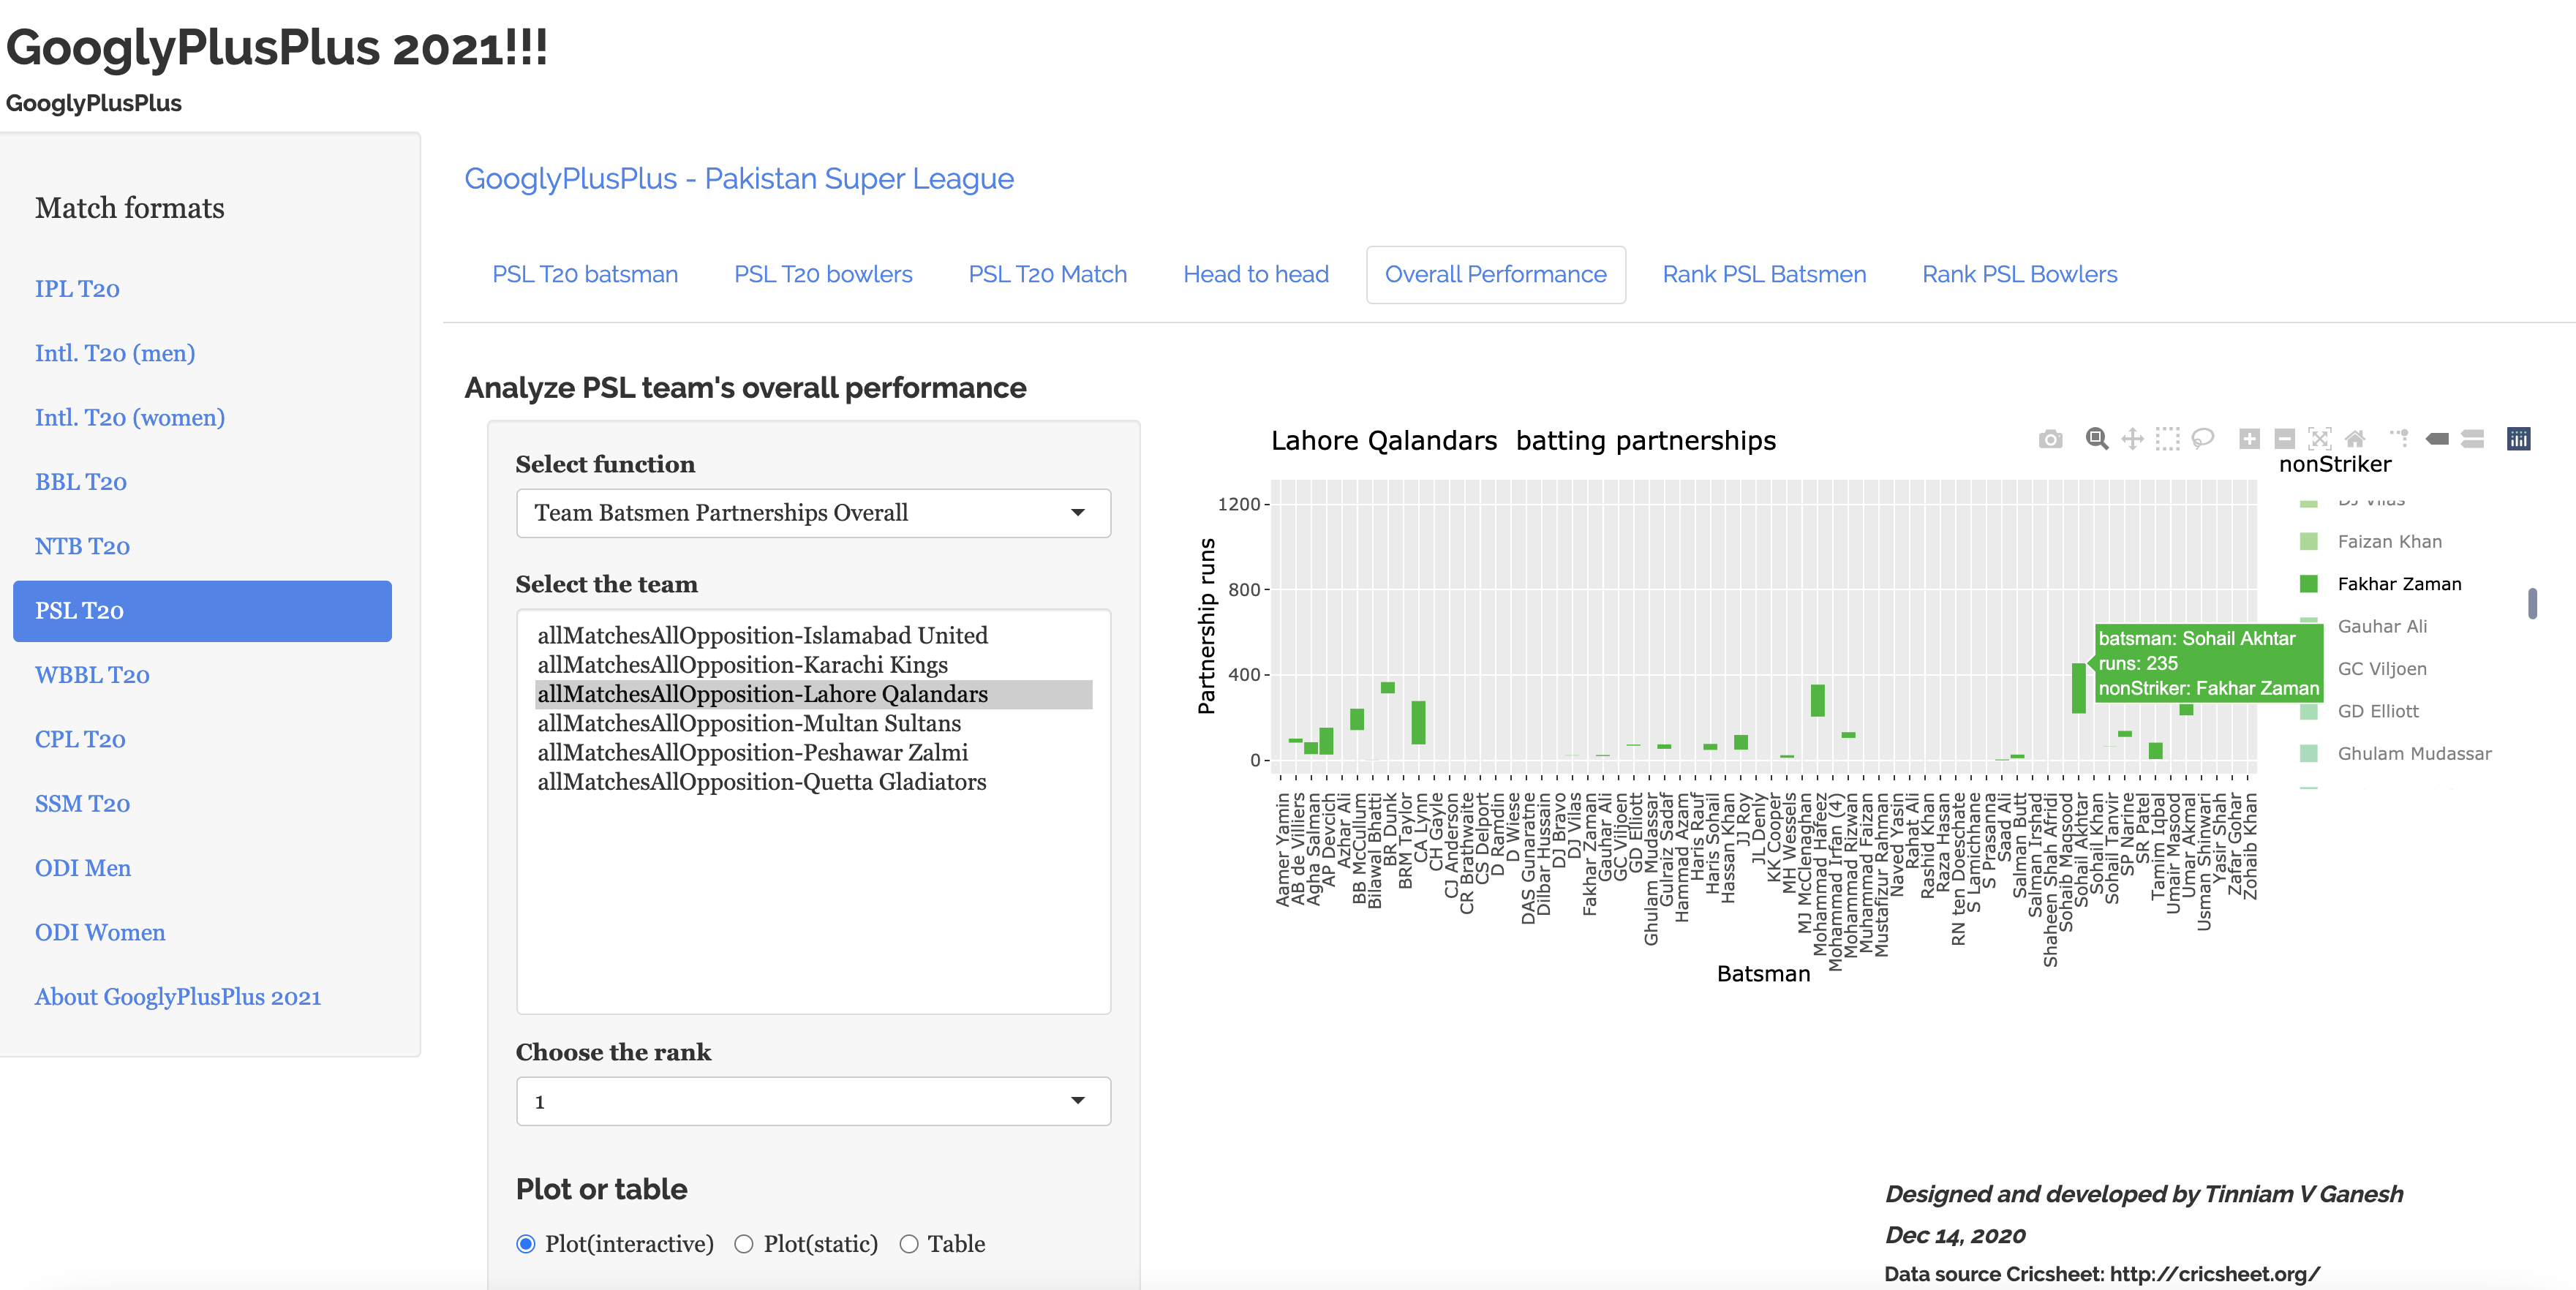
k) Overall Performance – PSL batting partnership against all teams (Fakhar Zaman)
The plot below shows Fakhar Zaman (Lahore Qalanders) partnerships with other teammates in all matches in PSL.
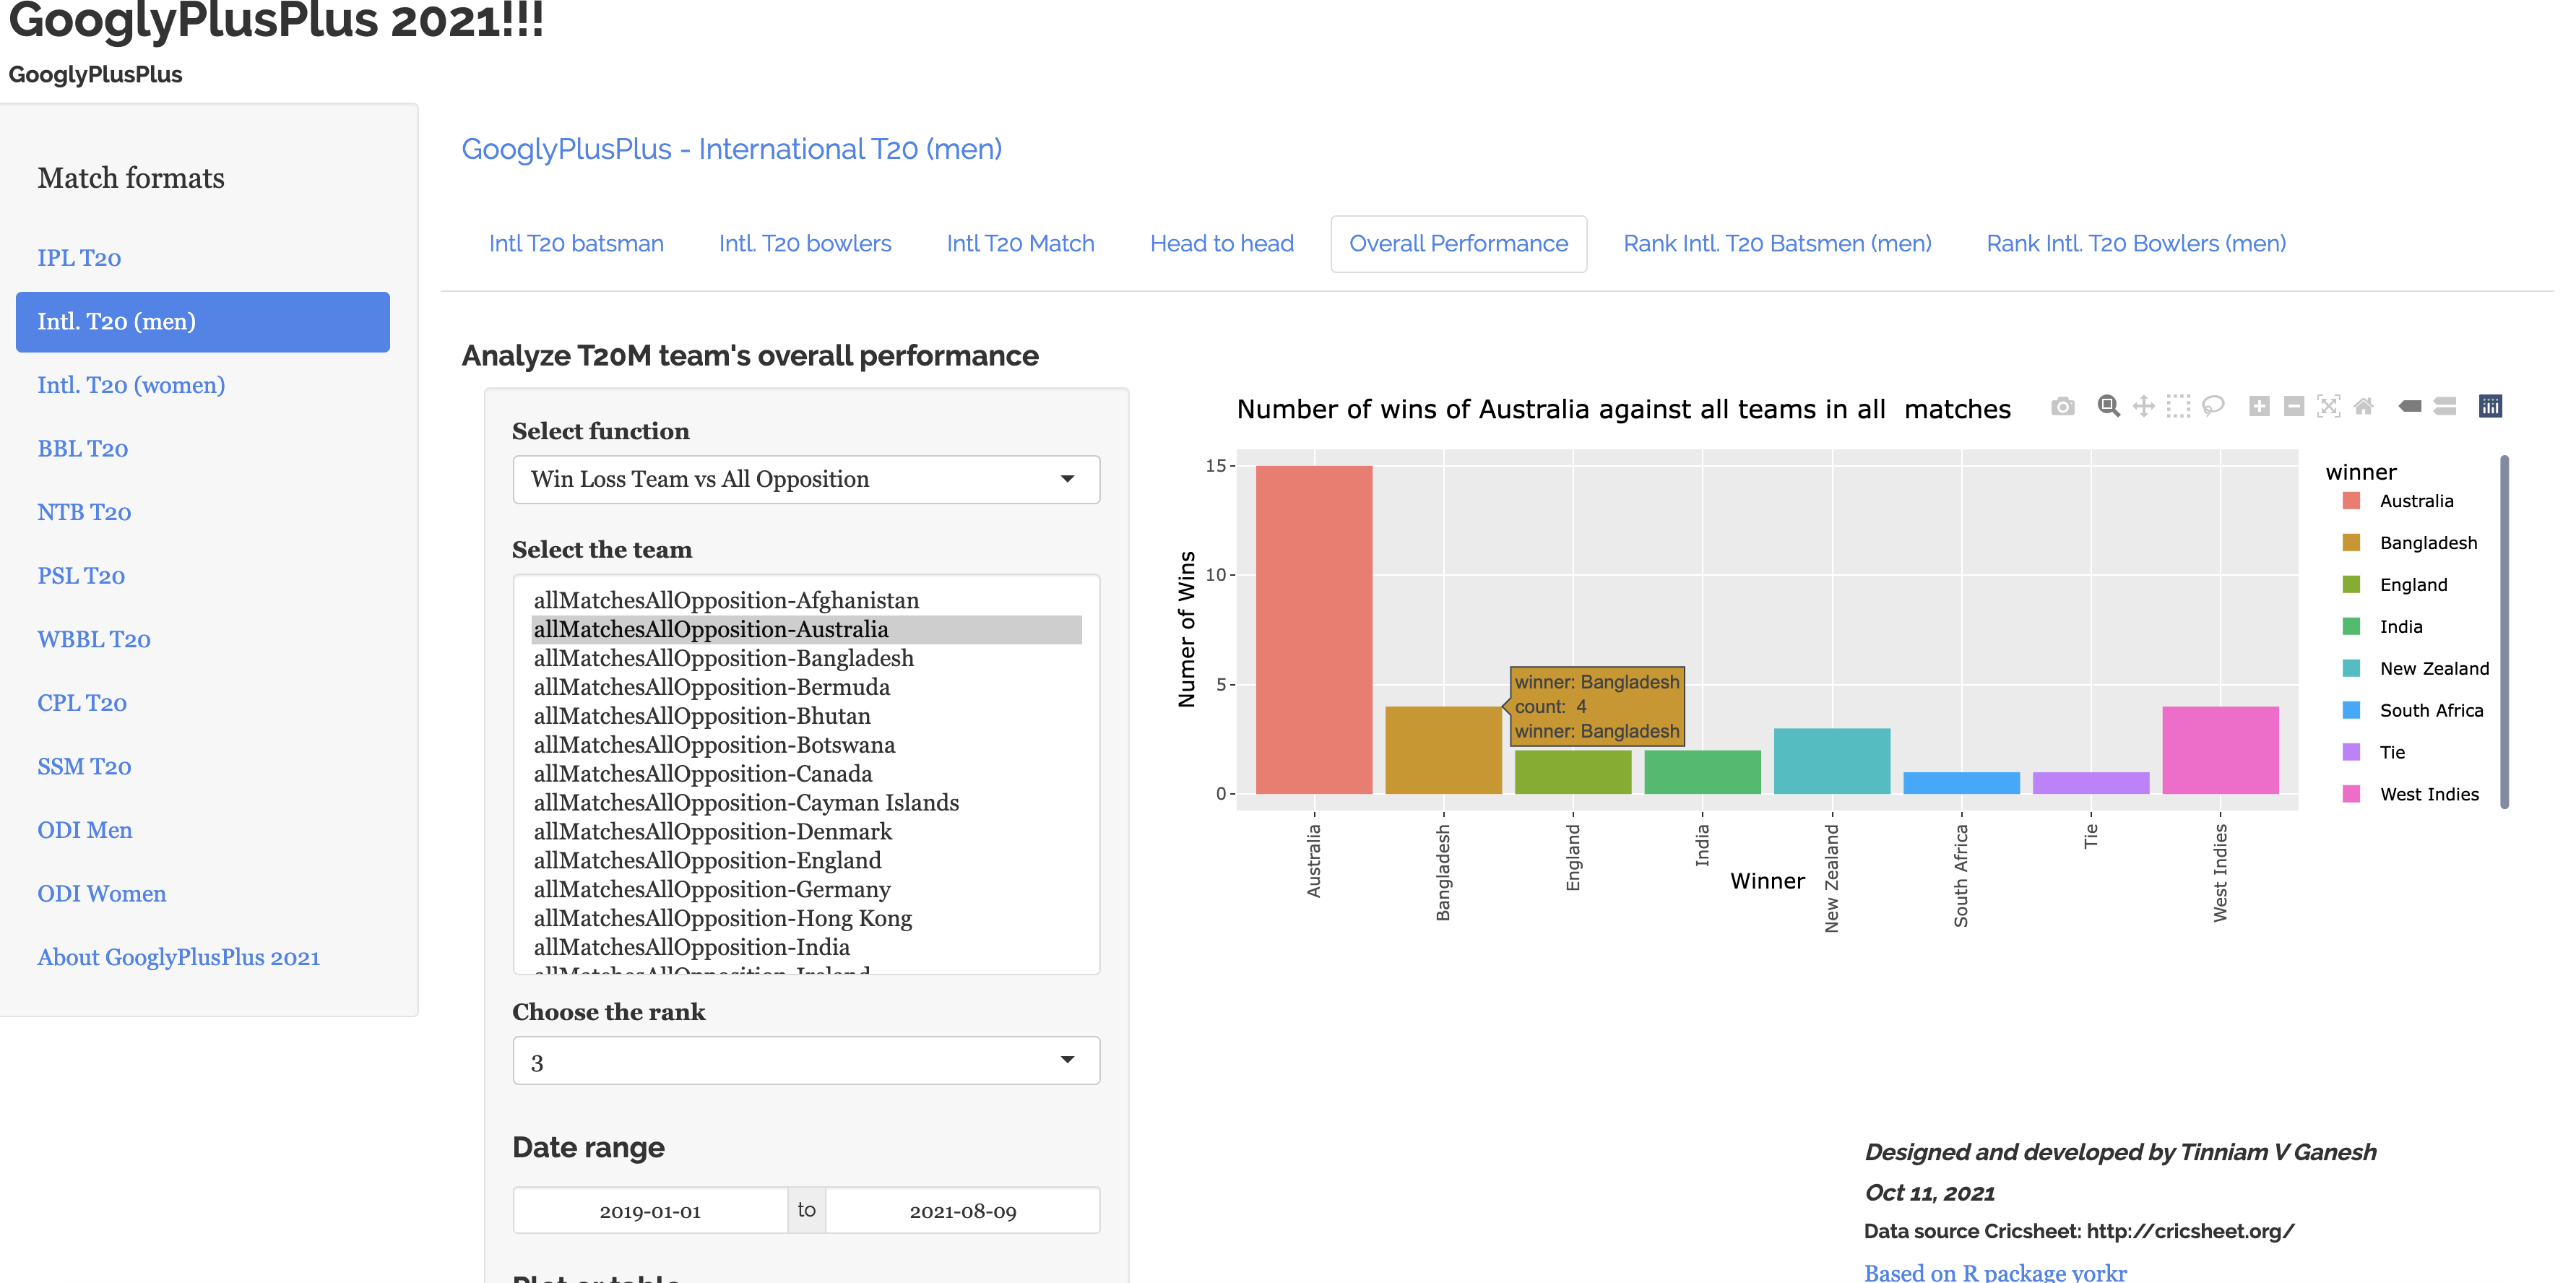
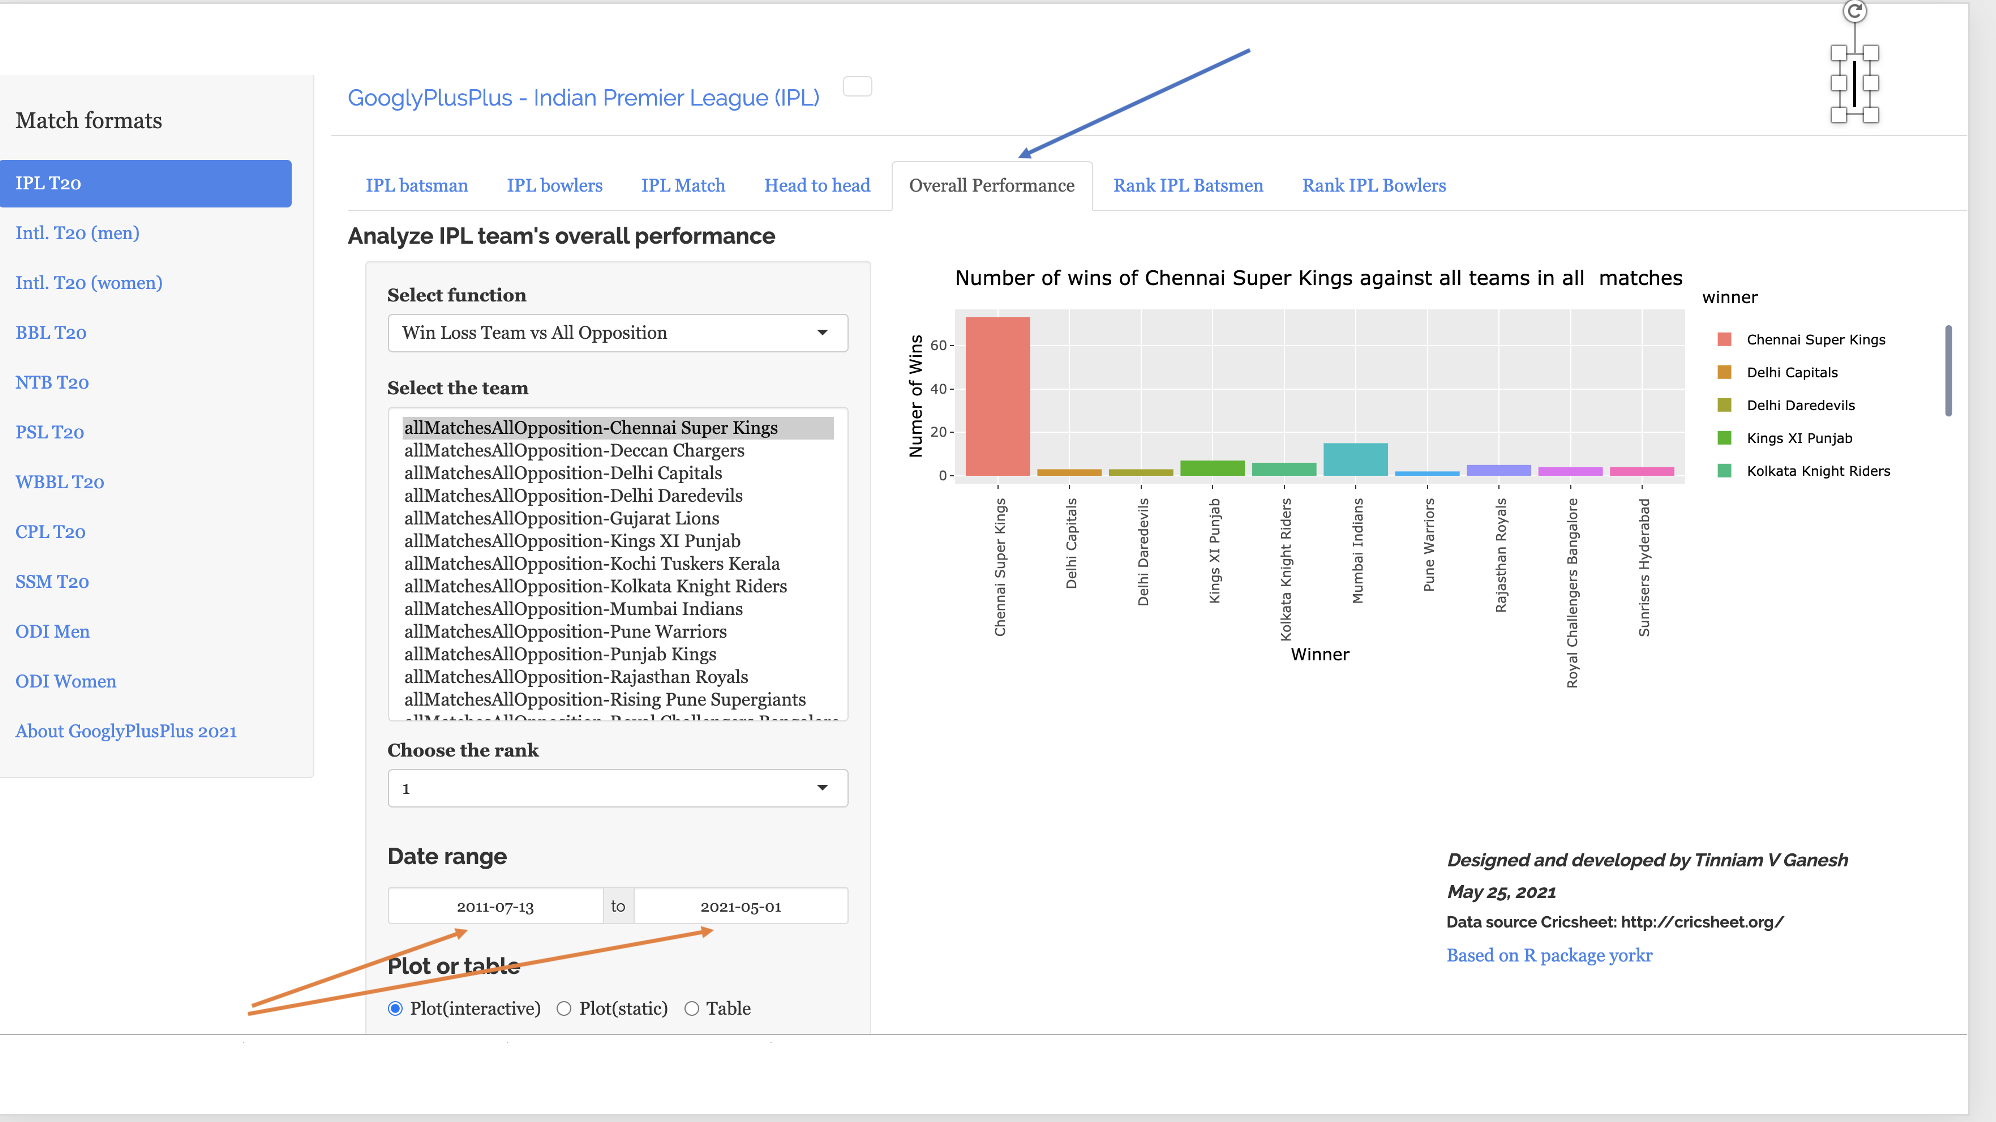
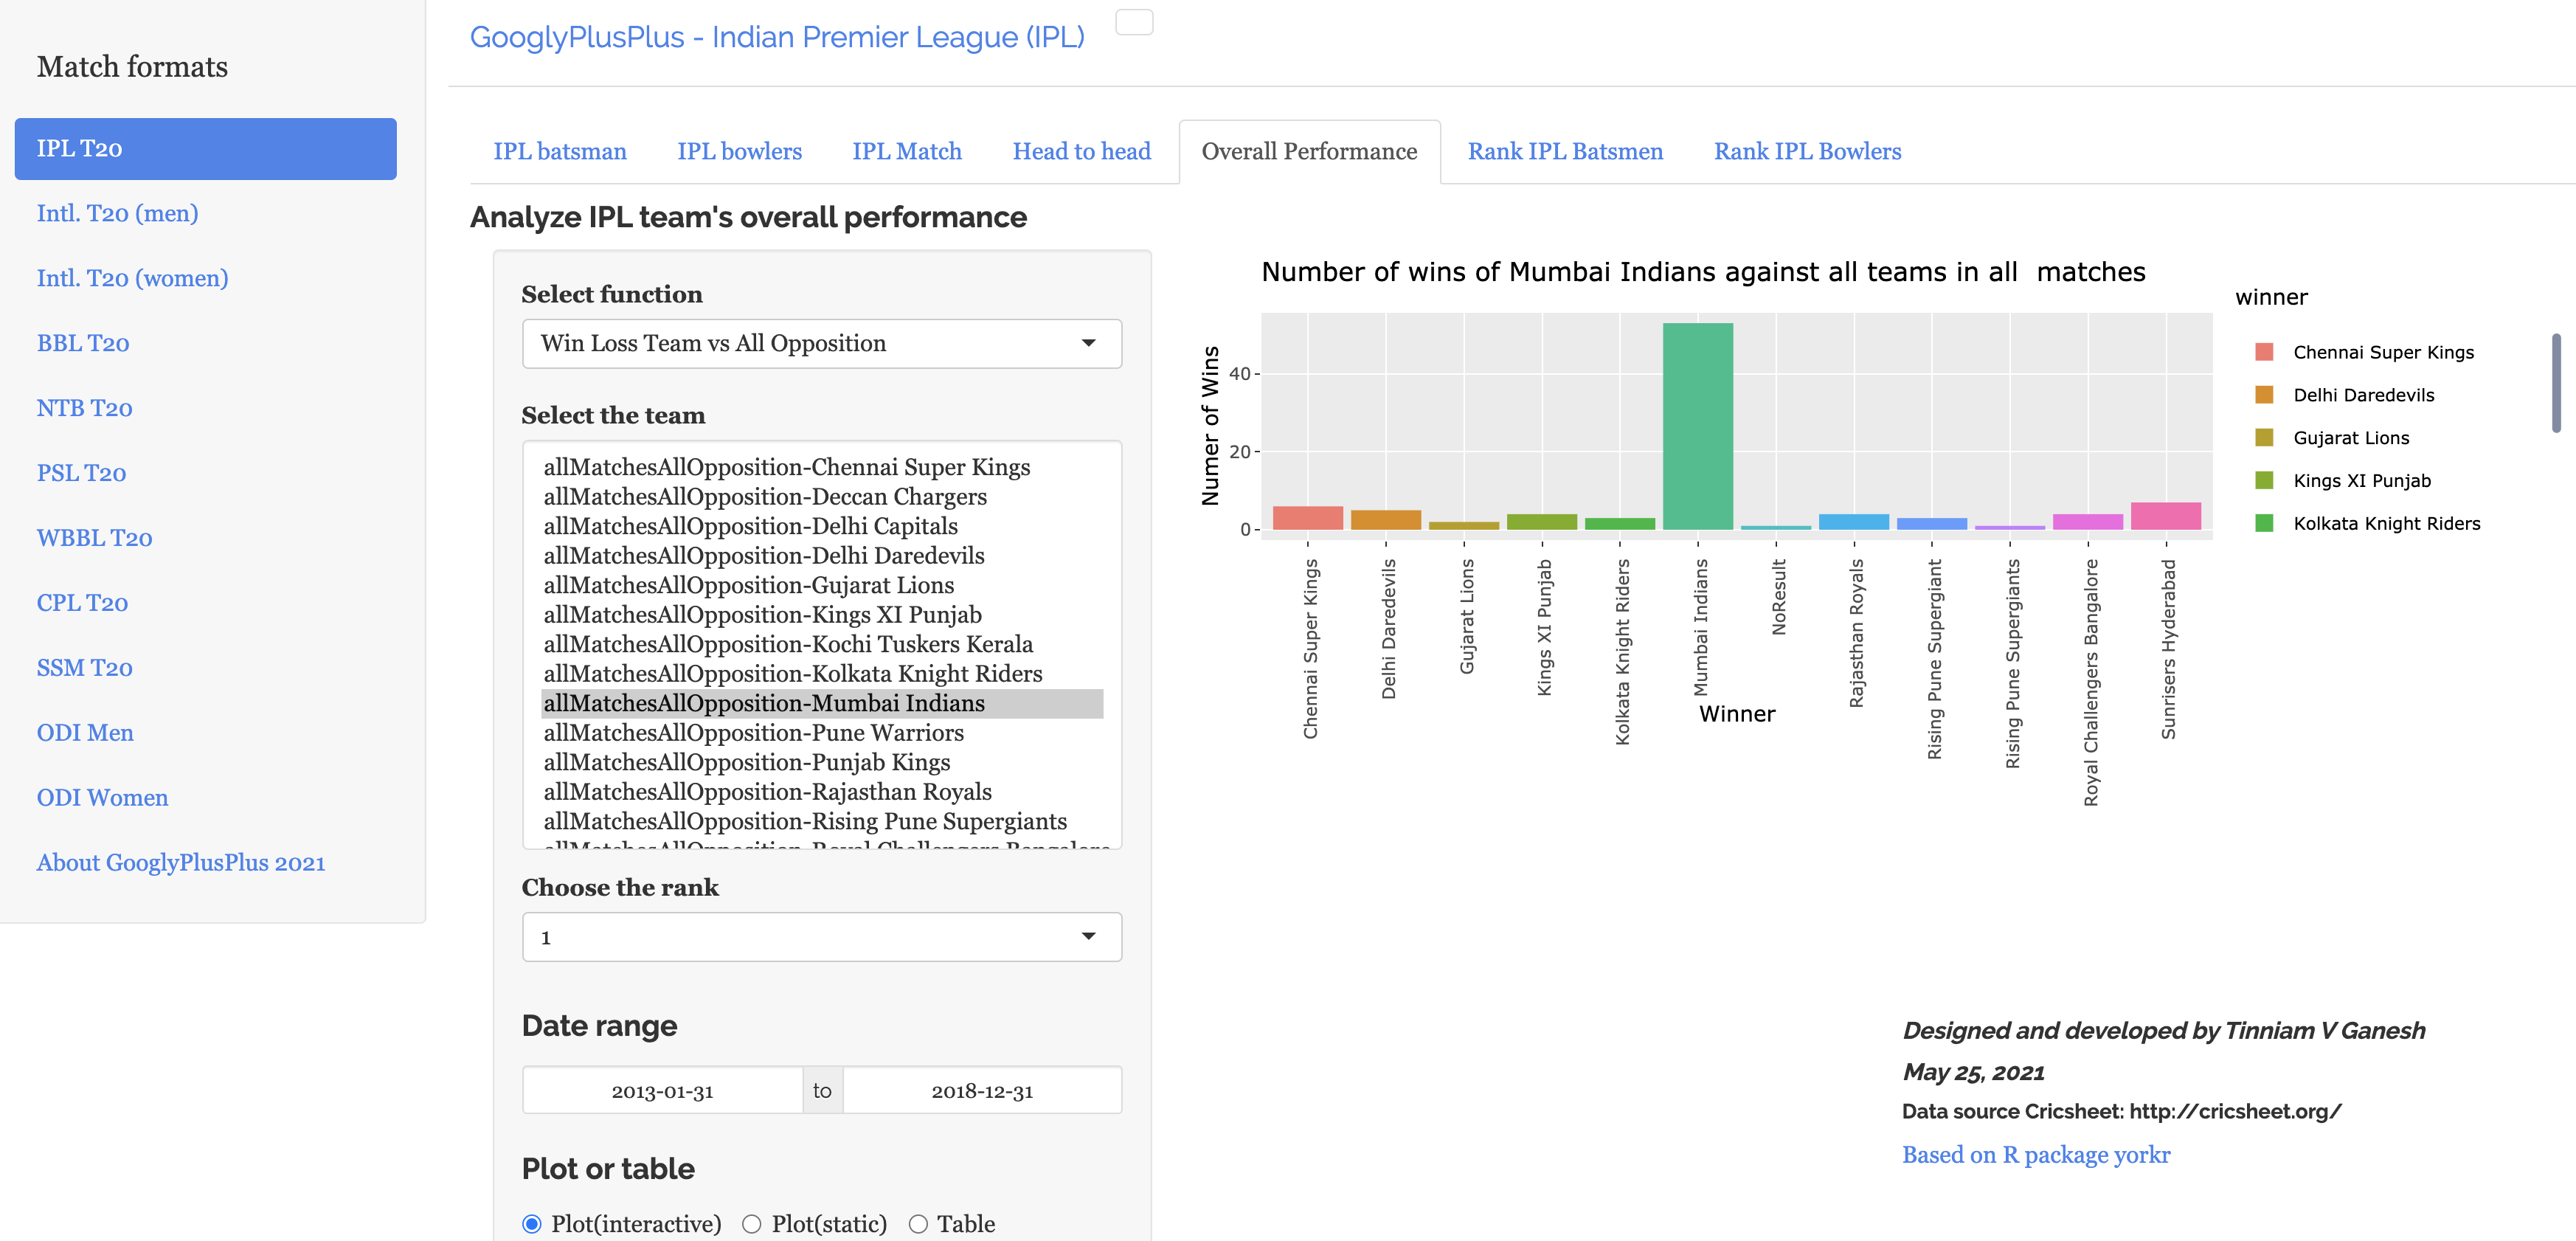
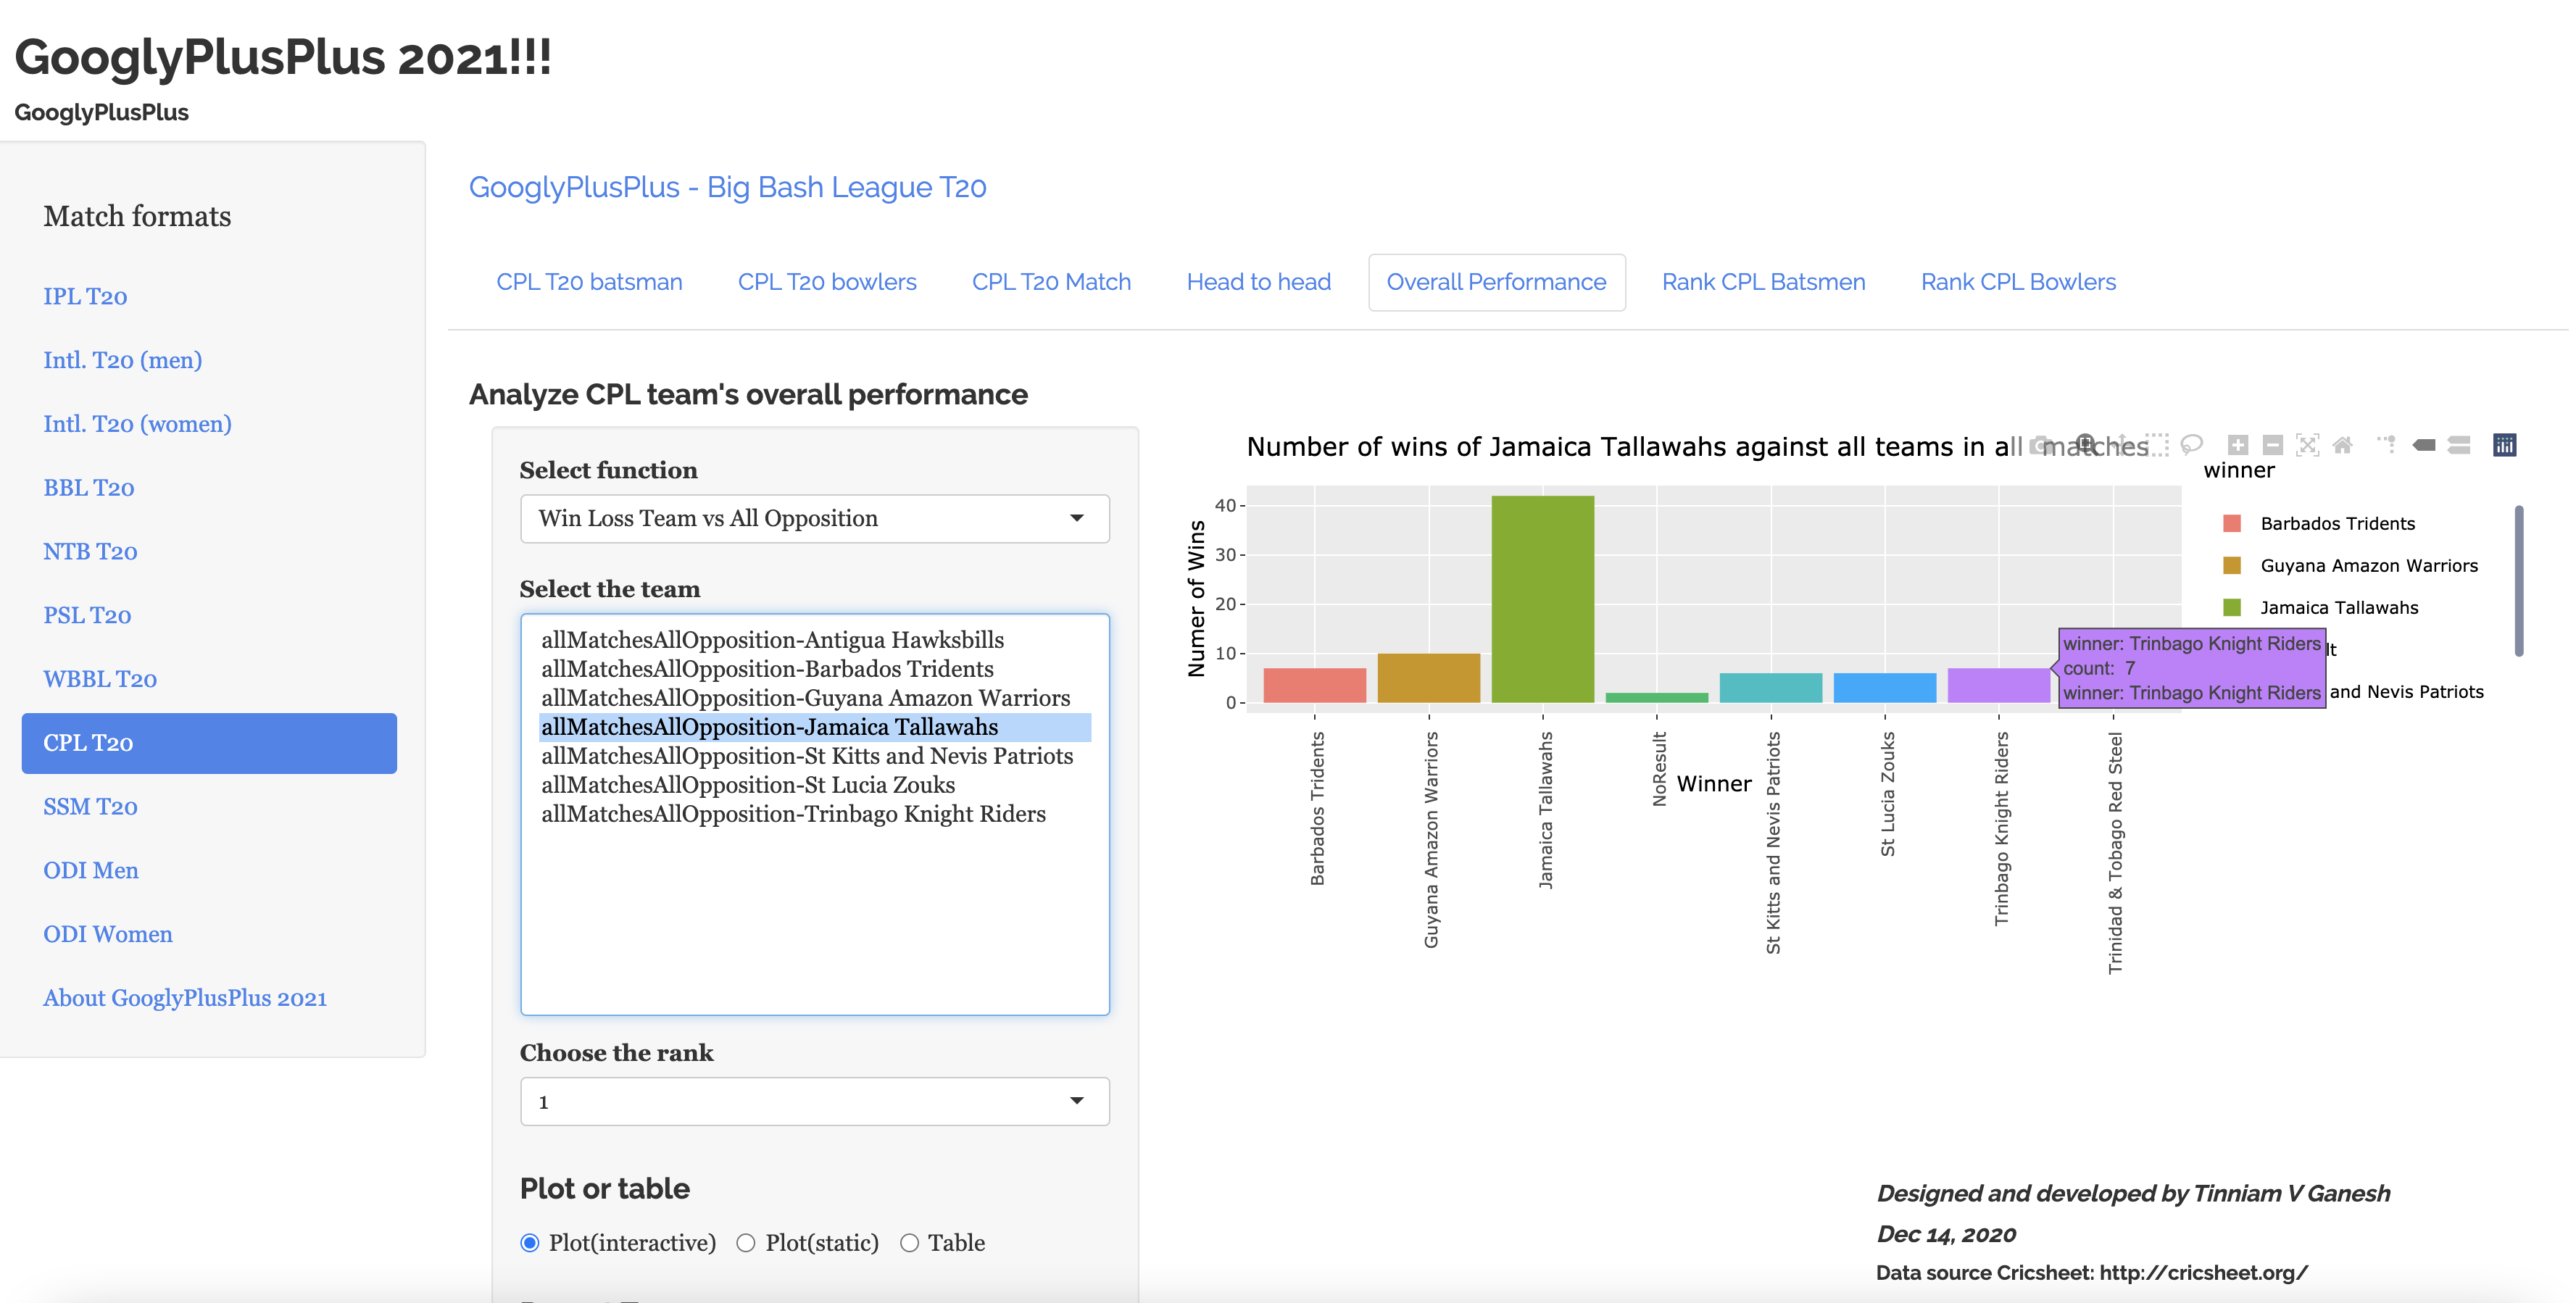
l) Win-loss against all teams (CPL)
Win-loss chart of Jamaica Talawallahs (CPL) in all matches against all opposition
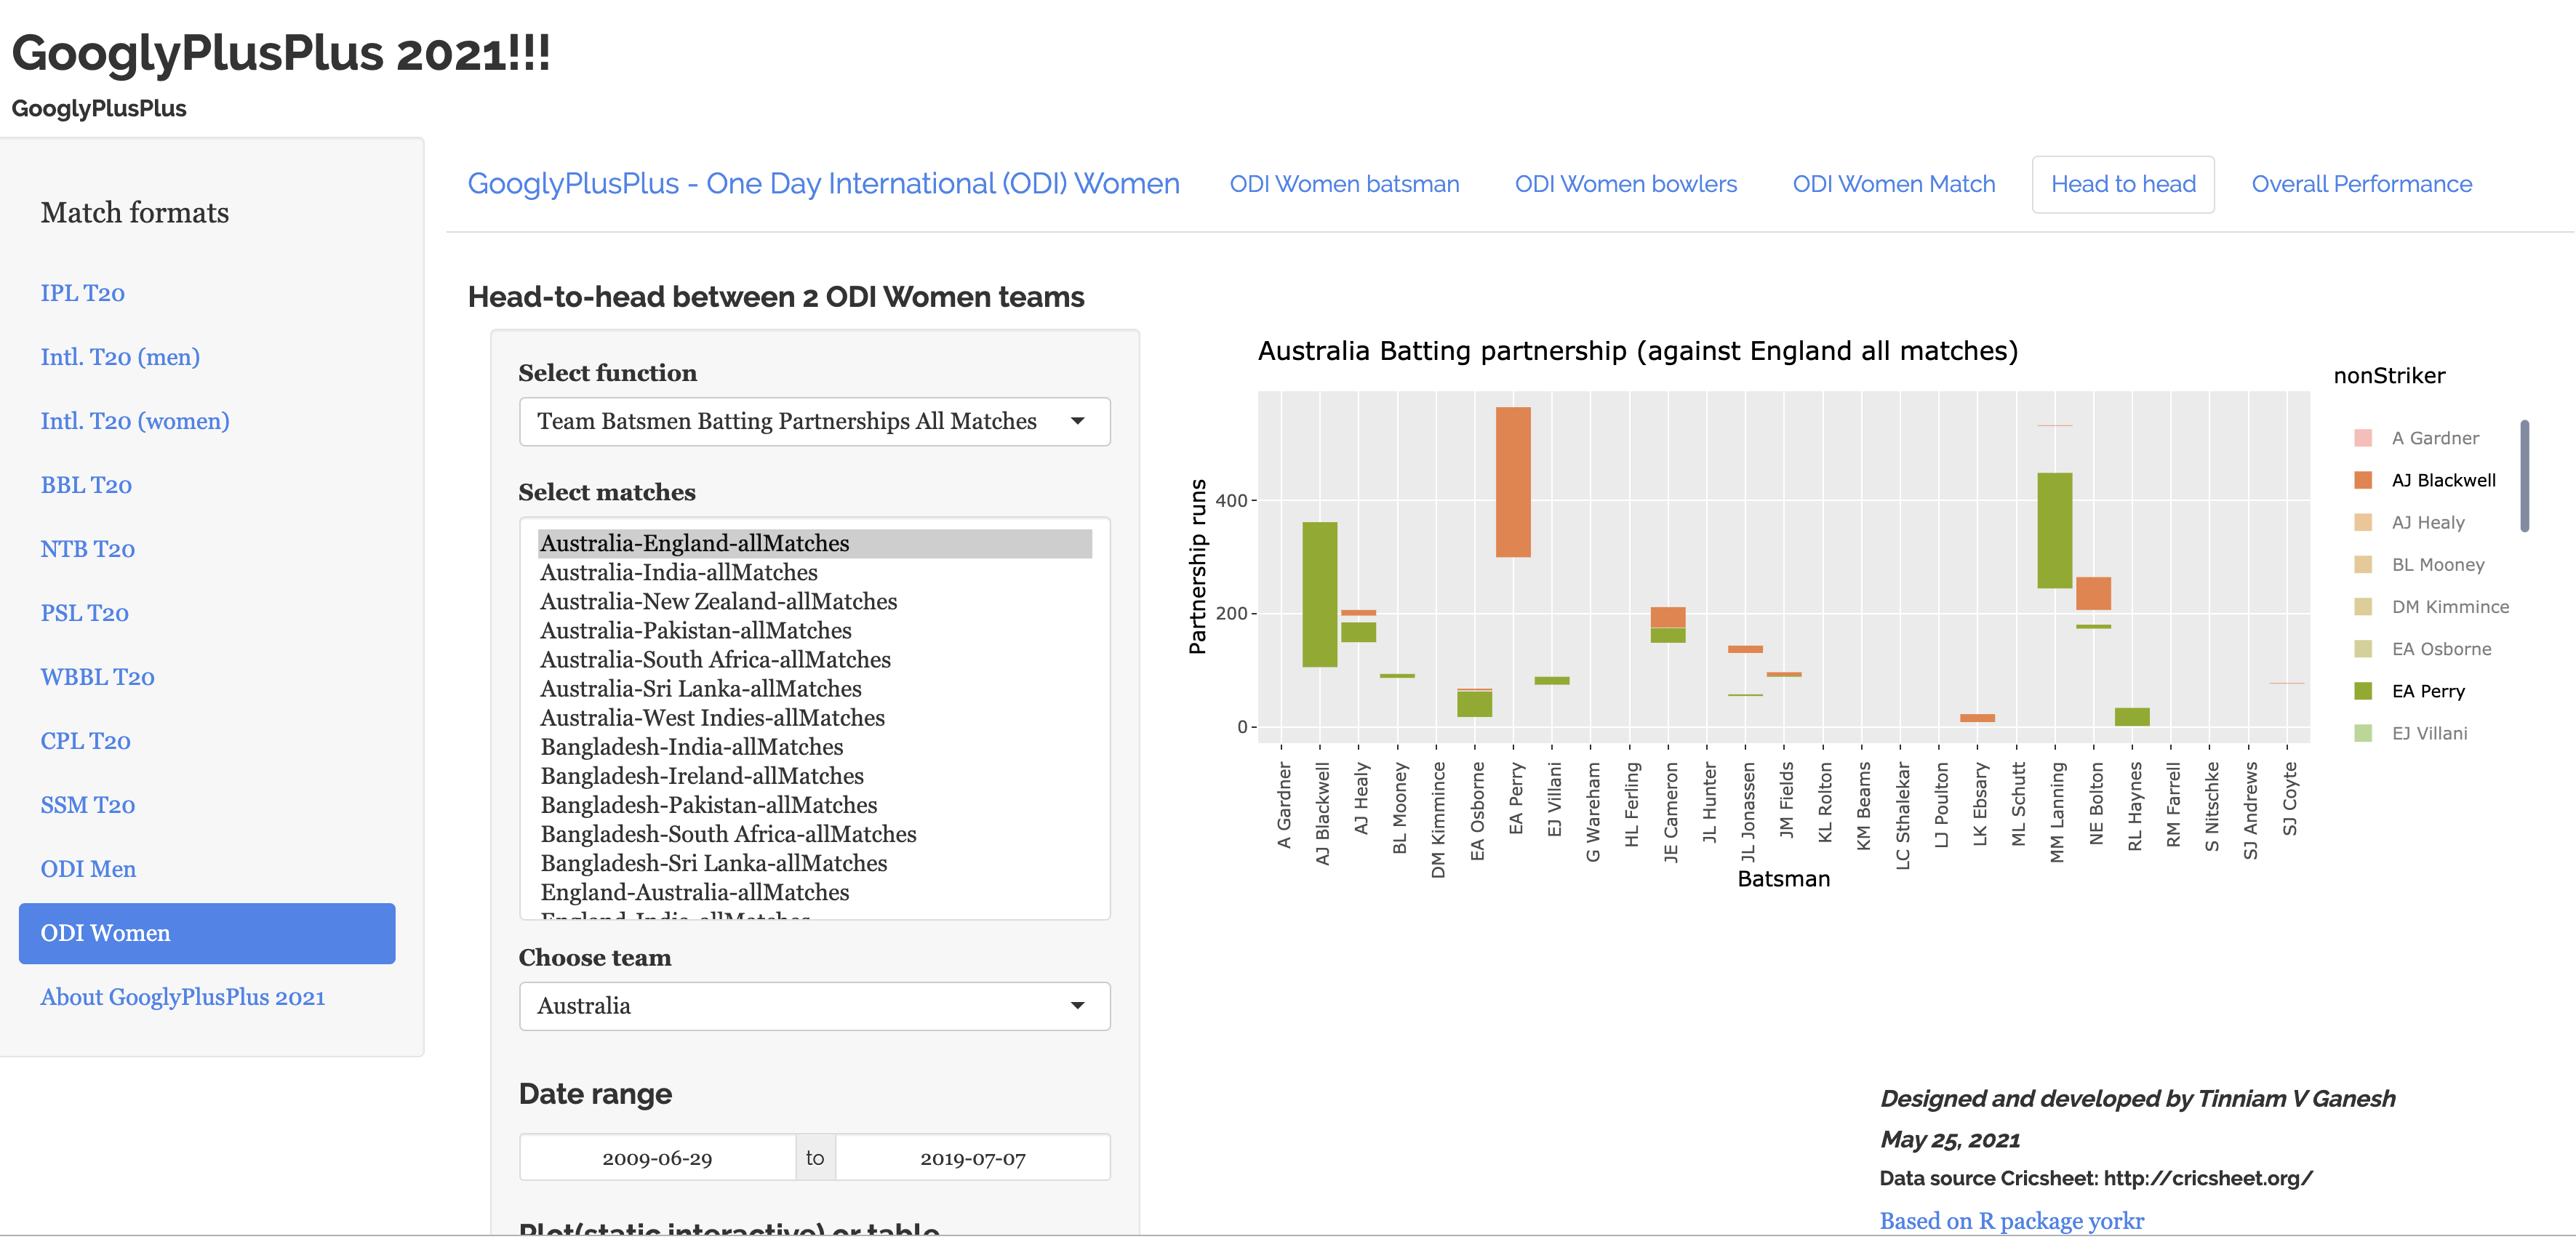
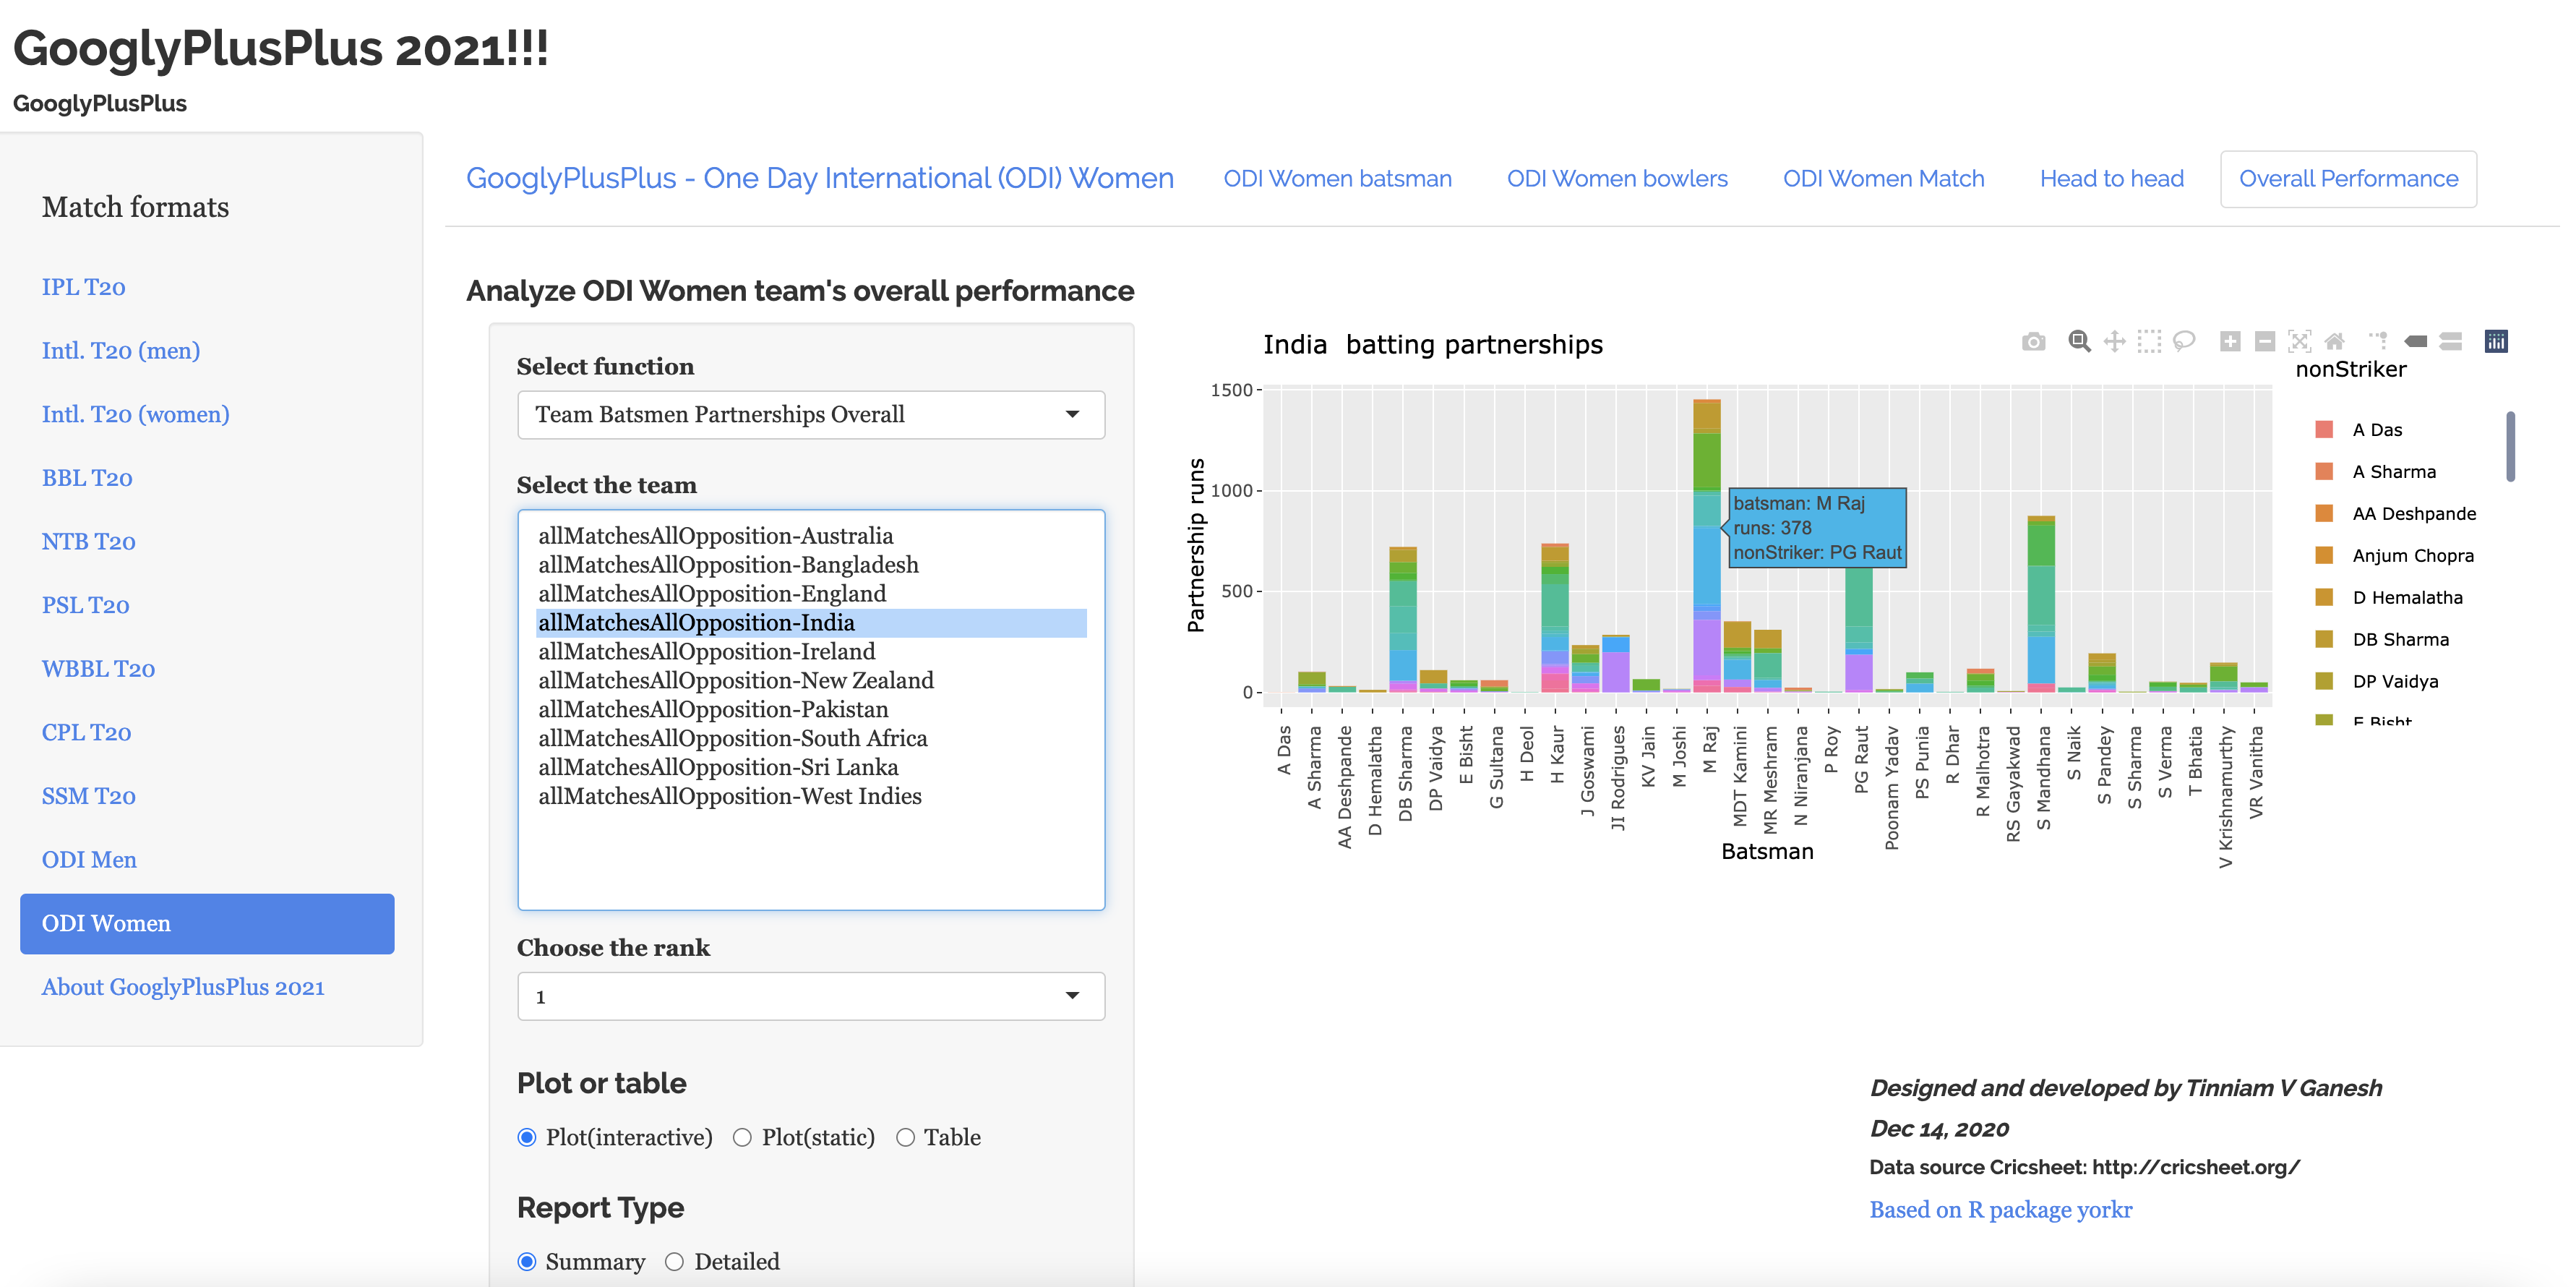
m) Team batting partnerships against all teams for India (ODI Women)
Batting partnerships of Indian ODI women against all other teams
n) Ranking of batsmen (IPL 2021)
Finally here is the latest ranking of IPL batsmen for IPL 2021 (can be done for all other T20 formats)
“Would you tell me, please, which way I ought to go from here?” “That depends a good deal on where you want to get to.” “I don’t much care where –” “Then it doesn’t matter which way you go.” Lewis Carroll, Alice in Wonderland
Every time I think that I have my R packages or Shiny apps all wrapped up, I find another idea trots up and knocks at my door. Since I intend to keep GooglyPlusPlus current with the latest data, I decided to include the ranking functions in my Shiny app GooglyPlusPlus.
Fortunately, since GooglyPlusPlus is based on my R package ‘yorkr‘ (see Introducing cricket package yorkr: Beaten by sheer pace!), I could make the necessary changes to the ranking functions in the package, so that it could be incorporated into my latest Shiny app GooglyPlusPlus2021!! To know how to use GooglyPlusPlus see my post Introducing GooglyPlusPlus
Note: GooglyPlusPlus can analyze batsmen, bowlers, matches and teams.
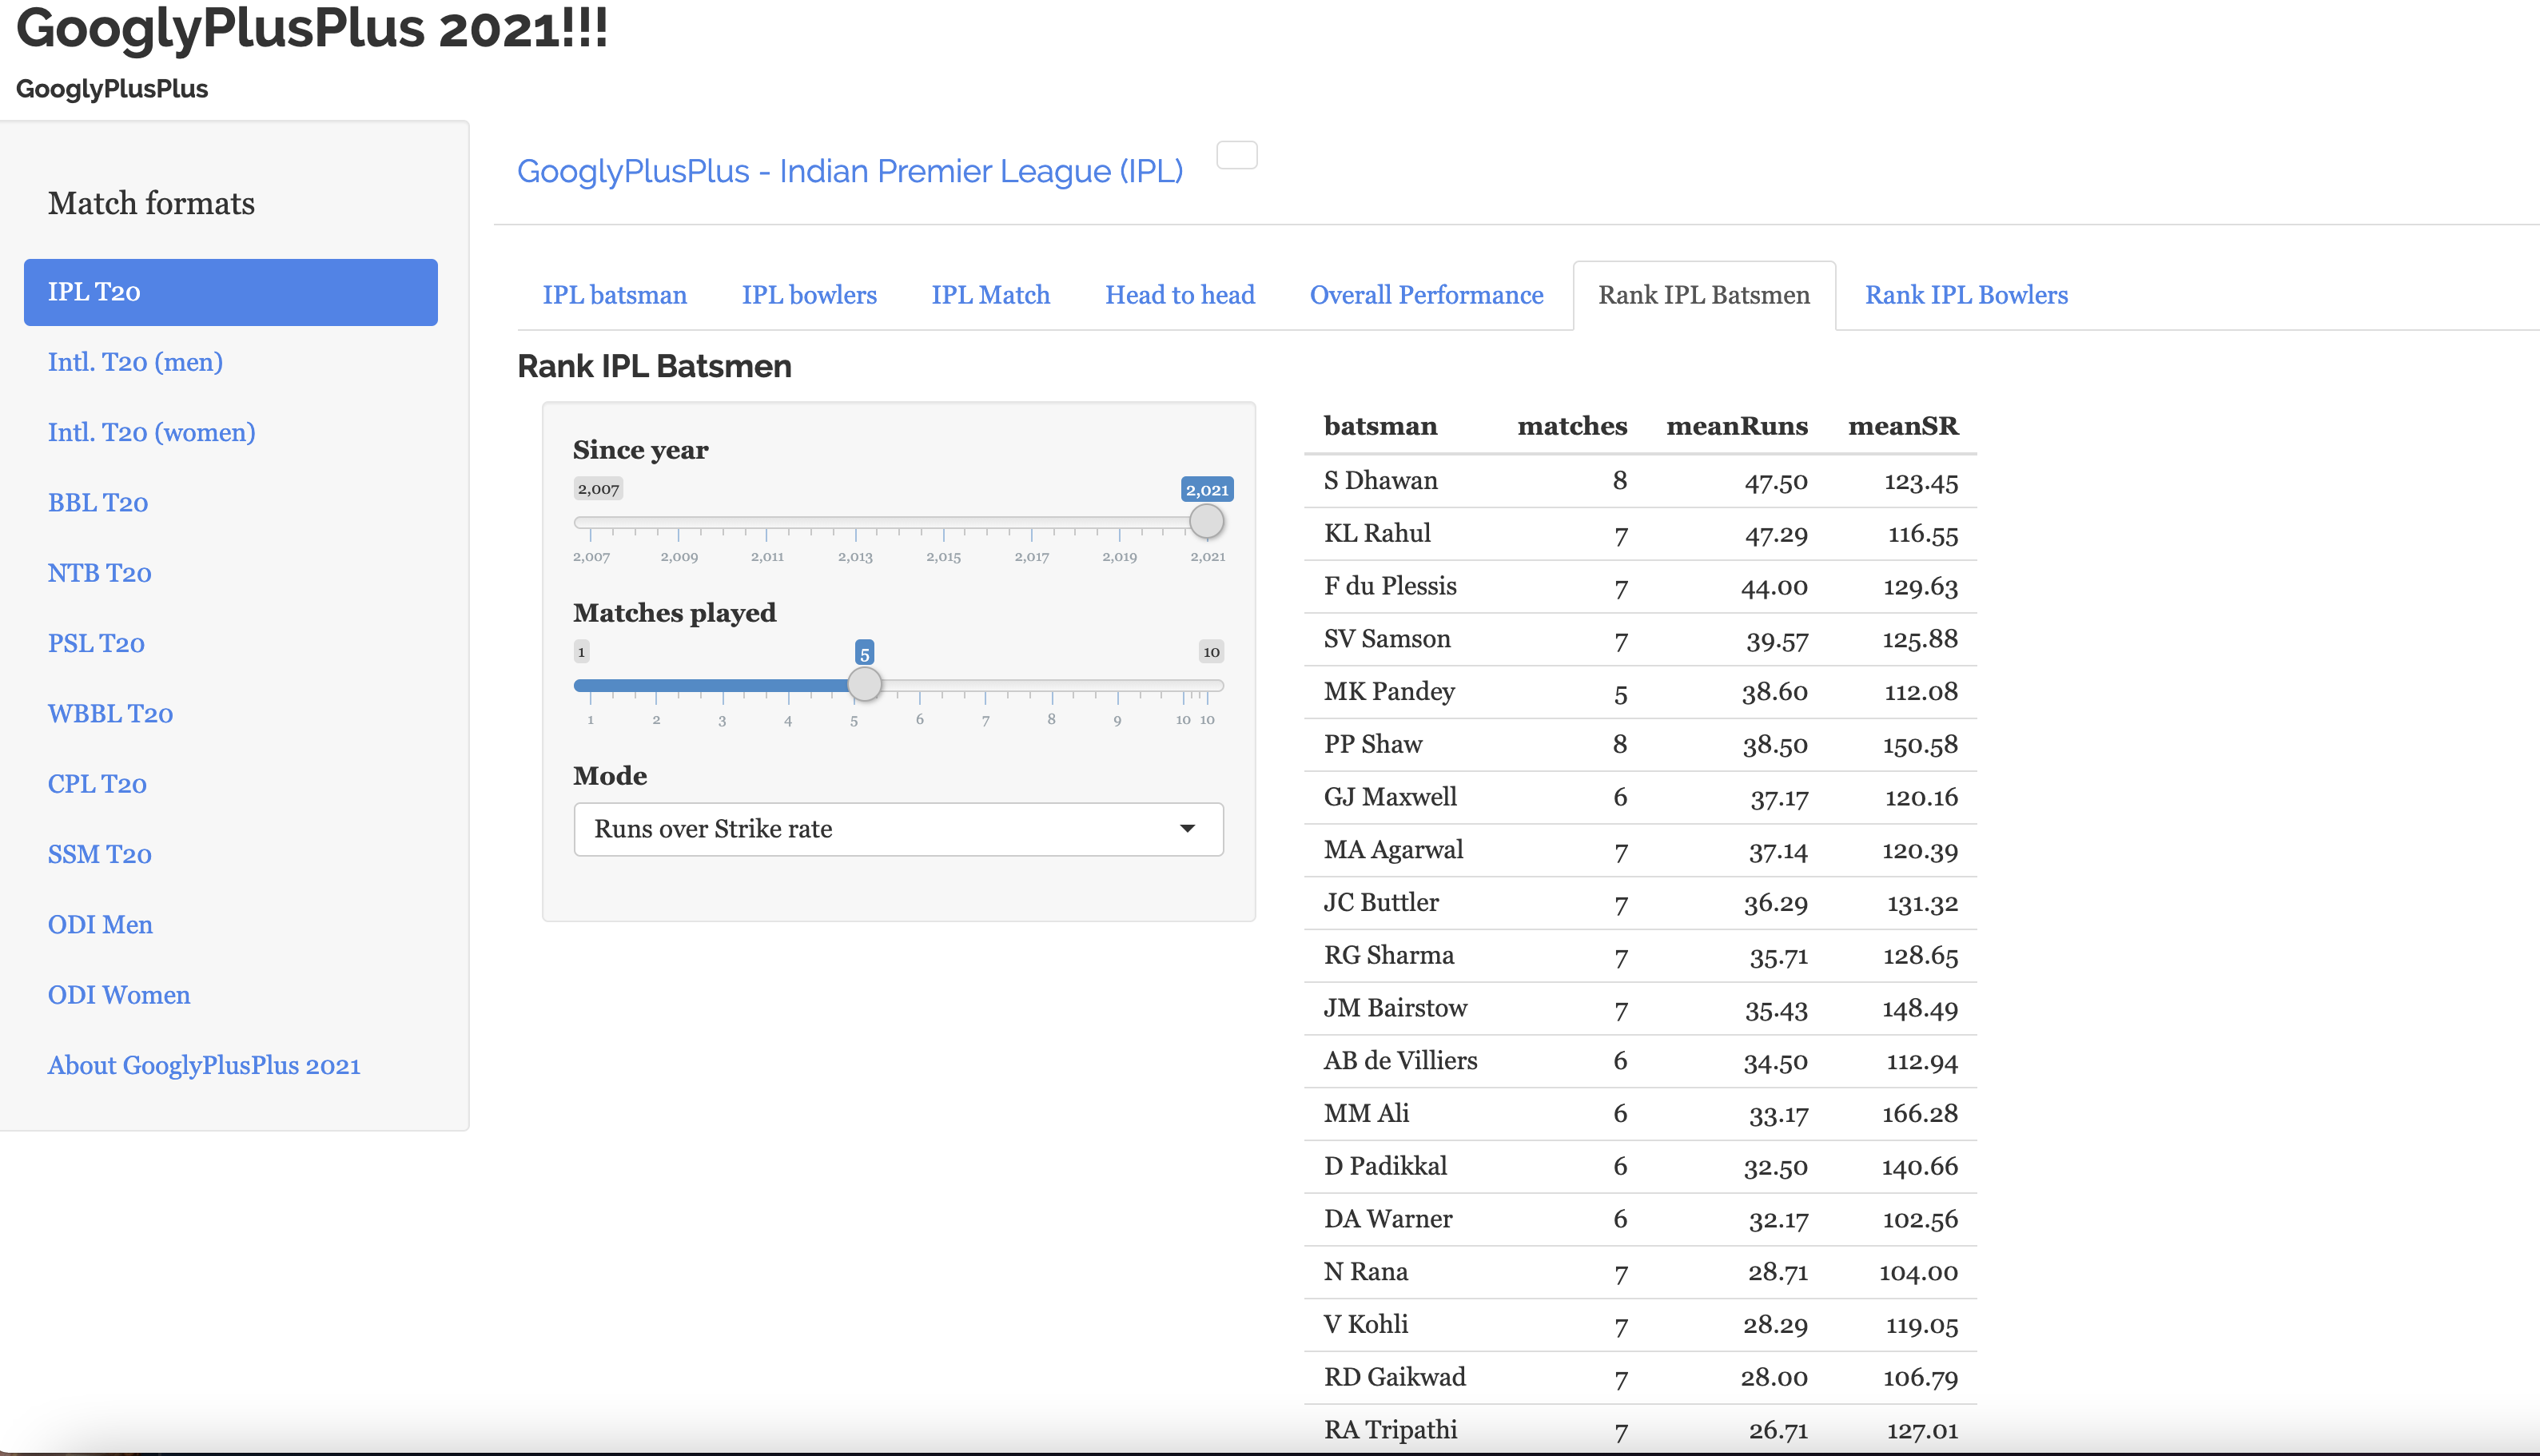
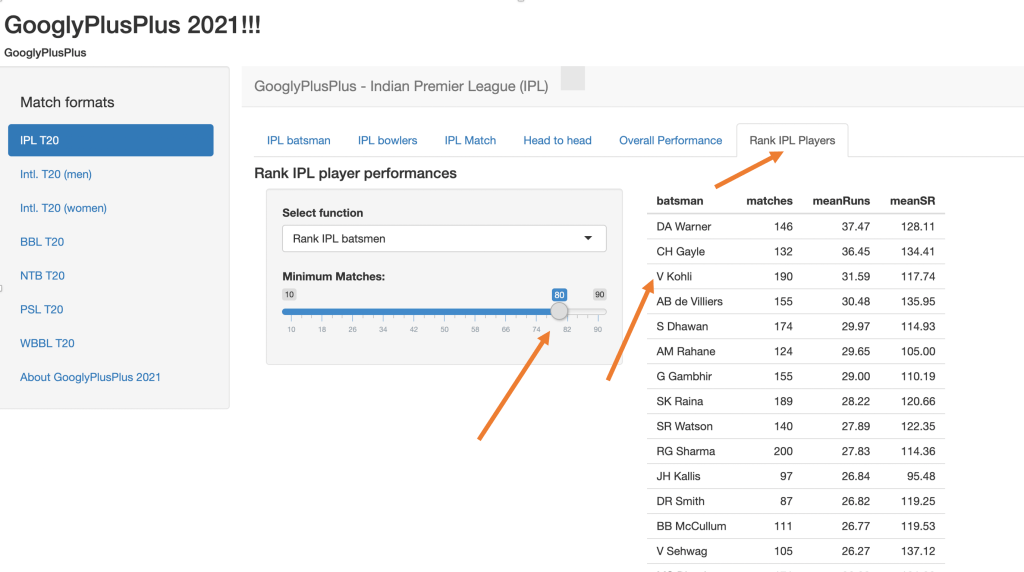
Ranking IPL batsmen (minMatches = 80) – The following table shows the ranking of IPL players who have played 80 matches or more
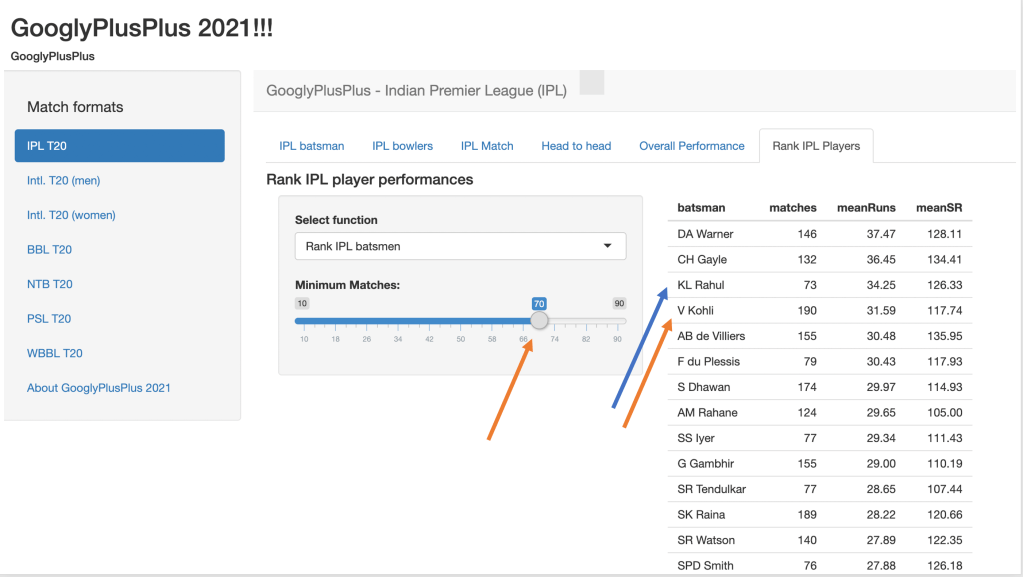
B) Identifying batsmen of potential and promise
Ranking IPL batsmen (minMatches =70) – If we reduce the minimum number of matches played to 70, then we see it pushes up KL Rahul above Kohli.
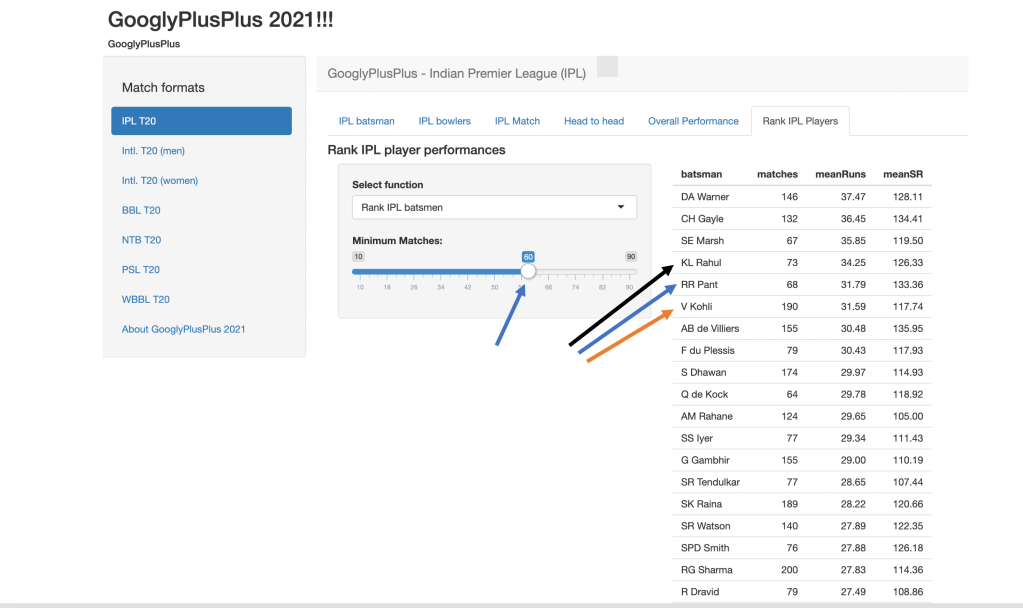
Ranking IPL batsmen (minMatches =60) – When the slider is moved to 60, we see that Rishabh Pant has a better mean average and mean strike rate and is also ranked above Kohli. We can identify promising players this way. However, it is also likely that some players may be just a bright flash in the pan
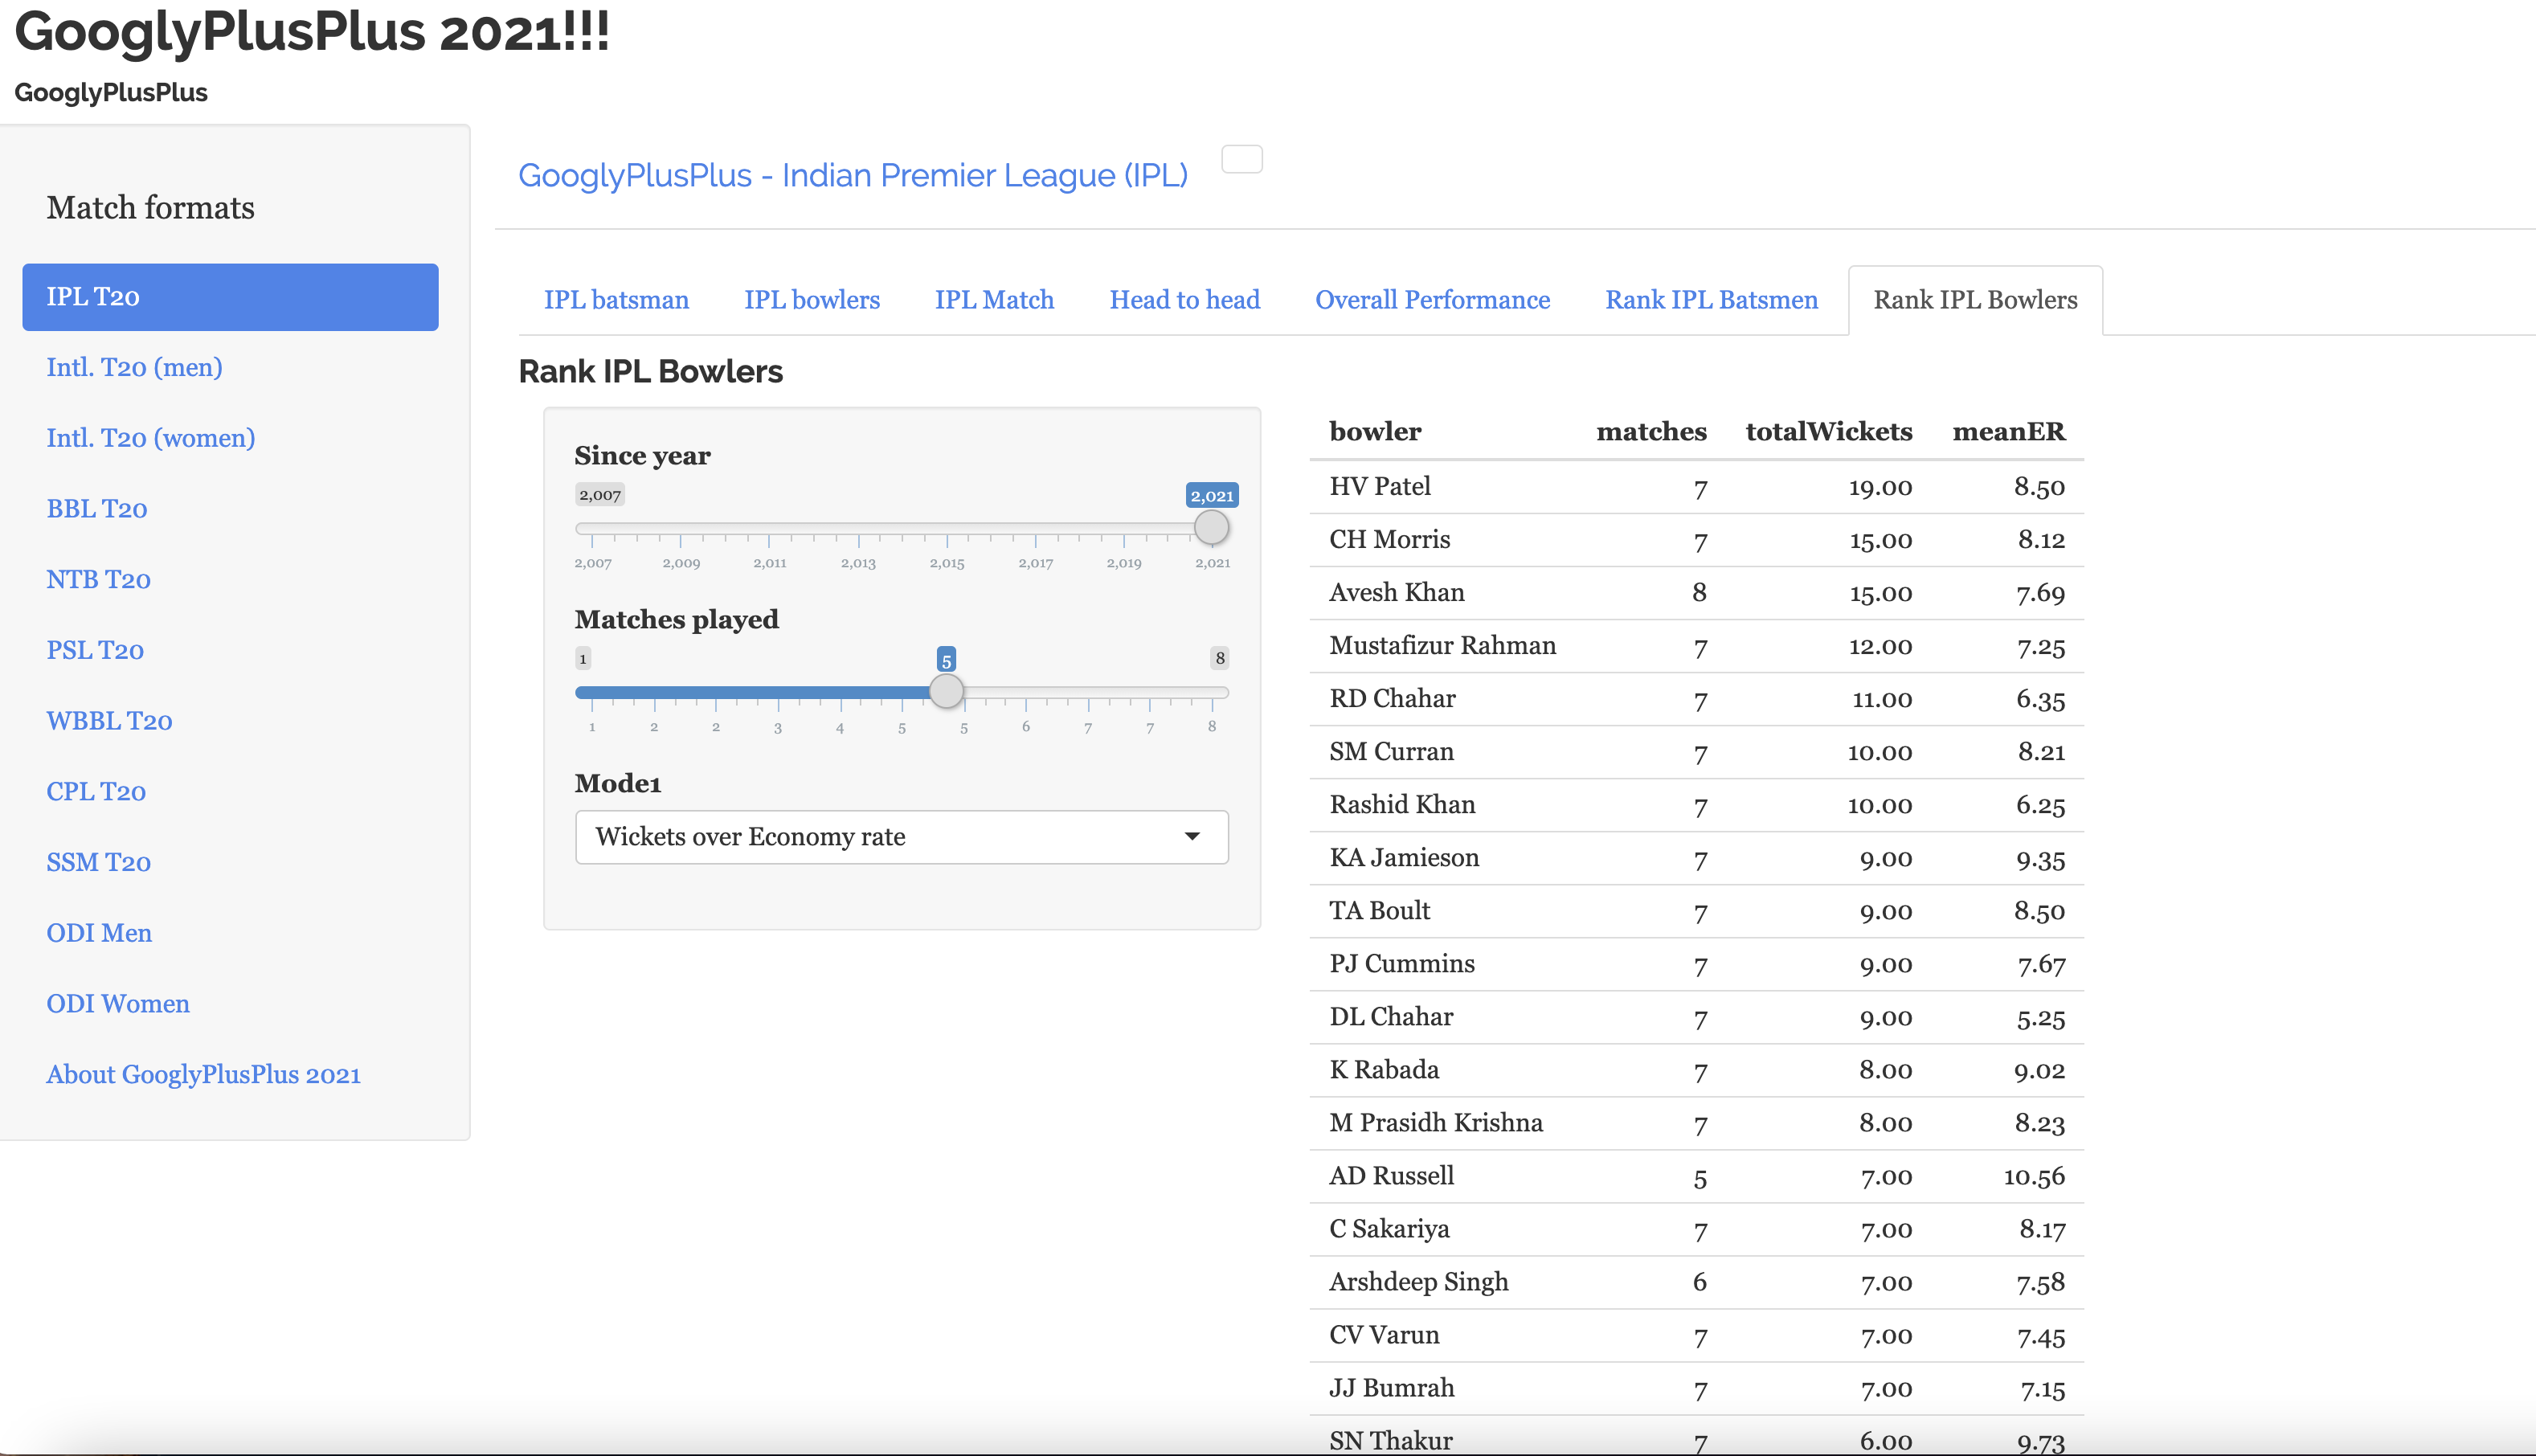
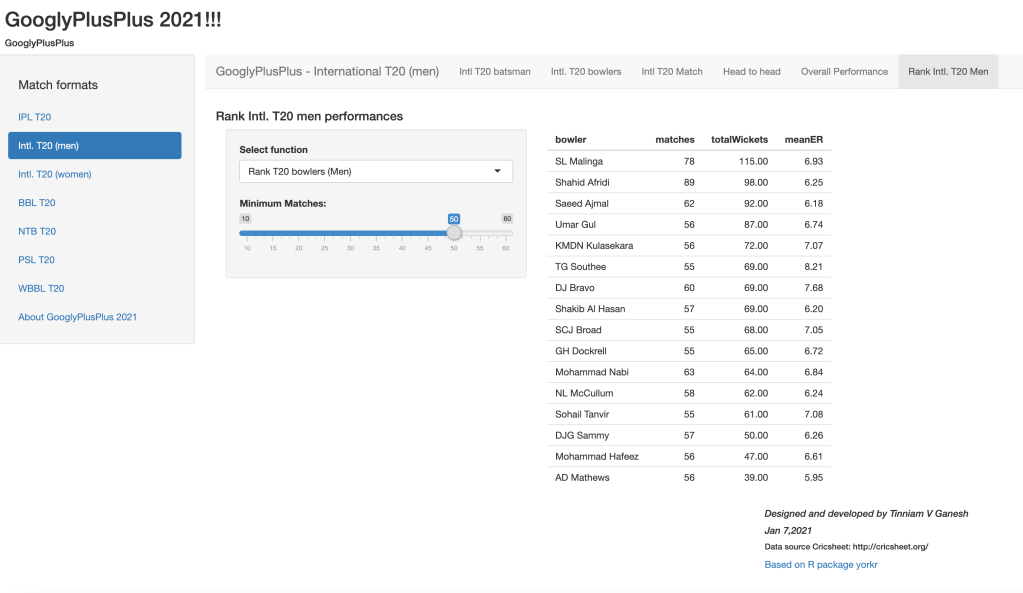
C) Ranking T20 bowlers (men)
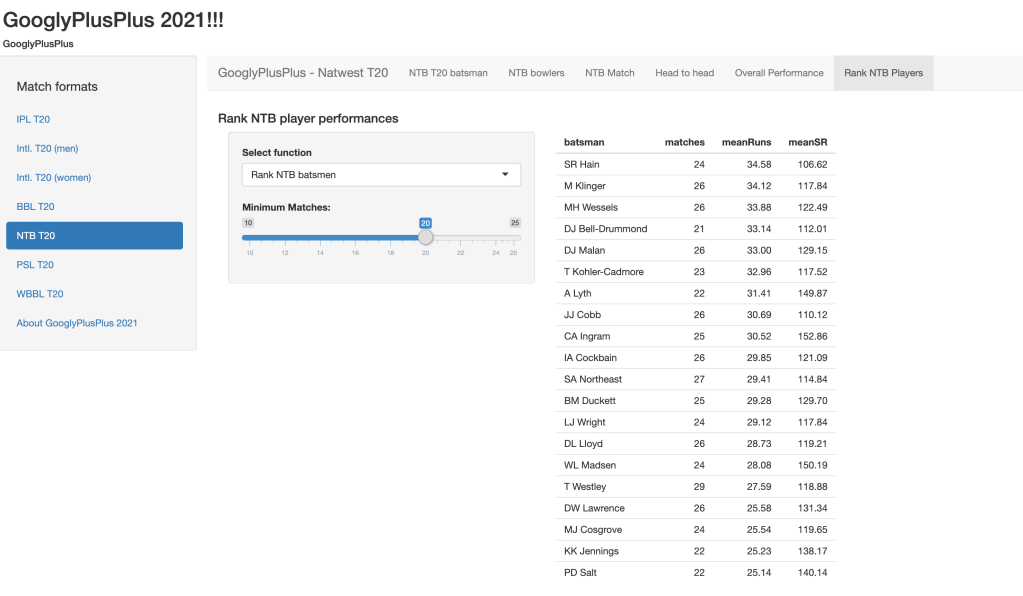
D) Ranking NTB Batsmen
GooglyPlusPlus2021 can rank all T20 formats (IPL, BBL, Intl. T20 (men), Intl. T20 (women), NTB, PSL and WBB. Do give it a try!
Also remember that GooglyPlusPlus2021 includes close to 100+ functions which enable it to perform analysis of batsmen, bowlers, T20 matches, head-to-head confrontation of T20 teams and overall performance of T20 teams . To know more about GooglyPlusPlus2021 see Introducing GooglyPlusPlus
You can download the code for this app from Github at GooglyPlusPlus2021