Introduction
In this post I create RMarkdown templates for end-to-end analysis of IPL T20 matches, that are available on Cricsheet based on my R package yorkr. With these templates you can convert all IPL data which is in yaml format to R dataframes. Further I create data and the necessary templates for analyzing IPL matches, teams and players. All of these can be accessed at yorkrIPLTemplate.
If you are passionate about cricket, and love analyzing cricket performances, then check out my 2 racy books on cricket! In my books, I perform detailed yet compact analysis of performances of both batsmen, bowlers besides evaluating team & match performances in Tests , ODIs, T20s & IPL. You can buy my books on cricket from Amazon at $12.99 for the paperback and $4.99/$6.99 respectively for the kindle versions. The books can be accessed at Cricket analytics with cricketr and Beaten by sheer pace-Cricket analytics with yorkr A must read for any cricket lover! Check it out!!
9/Rs 320 and $6.99/Rs448 respectively
The templates are
- Template for conversion and setup – IPLT20Template.Rmd
- Any IPL match – IPLMatchtemplate.Rmd
- IPL matches between 2 nations – IPLMatches2TeamTemplate.Rmd
- A IPL nations performance against all other IPL nations – IPLAllMatchesAllOppnTemplate.Rmd
- Analysis of IPL batsmen and bowlers of all IPL nations – IPLBatsmanBowlerTemplate.Rmd
Besides the templates the repository also includes the converted data for all IPL matches I downloaded from Cricsheet in Dec 2016. So this data is complete till the 2016 IPL season. You can recreate the files as more matches are added to Cricsheet site in IPL 2017 and future seasons. This post contains all the steps needed for detailed analysis of IPL matches, teams and IPL player. This will also be my reference in future if I decide to analyze IPL in future!
See my earlier posts where I analyze IPL T20
1. yorkr crashes the IPL party ! – Part 1
2. yorkr crashes the IPL party! – Part 2
3. yorkr crashes the IPL party! – Part 3!
4. yorkr crashes the IPL party! – Part 4
There will be 5 folders at the root
- IPLdata – Match files as yaml from Cricsheet
- IPLMatches – Yaml match files converted to dataframes
- IPLMatchesBetween2Teams – All Matches between any 2 IPL teams
- allMatchesAllOpposition – An IPL teams’s performance against all other teams
- BattingBowlingDetails – Batting and bowling details of all IPL teams
library(yorkr)
library(dplyr)
The first few steps take care of the data setup. This needs to be done before any of the analysis of IPL batsmen, bowlers, any IPL match, matches between any 2 IPL countries or analysis of a teams performance against all other countries
There will be 5 folders at the root
- data
- IPLMatches
- IPLMatchesBetween2Teams
- allMatchesAllOpposition
- BattingBowlingDetails
The source YAML files will be in IPLData folder
1.Create directory of IPLMatches
Some files may give conversions errors. You could try to debug the problem or just remove it from the IPLdata folder. At most 2-4 file will have conversion problems and I usally remove then from the files to be converted.
Also take a look at my GooglyPlus shiny app which was created after performing the same conversion on the Dec 16 data .
convertAllYaml2RDataframesT20("data","IPLMatches")
2.Save all matches between all combinations of IPL nations
This function will create the set of all matches between each IPL team against every other IPL team. This uses the data that was created in IPLMatches, with the convertAllYaml2RDataframesIPL() function.
setwd("./IPLMatchesBetween2Teams")
saveAllMatchesBetween2IPLTeams(dir= ,odir= )
3.Save all matches against all opposition
This will create a consolidated dataframe of all matches played by every IPL playing nation against all other nattions. This also uses the data that was created in IPLMatches, with the convertAllYaml2RDataframesIPL() function.
setwd("../allMatchesAllOpposition")
saveAllMatchesAllOppositionIPLT20(dir= ,odir= )
4. Create batting and bowling details for each IPL team
These are the current IPL playing teams. You can add to this vector as newer IPL teams start playing IPL. You will get to know all IPL teams by also look at the directory created above namely allMatchesAllOpposition. This also uses the data that was created in IPLMatches, with the convertAllYaml2RDataframesIPL() function.
setwd("../BattingBowlingDetails")
ipl_teams <- list("Chennai Super Kings","Deccan Chargers", "Delhi Daredevils","Kings XI Punjab",
              "Kochi Tuskers Kerala","Kolkata Knight Riders","Mumbai Indians","Pune Warriors",
              "Rajasthan Royals","Royal Challengers Bangalore","Sunrisers Hyderabad","Gujarat Lions",
                 "Rising Pune Supergiants")

for(i in seq_along(ipl_teams)){
    print(ipl_teams[i])
    val <- paste(ipl_teams[i],"-details",sep="")
    val <- getTeamBattingDetails(ipl_teams[i],dir="../IPLMatches", save=TRUE)

}

for(i in seq_along(ipl_teams)){
    print(ipl_teams[i])
    val <- paste(ipl_teams[i],"-details",sep="")
    val <- getTeamBowlingDetails(ipl_teams[i],dir="../IPLMatches", save=TRUE)

}
5. Get the list of batsmen for a particular IPL team
The following code is needed for analyzing individual IPL batsmen. In IPL a player could have played in multiple IPL teams.
getBatsmen <- function(df){
    bmen <- df %>% distinct(batsman)
    bmen <- as.character(bmen$batsman)
    batsmen <- sort(bmen)
}
load("Chennai Super Kings-BattingDetails.RData")
csk_details <- battingDetails
load("Deccan Chargers-BattingDetails.RData")
dc_details <- battingDetails
load("Delhi Daredevils-BattingDetails.RData")
dd_details <- battingDetails
load("Kings XI Punjab-BattingDetails.RData")
kxip_details <- battingDetails
load("Kochi Tuskers Kerala-BattingDetails.RData")
ktk_details <- battingDetails
load("Kolkata Knight Riders-BattingDetails.RData")
kkr_details <- battingDetails
load("Mumbai Indians-BattingDetails.RData")
mi_details <- battingDetails
load("Pune Warriors-BattingDetails.RData")
pw_details <- battingDetails
load("Rajasthan Royals-BattingDetails.RData")
rr_details <- battingDetails
load("Royal Challengers Bangalore-BattingDetails.RData")
rcb_details <- battingDetails
load("Sunrisers Hyderabad-BattingDetails.RData")
sh_details <- battingDetails
load("Gujarat Lions-BattingDetails.RData")
gl_details <- battingDetails
load("Rising Pune Supergiants-BattingDetails.RData")
rps_details <- battingDetails

#Get the batsmen for each IPL team
csk_batsmen <- getBatsmen(csk_details)
dc_batsmen <- getBatsmen(dc_details)
dd_batsmen <- getBatsmen(dd_details)
kxip_batsmen <- getBatsmen(kxip_details)
ktk_batsmen <- getBatsmen(ktk_details)
kkr_batsmen <- getBatsmen(kkr_details)
mi_batsmen <- getBatsmen(mi_details)
pw_batsmen <- getBatsmen(pw_details)
rr_batsmen <- getBatsmen(rr_details)
rcb_batsmen <- getBatsmen(rcb_details)
sh_batsmen <- getBatsmen(sh_details)
gl_batsmen <- getBatsmen(gl_details)
rps_batsmen <- getBatsmen(rps_details)

# Save the dataframes
save(csk_batsmen,file="csk.RData")
save(dc_batsmen, file="dc.RData")
save(dd_batsmen, file="dd.RData")
save(kxip_batsmen, file="kxip.RData")
save(ktk_batsmen, file="ktk.RData")
save(kkr_batsmen, file="kkr.RData")
save(mi_batsmen , file="mi.RData")
save(pw_batsmen, file="pw.RData")
save(rr_batsmen, file="rr.RData")
save(rcb_batsmen, file="rcb.RData")
save(sh_batsmen, file="sh.RData")
save(gl_batsmen, file="gl.RData")
save(rps_batsmen, file="rps.RData")
6. Get the list of bowlers for a particular IPL team
The method below can get the list of bowler names for any IPL team.The following code is needed for analyzing individual IPL bowlers. In IPL a player could have played in multiple IPL teams.
getBowlers <- function(df){
    bwlr <- df %>% distinct(bowler)
    bwlr <- as.character(bwlr$bowler)
    bowler <- sort(bwlr)
}

load("Chennai Super Kings-BowlingDetails.RData")
csk_details <- bowlingDetails
load("Deccan Chargers-BowlingDetails.RData")
dc_details <- bowlingDetails
load("Delhi Daredevils-BowlingDetails.RData")
dd_details <- bowlingDetails
load("Kings XI Punjab-BowlingDetails.RData")
kxip_details <- bowlingDetails
load("Kochi Tuskers Kerala-BowlingDetails.RData")
ktk_details <- bowlingDetails
load("Kolkata Knight Riders-BowlingDetails.RData")
kkr_details <- bowlingDetails
load("Mumbai Indians-BowlingDetails.RData")
mi_details <- bowlingDetails
load("Pune Warriors-BowlingDetails.RData")
pw_details <- bowlingDetails
load("Rajasthan Royals-BowlingDetails.RData")
rr_details <- bowlingDetails
load("Royal Challengers Bangalore-BowlingDetails.RData")
rcb_details <- bowlingDetails
load("Sunrisers Hyderabad-BowlingDetails.RData")
sh_details <- bowlingDetails
load("Gujarat Lions-BowlingDetails.RData")
gl_details <- bowlingDetails
load("Rising Pune Supergiants-BowlingDetails.RData")
rps_details <- bowlingDetails

# Get the bowlers for each team
csk_bowlers <- getBowlers(csk_details)
dc_bowlers <- getBowlers(dc_details)
dd_bowlers <- getBowlers(dd_details)
kxip_bowlers <- getBowlers(kxip_details)
ktk_bowlers <- getBowlers(ktk_details)
kkr_bowlers <- getBowlers(kkr_details)
mi_bowlers <- getBowlers(mi_details)
pw_bowlers <- getBowlers(pw_details)
rr_bowlers <- getBowlers(rr_details)
rcb_bowlers <- getBowlers(rcb_details)
sh_bowlers <- getBowlers(sh_details)
gl_bowlers <- getBowlers(gl_details)
rps_bowlers <- getBowlers(rps_details)

#Save the dataframes
save(csk_bowlers,file="csk1.RData")
save(dc_bowlers, file="dc1.RData")
save(dd_bowlers, file="dd1.RData")
save(kxip_bowlers, file="kxip1.RData")
save(ktk_bowlers, file="ktk1.RData")
save(kkr_bowlers, file="kkr1.RData")
save(mi_bowlers , file="mi1.RData")
save(pw_bowlers, file="pw1.RData")
save(rr_bowlers, file="rr1.RData")
save(rcb_bowlers, file="rcb1.RData")
save(sh_bowlers, file="sh1.RData")
save(gl_bowlers, file="gl1.RData")
save(rps_bowlers, file="rps1.RData")
Now we are all set
A) IPL T20 Match Analysis
1 IPL Match Analysis
Load any match data from the ./IPLMatches folder for e.g. Chennai Super Kings-Deccan Chargers-2008-05-06.RData
setwd("./IPLMatches")
load("Chennai Super Kings-Deccan Chargers-2008-05-06.RData")
csk_dc<- overs
#The steps are
load("IPLTeam1-IPLTeam2-Date.Rdata")
IPLTeam1_IPLTeam2 <- overs
All analysis for this match can be done now
2. Scorecard
teamBattingScorecardMatch(IPLTeam1_IPLTeam2,"IPLTeam1")
teamBattingScorecardMatch(IPLTeam1_IPLTeam2,"IPLTeam2")
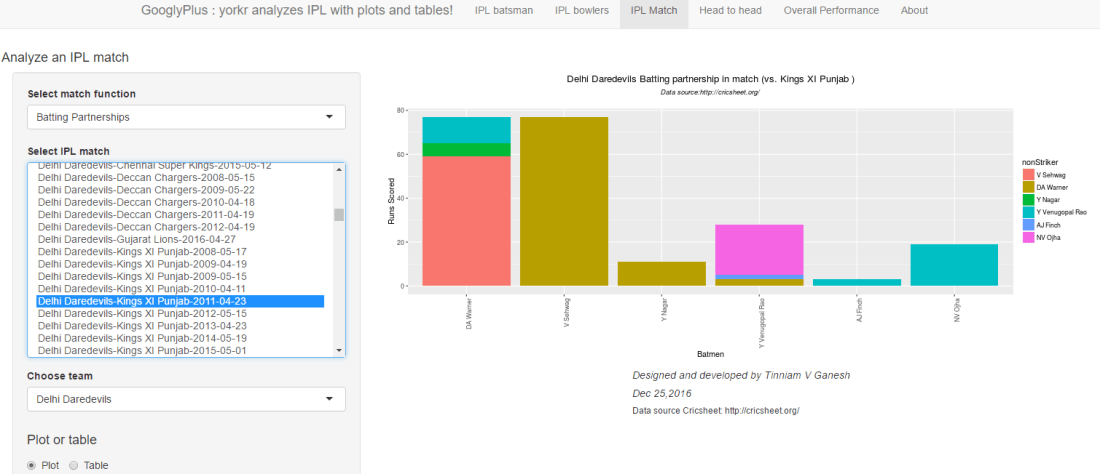
3.Batting Partnerships
teamBatsmenPartnershipMatch(IPLTeam1_IPLTeam2,"IPLTeam1","IPLTeam2")
teamBatsmenPartnershipMatch(IPLTeam1_IPLTeam2,"IPLTeam2","IPLTeam1")
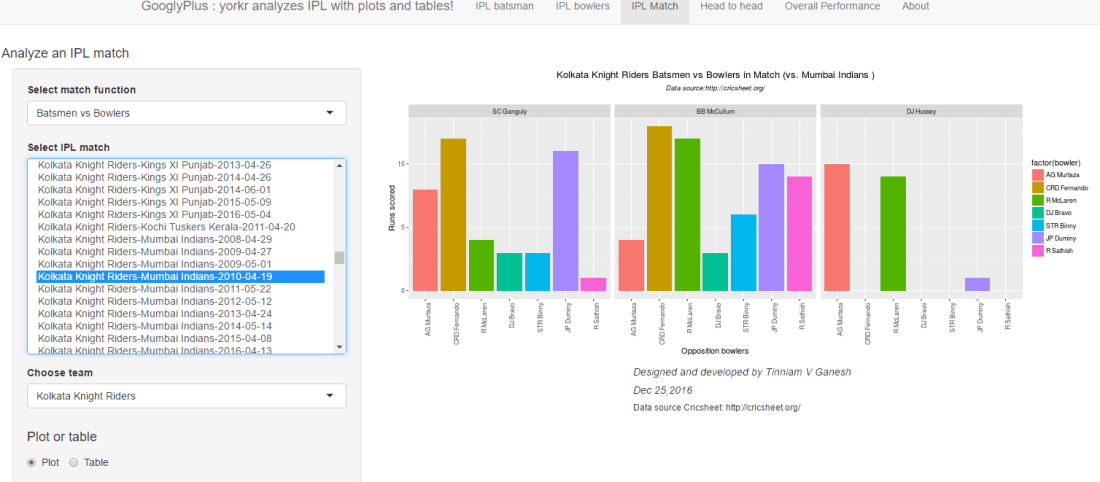
4. Batsmen vs Bowler Plot
teamBatsmenVsBowlersMatch(IPLTeam1_IPLTeam2,"IPLTeam1","IPLTeam2",plot=TRUE)
teamBatsmenVsBowlersMatch(IPLTeam1_IPLTeam2,"IPLTeam1","IPLTeam2",plot=FALSE)
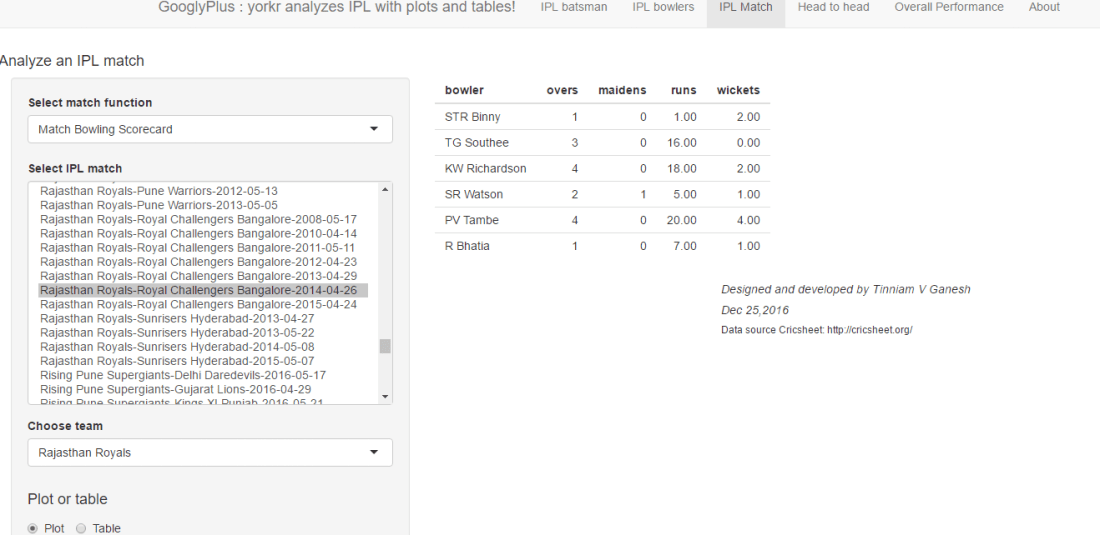
5. Team bowling scorecard
teamBowlingScorecardMatch(IPLTeam1_IPLTeam2,"IPLTeam1")
teamBowlingScorecardMatch(IPLTeam1_IPLTeam2,"IPLTeam2")
6. Team bowling Wicket kind match
teamBowlingWicketKindMatch(IPLTeam1_IPLTeam2,"IPLTeam1","IPLTeam2")
m <-teamBowlingWicketKindMatch(IPLTeam1_IPLTeam2,"IPLTeam1","IPLTeam2",plot=FALSE)
m
7. Team Bowling Wicket Runs Match
teamBowlingWicketRunsMatch(IPLTeam1_IPLTeam2,"IPLTeam1","IPLTeam2")
m <-teamBowlingWicketRunsMatch(IPLTeam1_IPLTeam2,"IPLTeam1","IPLTeam2",plot=FALSE)
m
8. Team Bowling Wicket Match
m <-teamBowlingWicketMatch(IPLTeam1_IPLTeam2,"IPLTeam1","IPLTeam2",plot=FALSE)
m
teamBowlingWicketMatch(IPLTeam1_IPLTeam2,"IPLTeam1","IPLTeam2")
9. Team Bowler vs Batsmen
teamBowlersVsBatsmenMatch(IPLTeam1_IPLTeam2,"IPLTeam1","IPLTeam2")
m <- teamBowlersVsBatsmenMatch(IPLTeam1_IPLTeam2,"IPLTeam1","IPLTeam2",plot=FALSE)
m
10. Match Worm chart
matchWormGraph(IPLTeam1_IPLTeam2,"IPLTeam1","IPLTeam2")
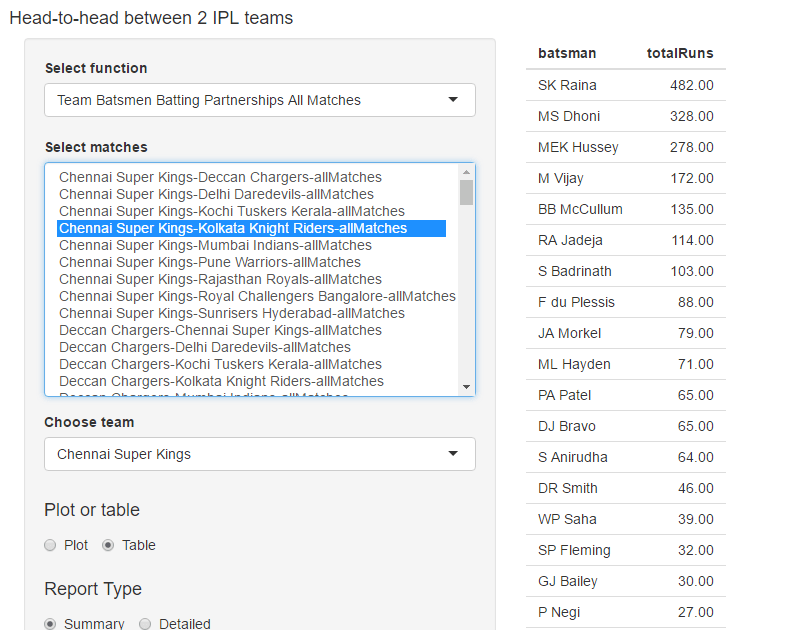
B) IPL Matches between 2 IPL teams
1 IPL Match Analysis
Load any match data from the ./IPLMatches folder for e.g. Chennai Super Kings-Deccan Chargers-2008-05-06.RData
setwd("./IPLMatches")
load("Chennai Super Kings-Deccan Chargers-2008-05-06.RData")
csk_dc<- overs
#The steps are
load("IPLTeam1-IPLTeam2-Date.Rdata")
IPLTeam1_IPLTeam2 <- overs
All analysis for this match can be done now
2. Scorecard
teamBattingScorecardMatch(IPLTeam1_IPLTeam2,"IPLTeam1")
teamBattingScorecardMatch(IPLTeam1_IPLTeam2,"IPLTeam2")
3.Batting Partnerships
teamBatsmenPartnershipMatch(IPLTeam1_IPLTeam2,"IPLTeam1","IPLTeam2")
teamBatsmenPartnershipMatch(IPLTeam1_IPLTeam2,"IPLTeam2","IPLTeam1")
4. Batsmen vs Bowler Plot
teamBatsmenVsBowlersMatch(IPLTeam1_IPLTeam2,"IPLTeam1","IPLTeam2",plot=TRUE)
teamBatsmenVsBowlersMatch(IPLTeam1_IPLTeam2,"IPLTeam1","IPLTeam2",plot=FALSE)
5. Team bowling scorecard
teamBowlingScorecardMatch(IPLTeam1_IPLTeam2,"IPLTeam1")
teamBowlingScorecardMatch(IPLTeam1_IPLTeam2,"IPLTeam2")
6. Team bowling Wicket kind match
teamBowlingWicketKindMatch(IPLTeam1_IPLTeam2,"IPLTeam1","IPLTeam2")
m <-teamBowlingWicketKindMatch(IPLTeam1_IPLTeam2,"IPLTeam1","IPLTeam2",plot=FALSE)
m
7. Team Bowling Wicket Runs Match
teamBowlingWicketRunsMatch(IPLTeam1_IPLTeam2,"IPLTeam1","IPLTeam2")
m <-teamBowlingWicketRunsMatch(IPLTeam1_IPLTeam2,"IPLTeam1","IPLTeam2",plot=FALSE)
m
8. Team Bowling Wicket Match
m <-teamBowlingWicketMatch(IPLTeam1_IPLTeam2,"IPLTeam1","IPLTeam2",plot=FALSE)
m
teamBowlingWicketMatch(IPLTeam1_IPLTeam2,"IPLTeam1","IPLTeam2")
9. Team Bowler vs Batsmen
teamBowlersVsBatsmenMatch(IPLTeam1_IPLTeam2,"IPLTeam1","IPLTeam2")
m <- teamBowlersVsBatsmenMatch(IPLTeam1_IPLTeam2,"IPLTeam1","IPLTeam2",plot=FALSE)
m
10. Match Worm chart
matchWormGraph(IPLTeam1_IPLTeam2,"IPLTeam1","IPLTeam2")
C) IPL Matches for a team against all other teams
1. IPL Matches for a team against all other teams
Load the data between for a IPL team against all other countries ./allMatchesAllOpposition for e.g all matches of Kolkata Knight Riders
load("allMatchesAllOpposition-Kolkata Knight Riders.RData")
kkr_matches <- matches
IPLTeam="IPLTeam1"
allMatches <- paste("allMatchesAllOposition-",IPLTeam,".RData",sep="")
load(allMatches)
IPLTeam1AllMatches <- matches
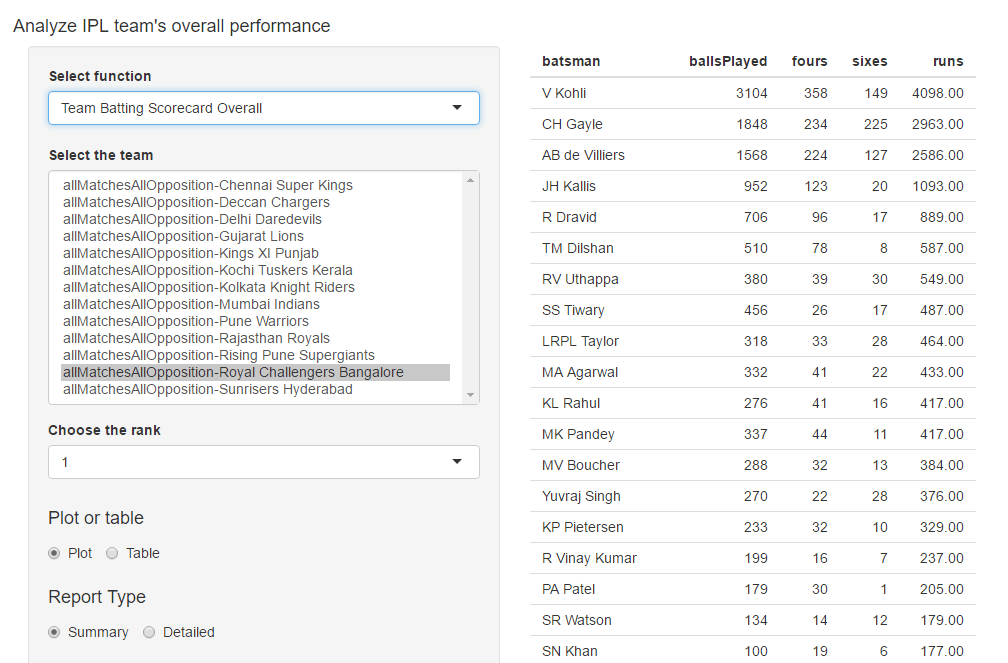
2. Team’s batting scorecard all Matches
m <-teamBattingScorecardAllOppnAllMatches(IPLTeam1AllMatches,theTeam="IPLTeam1")
m
3. Batting scorecard of opposing team
m <-teamBattingScorecardAllOppnAllMatches(matches=IPLTeam1AllMatches,theTeam="IPLTeam2")
4. Team batting partnerships
m <- teamBatsmenPartnershipAllOppnAllMatches(IPLTeam1AllMatches,theTeam="IPLTeam1")
m
m <- teamBatsmenPartnershipAllOppnAllMatches(IPLTeam1AllMatches,theTeam='IPLTeam1',report="detailed")
head(m,30)
m <- teamBatsmenPartnershipAllOppnAllMatches(IPLTeam1AllMatches,theTeam='IPLTeam1',report="summary")
m
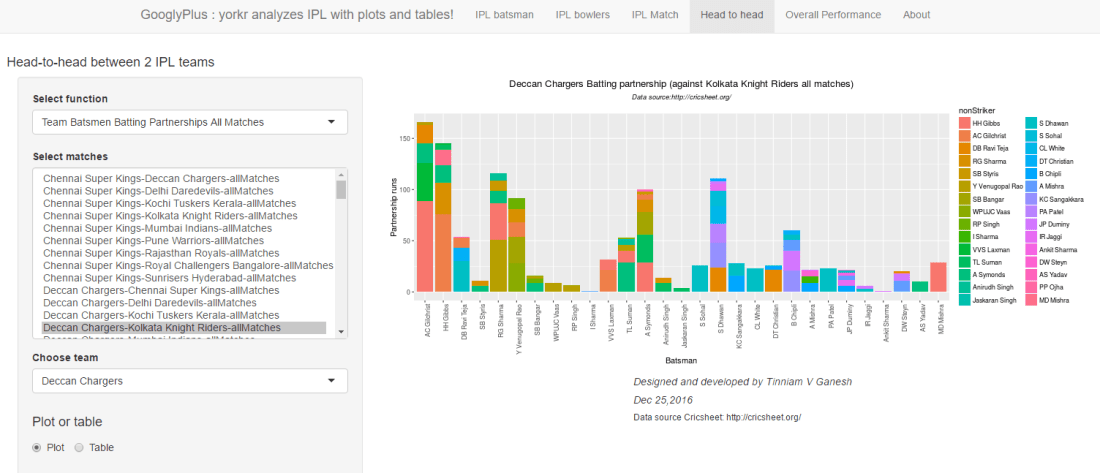
5. Team batting partnerships plot
teamBatsmenPartnershipAllOppnAllMatchesPlot(IPLTeam1AllMatches,"IPLTeam1",main="IPLTeam1")
teamBatsmenPartnershipAllOppnAllMatchesPlot(IPLTeam1AllMatches,"IPLTeam1",main="IPLTeam2")
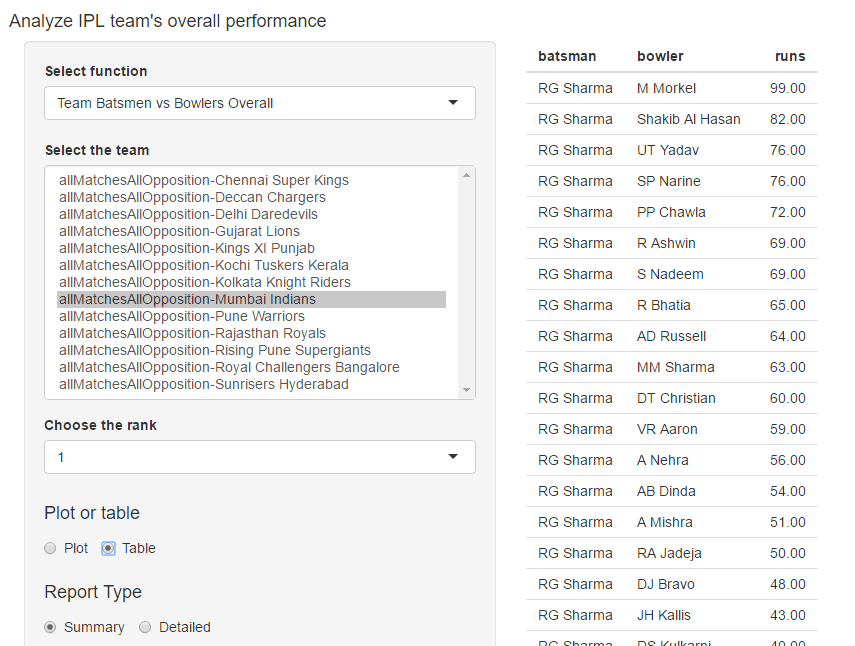
6, Team batsmen vs bowlers report
m <-teamBatsmenVsBowlersAllOppnAllMatchesRept(IPLTeam1AllMatches,"IPLTeam1",rank=0)
m
m <-teamBatsmenVsBowlersAllOppnAllMatchesRept(IPLTeam1AllMatches,"IPLTeam1",rank=1,dispRows=30)
m
m <-teamBatsmenVsBowlersAllOppnAllMatchesRept(matches=IPLTeam1AllMatches,theTeam="IPLTeam2",rank=1,dispRows=25)
m
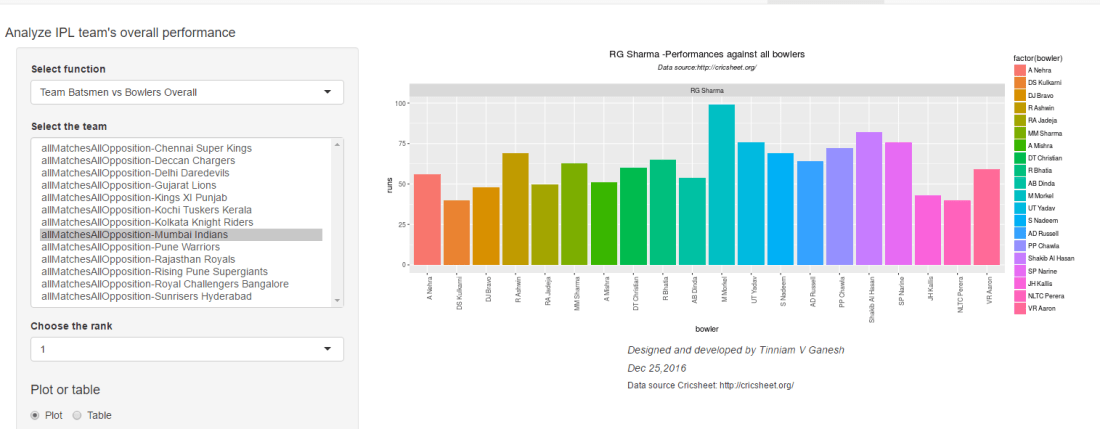
7. Team batsmen vs bowler plot
d <- teamBatsmenVsBowlersAllOppnAllMatchesRept(IPLTeam1AllMatches,"IPLTeam1",rank=1,dispRows=50)
d
teamBatsmenVsBowlersAllOppnAllMatchesPlot(d)
d <- teamBatsmenVsBowlersAllOppnAllMatchesRept(IPLTeam1AllMatches,"IPLTeam1",rank=2,dispRows=50)
teamBatsmenVsBowlersAllOppnAllMatchesPlot(d)
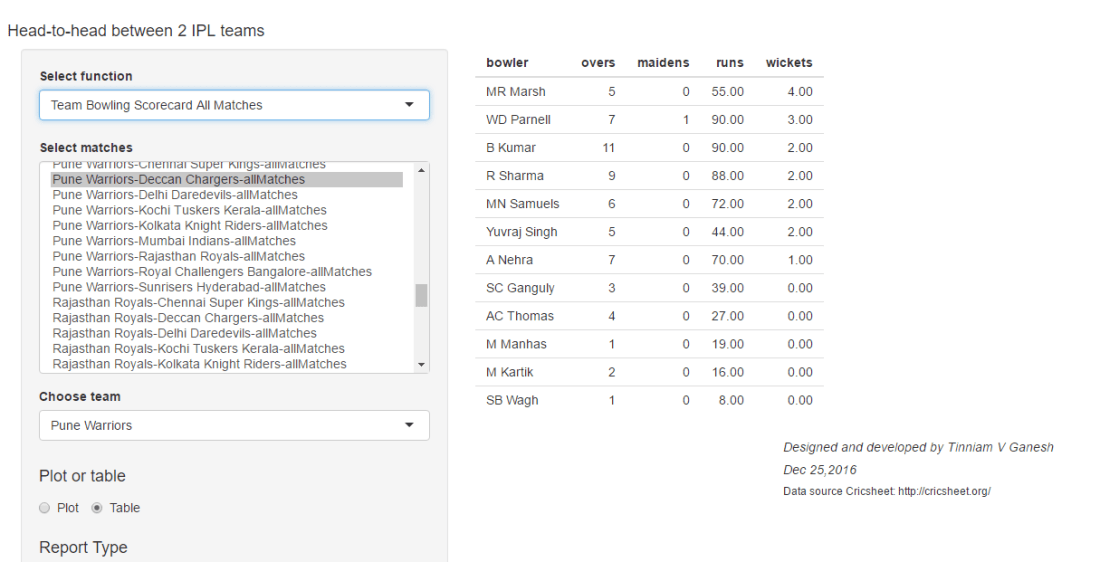
8. Team bowling scorecard
teamBowlingScorecardAllOppnAllMatchesMain(matches=IPLTeam1AllMatches,theTeam="IPLTeam1")
teamBowlingScorecardAllOppnAllMatches(IPLTeam1AllMatches,'IPLTeam2')
9. Team bowler vs batsmen
teamBowlersVsBatsmenAllOppnAllMatchesMain(IPLTeam1AllMatches,theTeam="IPLTeam1",rank=0)
teamBowlersVsBatsmenAllOppnAllMatchesMain(IPLTeam1AllMatches,theTeam="IPLTeam1",rank=2)
teamBowlersVsBatsmenAllOppnAllMatchesRept(matches=IPLTeam1AllMatches,theTeam="IPLTeam1",rank=0)
10. Team Bowler vs bastmen
df <- teamBowlersVsBatsmenAllOppnAllMatchesRept(IPLTeam1AllMatches,theTeam="IPLTeam1",rank=1)
teamBowlersVsBatsmenAllOppnAllMatchesPlot(df,"IPLTeam1","IPLTeam1")
11. Team bowler wicket kind
teamBowlingWicketKindAllOppnAllMatches(IPLTeam1AllMatches,t1="IPLTeam1",t2="All")
teamBowlingWicketKindAllOppnAllMatches(IPLTeam1AllMatches,t1="IPLTeam1",t2="IPLTeam2")
12.
teamBowlingWicketRunsAllOppnAllMatches(IPLTeam1AllMatches,t1="IPLTeam1",t2="All",plot=TRUE)
teamBowlingWicketRunsAllOppnAllMatches(IPLTeam1AllMatches,t1="IPLTeam1",t2="IPLTeam2",plot=TRUE)
1 IPL Batsman setup functions
Get the batsman’s details for a batsman
setwd("../BattingBowlingDetails")
# IPL Team names
IPLTeamNames <- list("Chennai Super Kings","Deccan Chargers", "Delhi Daredevils","Kings Xi Punjab",
                  "Kochi Tuskers Kerala","Kolkata Knight Riders","Mumbai Indians","Pune Warriors",
                  "Rajasthan Royals","Royal Challengers Bangalore","Sunrisers Hyderabad","Gujarat Lions",
                  "Rising Pune Supergiants")


# Check and get the team indices of IPL teams in which the batsman has played
getTeamIndex <- function(batsman){
    setwd("./BattingBowlingDetails")
    load("csk.RData")
    load("dc.RData")
    load("dd.RData")
    load("kxip.RData")
    load("ktk.RData")
    load("kkr.RData")
    load("mi.RData")
    load("pw.RData")
    load("rr.RData")
    load("rcb.RData")
    load("sh.RData")
    load("gl.RData")
    load("rps.RData")
    setwd("..")
    getwd()
    print(ls())
    teams_batsmen = list(csk_batsmen,dc_batsmen,dd_batsmen,kxip_batsmen,ktk_batsmen,kkr_batsmen,mi_batsmen,
                         pw_batsmen,rr_batsmen,rcb_batsmen,sh_batsmen,gl_batsmen,rps_batsmen)
    b <- NULL
    for (i in 1:length(teams_batsmen)){
        a <- which(teams_batsmen[[i]] == batsman)

        if(length(a) != 0)
            b <- c(b,i)
    }
    b
}

# Get the list of the IPL team names from the indices passed
getTeams <- function(x){

    l <- NULL
    # Get the teams passed in as indexes
    for (i in seq_along(x)){

        l <- c(l, IPLTeamNames[[x[i]]])

    }
    l
}

# Create a consolidated data frame with all teams the IPL batsman has played for
getIPLBatsmanDF <- function(teamNames){
    batsmanDF <- NULL
   # Create a consolidated Data frame of batsman for all IPL teams played
    for (i in seq_along(teamNames)){
       df <- getBatsmanDetails(team=teamNames[i],name=IPLBatsman,dir="./BattingBowlingDetails")
       batsmanDF <- rbind(batsmanDF,df)

    }
    batsmanDF
}
2. Create a consolidated IPL batsman data frame
# Since an IPL batsman coculd have played in multiple teams we need to determine these teams and
# create a consolidated data frame for the analysis
# For example to check MS Dhoni we need to do the following

IPLBatsman = "MS Dhoni"
#Check and get the team indices of IPL teams in which the batsman has played
i <- getTeamIndex(IPLBatsman)

# Get the team names in which the IPL batsman has played
teamNames <- getTeams(i)
    # Check if file exists in the directory. This check is necessary when moving between matchType


############## Create a consolidated IPL batsman dataframe for analysis
batsmanDF <- getIPLBatsmanDF(teamNames)
3. Runs vs deliveries
# For e.g. batsmanName="MS Dhoni""
#batsmanRunsVsDeliveries(batsmanDF, "MS Dhoni")
batsmanRunsVsDeliveries(batsmanDF,"batsmanName")
4. Batsman 4s & 6s
batsman46 <- select(batsmanDF,batsman,ballsPlayed,fours,sixes,runs)
p1 <- batsmanFoursSixes(batsman46,"batsmanName")
5. Batsman dismissals
batsmanDismissals(batsmanDF,"batsmanName")
6. Runs vs Strike rate
batsmanRunsVsStrikeRate(batsmanDF,"batsmanName")
7. Batsman Moving Average
batsmanMovingAverage(batsmanDF,"batsmanName")
8. Batsman cumulative average
batsmanCumulativeAverageRuns(batsmanDF,"batsmanName")
9. Batsman cumulative strike rate
batsmanCumulativeStrikeRate(batsmanDF,"batsmanName")
10. Batsman runs against oppositions
batsmanRunsAgainstOpposition(batsmanDF,"batsmanName")
11. Batsman runs vs venue
batsmanRunsVenue(batsmanDF,"batsmanName")
12. Batsman runs predict
batsmanRunsPredict(batsmanDF,"batsmanName")
13.Bowler set up functions
setwd("../BattingBowlingDetails")
# IPL Team names
IPLTeamNames <- list("Chennai Super Kings","Deccan Chargers", "Delhi Daredevils","Kings Xi Punjab",
                  "Kochi Tuskers Kerala","Kolkata Knight Riders","Mumbai Indians","Pune Warriors",
                  "Rajasthan Royals","Royal Challengers Bangalore","Sunrisers Hyderabad","Gujarat Lions",
                  "Rising Pune Supergiants")


# Get the team indices of IPL teams for which the bowler as played
getTeamIndex_bowler <- function(bowler){
    # Load IPL Bowlers
    setwd("./data")
    load("csk1.RData")
    load("dc1.RData")
    load("dd1.RData")
    load("kxip1.RData")
    load("ktk1.RData")
    load("kkr1.RData")
    load("mi1.RData")
    load("pw1.RData")
    load("rr1.RData")
    load("rcb1.RData")
    load("sh1.RData")
    load("gl1.RData")
    load("rps1.RData")
    setwd("..")
    teams_bowlers = list(csk_bowlers,dc_bowlers,dd_bowlers,kxip_bowlers,ktk_bowlers,kkr_bowlers,mi_bowlers,
                         pw_bowlers,rr_bowlers,rcb_bowlers,sh_bowlers,gl_bowlers,rps_bowlers)
    b <- NULL
    for (i in 1:length(teams_bowlers)){
        a <- which(teams_bowlers[[i]] == bowler)
        if(length(a) != 0){
            b <- c(b,i)
        }
    }
    b
}


# Get the list of the IPL team names from the indices passed
getTeams <- function(x){

    l <- NULL
    # Get the teams passed in as indexes
    for (i in seq_along(x)){

        l <- c(l, IPLTeamNames[[x[i]]])

    }
    l
}

# Get the team names
teamNames <- getTeams(i)

getIPLBowlerDF <- function(teamNames){
    bowlerDF <- NULL

    # Create a consolidated Data frame of batsman for all IPL teams played
    for (i in seq_along(teamNames)){
          df <- getBowlerWicketDetails(team=teamNames[i],name=IPLBowler,dir="./BattingBowlingDetails")
          bowlerDF <- rbind(bowlerDF,df)

    }
    bowlerDF
}
14. Get the consolidated data frame for an IPL bowler
# Since an IPL bowler could have played in multiple teams we need to determine these teams and
# create a consolidated data frame for the analysis
# For example to check R Ashwin we need to do the following

IPLBowler = "R Ashwin"
#Check and get the team indices of IPL teams in which the batsman has played
i <- getTeamIndex(IPLBowler)

# Get the team names in which the IPL batsman has played
teamNames <- getTeams(i)
    # Check if file exists in the directory. This check is necessary when moving between matchType


############## Create a consolidated IPL batsman dataframe for analysis
bowlerDF <- getIPLBowlerDF(teamNames)
15. Bowler Mean Economy rate
# For e.g. to get the details of R Ashwin do
#bowlerMeanEconomyRate(bowlerDF,"R Ashwin")
bowlerMeanEconomyRate(bowlerDF,"bowlerName")
16. Bowler mean runs conceded
bowlerMeanRunsConceded(bowlerDF,"bowlerName")
17. Bowler Moving Average
bowlerMovingAverage(bowlerDF,"bowlerName")
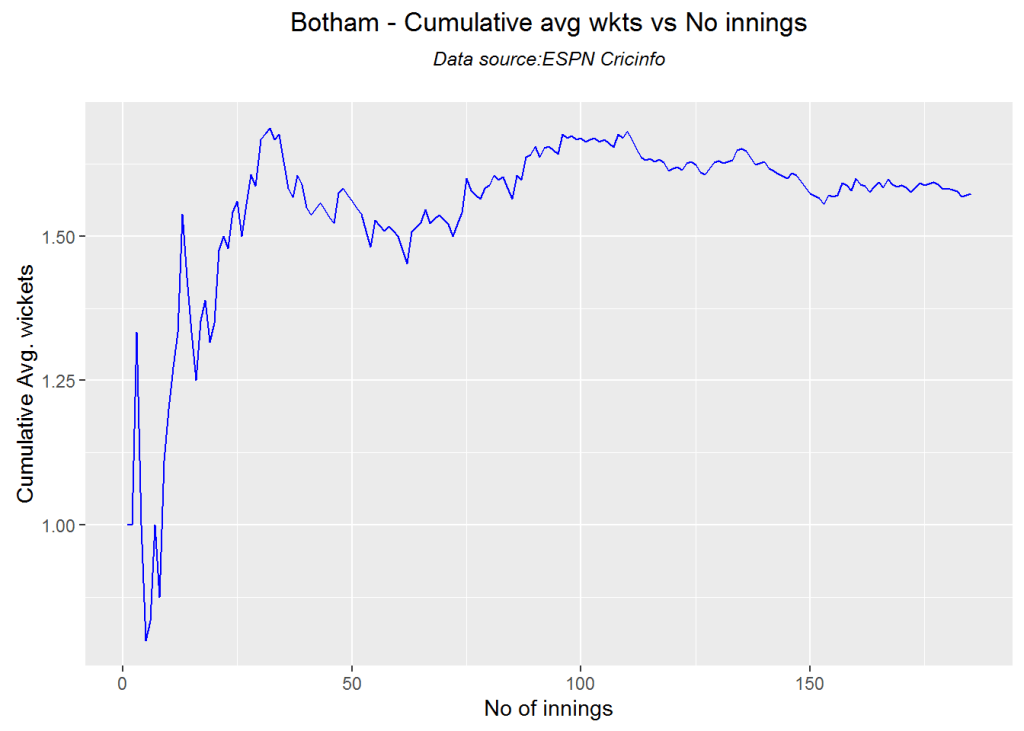
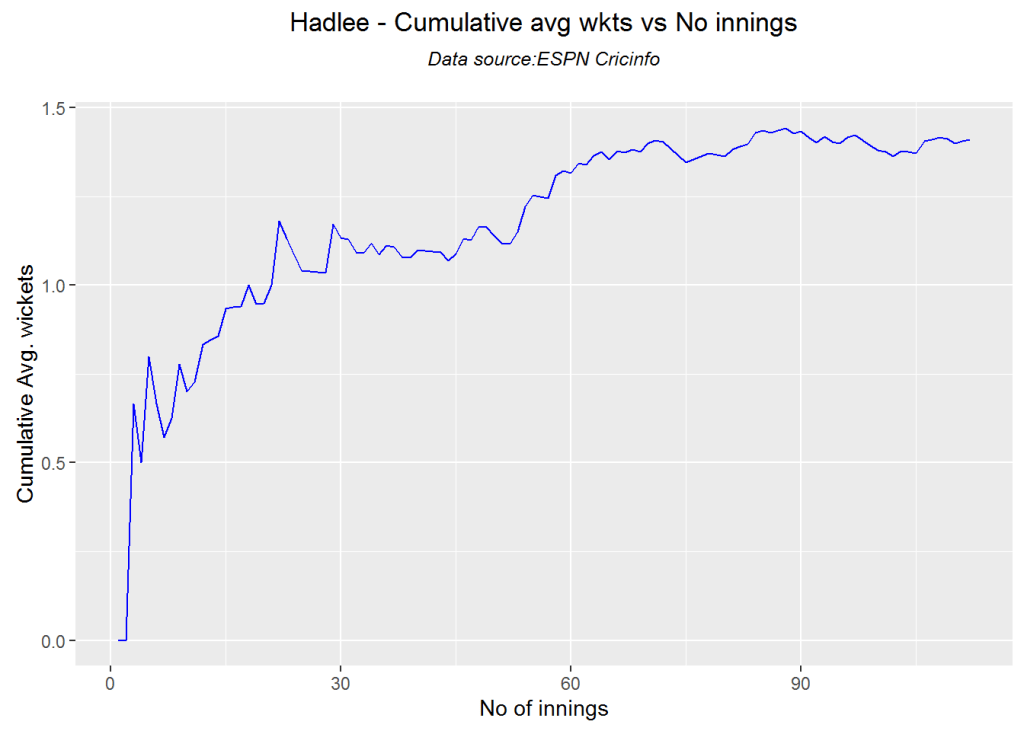
18. Bowler cumulative average wickets
bowlerCumulativeAvgWickets(bowlerDF,"bowlerName")
19. Bowler cumulative Economy Rate (ER)
bowlerCumulativeAvgEconRate(bowlerDF,"bowlerName")
20. Bowler wicket plot
bowlerWicketPlot(bowlerDF,"bowlerName")
21. Bowler wicket against opposition
bowlerWicketsAgainstOpposition(bowlerDF,"bowlerName")
22. Bowler wicket at cricket grounds
bowlerWicketsVenue(bowlerDF,"bowlerName")
23. Predict number of deliveries to wickets
setwd("./IPLMatches")
bowlerDF1 <- getDeliveryWickets(team="IPLTeam1",dir=".",name="bowlerName",save=FALSE)
bowlerWktsPredict(bowlerDF1,"bowlerName")
You may like
1. Using Linear Programming (LP) for optimizing bowling change or batting lineup in T20 cricket
2. Neural Networks: The mechanics of backpropagation
3. More book, more cricket! 2nd edition of my books now on Amazon
4. Spicing up a IBM Bluemix cloud app with MongoDB and NodeExpress
5. Introducing cricket package yorkr:Part 4-In the block hole!