IPL 2023:GooglyPlusPlus now with by AI/ML models, near real-time analytics!

It is carnival time again as IPL 2023 is underway!! The new GooglyPlusPlus now includes AI/ML models for computing ball-by-ball Win Probability of matches and each individual player’s Win Probability Contribution (WPC). GooglyPlusPlus uses 2 ML models

  • Deep Learning (Tensorflow) – accuracy : 0.8584
  • Logistic Regression (glmnet-tidymodels) : 0.728

Besides, as before, GooglyPlusPlus will also include the usual near real-time analytics with the Shiny app being automatically updated with the previous day’s match data.

Note: The Win Probability Computation can also be done on a live feed of streaming data. Since, I don’t have access to live feeds, the app will show how Win Probability changed during the course of completed matches. For more details on Win Probability and Win Probability Contribution see my posts

GooglyPlusPlus has been also updated with all the latest T20 league’s match data. It includes data from BBL 2022, NTB 2022, CPL 2022, PSL 2023, ICC T20 2022 and now IPL 2023.

GooglyPlusPlus has the following functionality

  • Batsman tab: For detailed analysis of batsmen
  • Bowler tab: For detailed analysis of bowlers
  • Match tab: Analysis of individual matches, plot of Runs vs SR, Wickets vs ER in power play, middle and death overs, Win Probability Analysis of teams and Win Probability Contribution of players
  • Head-to-head tab: Detailed analysis of team-vs-team batting/bowling scorecard, batting, bowling performances, performances in power play, middle and death overs
  • Team performance tab: Analysis of team-vs-all other teams with batting /bowling scorecard, batting, bowling performances, performances in power play, middle and death overs
  • Optimisation tab: Allows one to pit batsmen vs bowlers and vice-versa. This tab also uses integer programming to optimise batting and bowling lineup
  • Batting analysis tab: Ranks batsmen using Runs or SR. Also plots performances of batsmen in power play, middle and death overs and plots them in a 4×4 grid
  • Bowling analysis tab: Ranks bowlers based on Wickets or ER. Also plots performances of bowlers in power play, middle and death overs and plots them in a 4×4 grid

Also note all these tabs and features are available for all T20 formats namely IPL, Intl. T20 (men, women), BBL, NTB, PSL, CPL, SSM.

Important note: It is possible, that at times, the Win Probability (Deep Learning) for some recent IPL matches will give an error. This is because I need to rebuild the models on a daily basis as the matches use player embeddings and there are new players. While I will definitely rebuild the models on weekends and whenever I find time, you may have to bear with this error occasionally.

Note: All charts are interactive, which means that you can hover, zoom-in, zoom-out, pan etc on the charts

The latest avatar of GooglyPlusPlus2023 is based on my R package yorkr with data from Cricsheet.

Check out the latest version of GooglyPlusPlus

Follow me on twitter for daily highlights @tvganesh_85

GooglyPlusPlus can analyse players, matches, teams, rank, compute win probability and much more.

Included below are some random analyses of IPL 2023 matches so far

A) Chennai Super Kings vs Gujarat Titans – 31 Mar 2023

GT won by 5 wickets ( 4 balls remaining)

a) Worm Wicket Chart

b) Ball-by-ball Win Probability (Logistic Regression) (side-by-side)

This model shows that CSK had the upper hand in the 2nd last over, before it changed to GT. More details on Win Probability and Win Probability Contribution in the posts given by the links above.

c) b) Ball-by-ball Win Probability (Logistic Regression) (overlapping)

Here the ball-by-ball win probability is overlapped. CSK and GT both had nearly the same probability of winning in the 2nd last over before GT edges CSK out

B) Punjab Kings vs Rajasthan Royals – 05 Apr 2023

This was a another closely fought match. PBKS won by 5 runs

a) Worm wicket chart

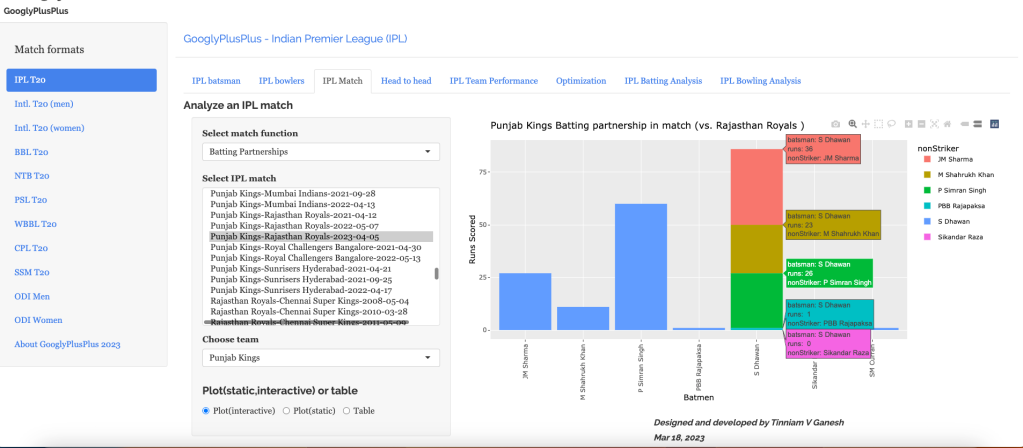
b) Batting partnerships

Shikhar Dhawan scored 86 runs
c) Ball-by-ball Win Probability using Deep Learning (overlapping)

PBKS was generally ahead in the win probability race

d) Batsman Win Probability Contribution

This plot shows how the different batsmen contributed to the Win Probability. We can see that Shikhar Dhawan has a highest win probability. He played a very sensible innings. Also it appears that there is no difference between Prabhsimran Singh and others, though he score 60 runs. This computation is based on when they come to bat and how the win probability changes when they get dismissed, as seen in the 2nd chart

C) Delhi Capitals vs Gujarat Titans – 4 Apr 2023

GT won by 6 wickets (11 balls remaining)

a) Worm wicket chart

b) Runs scored across 20 overs

c) Runs vs SR plot

d) Batting scorecard (Gujarat Titans)

e) Batsman Win Probability Contribution (Gujarat Titans)

Miller has a higher percentage in the Win Contribution than Sai Sudershan who held the innings together.Strange are the ways of the ML models!!

D) Sunrisers Hyderabad vs Lucknow Supergiants ( 7 Apr 2023)

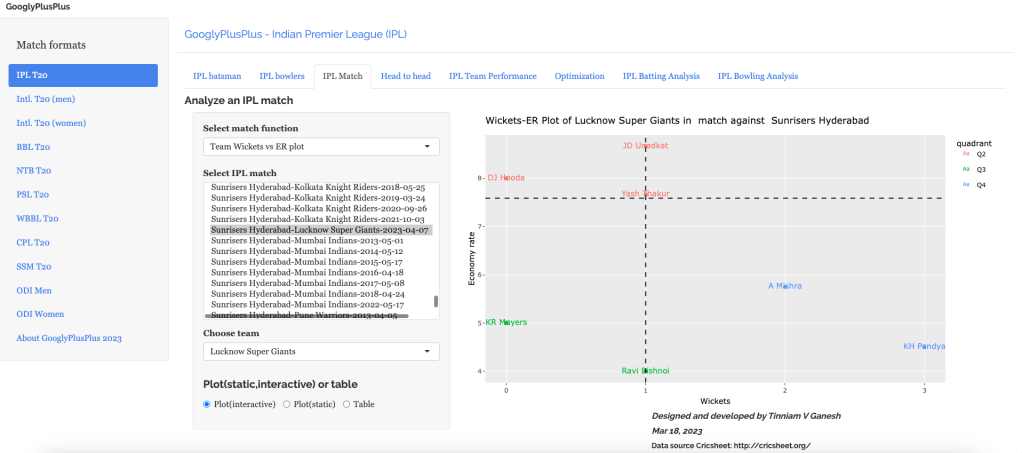
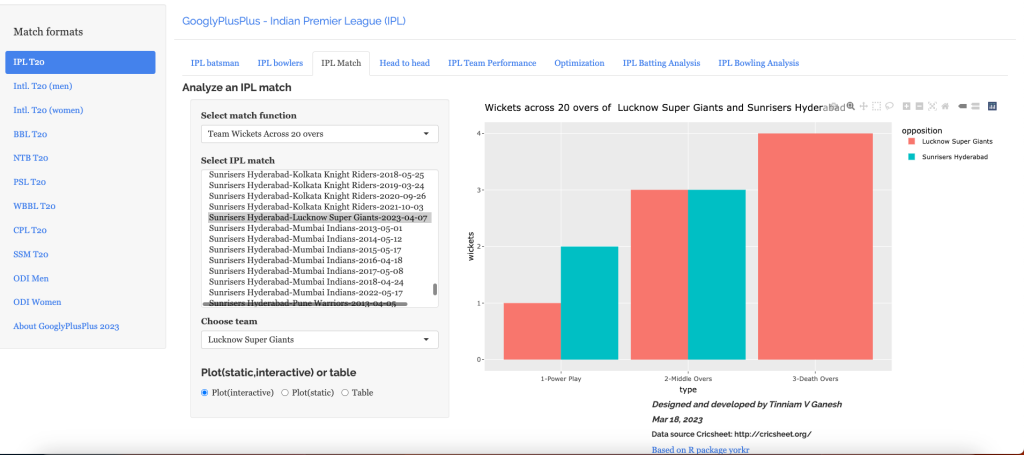
LSG won by 5 wickets (24 balls left). SRH were bamboozled by the pitch while LSG was able to cruise along

a) Worm wicket chart

b) Wickets vs ER plot
c) Wickets across 20 overs
d) Ball-by-ball win probability using Deep Learning (overlapping)

e) Bowler Win Probability Contribution (LSG)

Bishnoi has a higher win probability contribution than Krunal, though he just took 1 wicket to Krunal’s 3 wickets. This is based on how the Win Probability changed at that point in the game.

The above set of plots are just a random sample.

Note: There are 8 tabs each for 9 T20 leagues (BBL, CPL, T20 (men), T20 (women), IPL, PSL, NTB, SSM, WBB). So there are a lot more detailed charts/analses.

Do take GooglyPlusPlus for a test drive!!!

Follow me on twitter @tvganesh_85 for daily highlights of previous day matches

Take a look at some of my other posts

  1. Using Reinforcement Learning to solve Gridworld
  2. Deep Learning from first principles in Python, R and Octave – Part 6
  3. Big Data-4: Webserver log analysis with RDDs, Pyspark, SparkR and SparklyR
  4. Experiments with deblurring using OpenCV
  5. Singularity
  6. Practical Machine Learning with R and Python – Part 6
  7. Pitching yorkpy … short of good length to IPL – Part 1
  8. Analyzing performances of cricketers using cricketr template
  9. Cricpy takes guard for the Twenty20s
  10. Simulating an Edge Shape in Android

To see all posts click Index of posts

Introducing GooglyPlusPlus!!!

“We can lift ourselves out of ignorance, we can find ourselves as creatures of excellence and intelligence and skill.”
“Heaven is not a place, and it is not a time. Heaven is being perfect.”
“Your whole body, from wingtip to wingtip, is nothing more than your thought itself, in a form you can see. Break the chains of your thought, and you break the chains of your body, too.”

From Jonathan Livingstone Seagull, by Richard Bach

Introduction

The metamorphosis is complete, from eggs to the butterfly! My R package yorkr, went on to become Googly,  and then to GooglyPlus and  now finally GooglyPlusPlus. My latest R Shiny app now provides interactive visualisation of almost all data in Cricsheet. GooglyPlusPlus visualizes the following matches

1. ODI (men)
2. ODI (women)
3. Intl. T20 (men)
4. Intl T20 (women)
5. IPL (Indian Premier League)
6. BBL (Big Bash League)
7. NTB (Natwest T20)
8. PSL (Pakistan Super League)
9. WBBL – Women’s BBL

GooglyPlusPlus is entirely based on my R package yorkr. To know more about yorkr see ‘Revitalizing R package yorkr‘ and the roughly 25+ posts on yorkr in Index of posts

This Shiny app was quite involved, and it took a lot of work to keep things organised and separate for the different forms of cricket. Anyway it is done and I am happy with the outcome.

Before you use the app, I would suggest that you take a look at the video “How to use GooglyPlusPlus?“. In this video, I show the different features of GooglyPlusPlus and how to navigate through them.

Check out GooglyPlusPlus Shiny at GooglyPlusPlus

You can clone/fork and play around with the code of GooglyPlusPlus here at Github

A. Highlights of GooglyPlusPlus.

The R Shiny app GooglyPlusPlus has the following main pages for the 9 different cricket formats. See below


Important note: Below I will be including some random output from the GooglyPlusPlus app for different match formats, however there is a lot more features in GooglyPlusPlus

1.  Indian Premier League (IPL)

a. IPL batsman – Batsman Runs vs Deliveries


b. IPL Match – Match  batting scorecard


c. Head-to-head between 2 IPL Teams – Team Batsmen Batting Partnership All Matches


d. Overall Performance – Team Bowling Scorecard Overall


2. International T20 Men

a. Batsman Function- Runs vs Strike rate


b. Bowler Function – Mean Economy Rate


3. International T20 (Women)

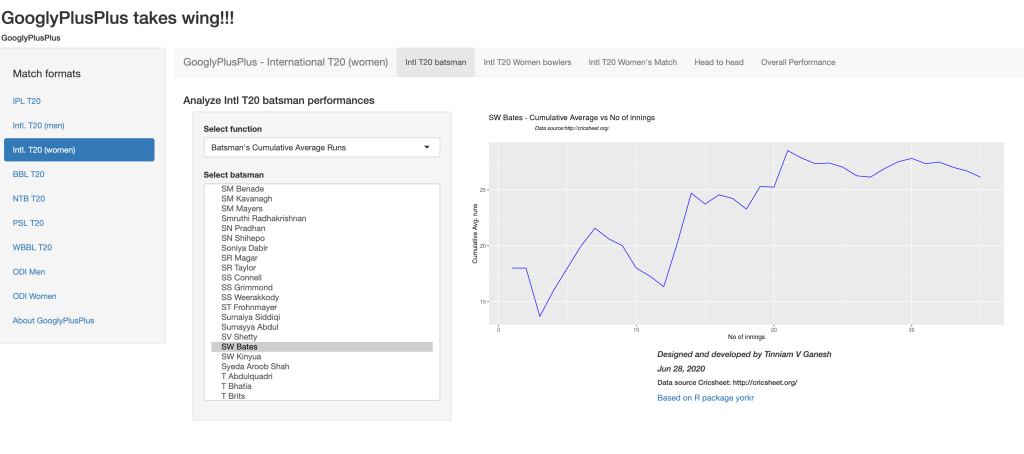
a.Batsman Functions – Batsman Cumulative Average Runs


b. Intl T20 Women’s match – Match worm Graph


4. Big Bash League (BBL)

a.Head-to-Head: Team batsmen batting partnerships


b.  Overall Performance – Team batsmen vs bowlers


5. Natwest T20 (NTB)

a. Head-to-head : Team bowlers vs batsmen


b. Batsman Runs vs Deliveries


6. Pakistan Super League (PSL)

a. Overall Performance – Batsmen Partnership


b. Bowling Scorecard


7. Women’s Big Bash League (WBBL)

a. Bowler wicket against opposition


8. One Day International (ODI) Men

a. Batsman Runs Against Opposition


b. Team Batsmen against bowlers


9. One Day International (ODI) women)

a. Match Batting Scorecard

b. Batsman Cumulative Strike Rate


Conclusion

There you have it. I have randomly shown  2 functions for each cricket format. There are many functions in each tab for the for the different match formats – namely IPL, BBL, Intl T20 (men,women), PSL etc.  Go ahead and give GooglyPlusPlus a spin!

To try out GooglyPlusPlus click GooglyPlusPlus. Don’t forget to check out the video How to use GooglyPlusPlus?

You can clone/fork the code from Github at GooglyPlusPlus

Hope you have fun with GooglyPlusPlus!!

You may also like

1. Big Data 6: The T20 Dance of Apache NiFi and yorkpy
2. Deep Learning from first principles in Python, R and Octave – Part 7
3. De-blurring revisited with Wiener filter using OpenCV
4. Exploring Quantum Gate operations with QCSimulator
5. Latency, throughput implications for the Cloud
6. Programming Zen and now – Some essential tips-2
7. The Anomaly
8. Practical Machine Learning with R and Python – Part 3
9. Introducing cricpy:A python package to analyze performances of cricketers
10. The making of Total Control Android game

To see all posts click Index of posts

My 3 video presentations on “Essential R”

In this post I include my  3 video presentations on the topic “Essential R”. In these 3 presentations I cover the entire landscape of R. I cover the following

  • R Language – The essentials
  • Key R Packages (dplyr, lubridate, ggplot2, etc.)
  • How to create R Markdown and share reports
  • A look at Shiny apps
  • How to create a simple R package

You can download the relevant slide deck and practice code at Essential R

Essential R – Part 1
This video cover basic R data types – character, numeric, vectors, matrices, lists and data frames. It also touches on how to subset these data types

Essential R – Part 2
This video continues on how to subset dataframes (the most important data type) and some important packages. It also presents one of the most important job of a Data Scientist – that of cleaning and shaping the data. This is done with an example unclean data frame. It also  touches on some  key operations of dplyr like select, filter, arrange, summarise and mutate. Other packages like lubridate, quantmod are also included. This presentation also shows how to use base plot and ggplot2

Essential R – Part 3
This final session covers R Markdown , and  touches on some of the key markdown elements. There is a brief overview of a simple Shiny app. Finally this presentation also shows the key steps to create an R package

These 3 R sessions cover most of the basic R topics that we tend to use in a our day-to-day R way of life. With this you should be able to hit the ground running!

Hope you enjoy these video presentation and also hope you have an even greater time with R!

Check out my 2 books on cricket, a) Cricket analytics with cricketr b) Beaten by sheer pace – Cricket analytics with yorkr, now available in both paperback & kindle versions on Amazon!!! Pick up your copies today!

Also see
1. Introducing QCSimulator: A 5-qubit quantum computing simulator in R
2. Computer Vision: Ramblings on derivatives, histograms and contours
3. Designing a Social Web Portal
4. Revisiting Whats up, Watson – Using Watson’s Question and Answer with Bluemix – Part 2
5. Re-introducing cricketr! : An R package to analyze performances of cricketers

To see all my posts click – Index of posts

GooglyPlus: yorkr analyzes IPL players, teams, matches with plots and tables

In this post I introduce my new Shiny app,“GooglyPlus”, which is a  more evolved version of my earlier Shiny app “Googly”. My R package ‘yorkr’,  on which both these Shiny apps are based, has the ability to output either a dataframe or plot, depending on a parameter plot=TRUE or FALSE. My initial version of the app only included plots, and did not exercise the yorkr package fully. Moreover, I am certain, there may be a set of cricket aficionados who would prefer, numbers to charts. Hence I have created this enhanced version of the Googly app and appropriately renamed it as GooglyPlus. GooglyPlus is based on the yorkr package which uses data from Cricsheet. The app is based on IPL data from  all IPL matches from 2008 up to 2016. Feel free to clone/fork or download the code from Github at GooglyPlus.

If you are passionate about cricket, and love analyzing cricket performances, then check out my 2 racy books on cricket! In my books, I perform detailed yet compact analysis of performances of both batsmen, bowlers besides evaluating team & match performances in Tests , ODIs, T20s & IPL. You can buy my books on cricket from Amazon at $12.99 for the paperback and $4.99/$6.99 respectively for the kindle versions. The books can be accessed at Cricket analytics with cricketr  and Beaten by sheer pace-Cricket analytics with yorkr  A must read for any cricket lover! Check it out!!

1


Click  GooglyPlus to access the Shiny app!

The changes for GooglyPlus over the earlier Googly app is only in the following 3 tab panels

  • IPL match
  • Head to head
  • Overall Performance

The analysis of IPL batsman and IPL bowler tabs are unchanged. These charts are as they were before.

The changes are only in  tabs i) IPL match ii) Head to head and  iii) Overall Performance. New functionality has been added and existing functions now have the dual option of either displaying a plot or a table.

The changes are

A) IPL Match
The following additions/enhancements have been done

-Match Batting Scorecard – Table
-Batting Partnerships – Plot, Table (New)
-Batsmen vs Bowlers – Plot, Table(New)
-Match Bowling Scorecard   – Table (New)
-Bowling Wicket Kind – Plot, Table (New)
-Bowling Wicket Runs – Plot, Table (New)
-Bowling Wicket Match – Plot, Table (New)
-Bowler vs Batsmen – Plot, Table (New)
-Match Worm Graph – Plot

B) Head to head
The following functions have been added/enhanced

-Team Batsmen Batting Partnerships All Matches – Plot, Table {Summary (New) and Detailed (New)}
-Team Batting Scorecard All Matches – Table (New)
-Team Batsmen vs Bowlers all Matches – Plot, Table (New)
-Team Wickets Opposition All Matches – Plot, Table (New)
-Team Bowling Scorecard All Matches – Table (New)
-Team Bowler vs Batsmen All Matches – Plot, Table (New)
-Team Bowlers Wicket Kind All Matches – Plot, Table (New)
-Team Bowler Wicket Runs All Matches – Plot, Table (New)
-Win Loss All Matches – Plot

C) Overall Performance
The following additions/enhancements have been done in this tab

-Team Batsmen Partnerships Overall – Plot, Table {Summary (New) and Detailed (New)}
-Team Batting Scorecard Overall –Table (New)
-Team Batsmen vs Bowlers Overall – Plot, Table (New)
-Team Bowler vs Batsmen Overall – Plot, Table (New)
-Team Bowling Scorecard Overall – Table (New)
-Team Bowler Wicket Kind Overall – Plot, Table (New)

Included below are some random charts and tables. Feel free to explore the Shiny app further

1) IPL Match
a) Match Batting Scorecard (Table only)
This is the batting score card for the Chennai Super Kings & Deccan Chargers 2011-05-11

untitled

b)  Match batting partnerships (Plot)
Delhi Daredevils vs Kings XI Punjab – 2011-04-23

untitled

c) Match batting partnerships (Table)
The same batting partnership  Delhi Daredevils vs Kings XI Punjab – 2011-04-23 as a table

untitled

d) Batsmen vs Bowlers (Plot)
Kolkata Knight Riders vs Mumbai Indians 2010-04-19

Untitled.png

e)  Match Bowling Scorecard (Table only)
untitled

B) Head to head

a) Team Batsmen Partnership (Plot)
Deccan Chargers vs Kolkata Knight Riders all matches

untitled

b)  Team Batsmen Partnership (Summary – Table)
In the following tables it can be seen that MS Dhoni has performed better that SK Raina  CSK against DD matches, whereas SK Raina performs better than Dhoni in CSK vs  KKR matches

i) Chennai Super Kings vs Delhi Daredevils (Summary – Table)

untitled

ii) Chennai Super Kings vs Kolkata Knight Riders (Summary – Table)
untitled

iii) Rising Pune Supergiants vs Gujarat Lions (Detailed – Table)
This table provides the detailed partnership for RPS vs GL all matches

untitled

c) Team Bowling Scorecard (Table only)
This table gives the bowling scorecard of Pune Warriors vs Deccan Chargers in all matches

untitled

C) Overall performances
a) Batting Scorecard All Matches  (Table only)

This is the batting scorecard of Royal Challengers Bangalore. The top 3 batsmen are V Kohli, C Gayle and AB Devilliers in that order

untitled

b) Batsman vs Bowlers all Matches (Plot)
This gives the performance of Mumbai Indian’s batsman of Rank=1, which is Rohit Sharma, against bowlers of all other teams

untitled

c)  Batsman vs Bowlers all Matches (Table)
The above plot as a table. It can be seen that Rohit Sharma has scored maximum runs against M Morkel, then Shakib Al Hasan and then UT Yadav.

untitled

d) Bowling scorecard (Table only)
The table below gives the bowling scorecard of CSK. R Ashwin leads with a tally of 98 wickets followed by DJ Bravo who has 88 wickets and then JA Morkel who has 83 wickets in all matches against all teams

Untitled.png

This is just a random selection of functions. Do play around with the app and checkout how the different IPL batsmen, bowlers and teams stack against each other. Do read my earlier post Googly: An interactive app for analyzing IPL players, matches and teams using R package yorkr  for more details about the app and other functions available.

Click GooglyPlus to access the Shiny app!

You can clone/fork/download the code from Github at GooglyPlus

Hope you have fun playing around with the Shiny app!

Note: In the tabs, for some of the functions, not all controls  are required. It is possible to enable the controls selectively but this has not been done in this current version. I may make the changes some time in the future.

Take a look at my other Shiny apps
a.Revisiting crimes against women in India
b. Natural language processing: What would Shakespeare say?

Check out some of my other posts
1. Analyzing World Bank data with WDI, googleVis Motion Charts
2. Video presentation on Machine Learning, Data Science, NLP and Big Data – Part 1
3. Singularity
4. Design principles of scalable, distributed systems
5. Simulating an Edge shape in Android
6. Dabbling with Wiener filter in OpenCV

To see all posts click Index of Posts

Sixer – R package cricketr’s new Shiny avatar

Published in R-bloggers: Sixer – R package cricketr’s new Shiny app

In this post I create a Shiny App, Sixer, based on my R package cricketr. I had developed the R package cricketr, a few months back for analyzing the performances of batsman and bowlers in all formats of the game (Test, ODI and Twenty 20). This package uses the statistics info available in ESPN Cricinfo Statsguru. I had written a series of posts using the cricketr package where I chose a few batsmen, bowlers and compared their performances of these players. Here I have created a complete Shiny app with a lot more players and with almost all the features of the cricketr package. The motivation for creating the Shiny app was to

  • To show case the  ‘cricketr’ package and to highlight its functionalities
  • Perform analysis of more batsman and bowlers
  • Allow users to interact with the package and to allow them to try out the different features and functions of the package and to also check performances of some of their favorite crickets

If you are passionate about cricket, and love analyzing cricket performances, then check out my racy book on cricket ‘Cricket analytics with cricketr and cricpy – Analytics harmony with R & Python’! This book discusses and shows how to use my R package ‘cricketr’ and my Python package ‘cricpy’ to analyze batsmen and bowlers in all formats of the game (Test, ODI and T20). The paperback is available on Amazon at $21.99 and  the kindle version at $9.99/Rs 449/-. A must read for any cricket lover! Check it out!!

Untitled


$4.99/Rs 320 and $6.99/Rs448 respectively

Important note 1: The latest release of ‘cricketr’ now includes the ability to analyze performances of teams now!!  See Cricketr adds team analytics to its repertoire!!!

Important note 2 : Cricketr can now do a more fine-grained analysis of players, see Cricketr learns new tricks : Performs fine-grained analysis of players

Important note 3: Do check out the python avatar of cricketr, ‘cricpy’ in my post ‘Introducing cricpy:A python package to analyze performances of cricketers

a) You can try out the interactive  Shiny app Sixer at – Sixer
b) The code for this Shiny app project can be cloned/forked from GitHub – Sixer
Note: Please be mindful of  ESPN Cricinfo Terms of Use.
(Take a look at my short video tutorial on my R package cricketr on Youtube – R package cricketr – A short tutorial)

Important note: Do check out my other posts using cricketr at cricketr-posts

In this Shiny app I have 5 tabs which perform the following function
1.  Analyze Batsman
This tab analyzes batsmen based on different functions and plots the performances of the selected batsman. There are functions that compute and display batsman’s run-frequency ranges, Mean Strike rate, No of 4’s, dismissals, 3-D plot of Runs scored vs Balls Faced and Minutes at crease, Contribution to wins & losses, Home-Away record etc. The analyses can be done for Test cricketers, ODI and Twenty 20 batsman. I have included most of the Test batting giants including Tendulkar, Dravid, Sir Don Bradman, Viv Richards, Lara, Ponting etc. Similarly the ODI list includes Sehwag, Devilliers, Afridi, Maxwell etc. The Twenty20 list includes the Top 10 Twenty20 batsman based on their ICC rankings

2. Analyze bowler
This tab analyzes the bowling performances of bowlers, Wickets percentages, Mean Economy Rate, Wickets at different venues, Moving average of wickets etc. As earlier I have all the Top bowlers including Warne, Muralidharan, Kumble- the famed Indian spin quartet of Bedi, Chandrasekhar, Prasanna, Venkatraghavan, the deadly West Indies trio of Marshal, Roberts and Holding and the lethal combination of Imran Khan, Wasim Akram and Waqar Younis besides the dangerous Dennis Lillee and Jeff Thomson. Do give the functions a try and see for yourself the performances of these individual bowlers

3. Relative performances of batsman
This tab allows the selection of multiple batsmen (Test, ODI and Twenty 20) for comparisons. There are 2 main functions Relative Runs Frequency performance and Relative Mean Strike Rate

4. Relative performances of bowlers
Here we can compare bowling performances of multiple bowlers, which include functions Relative Bowling Performance and Relative Economy Rate. This can be done for Test, ODI and Twenty20 formats

5. Check for In-Form status of players
This tab checks the form status of batsman or bowler selected for all of the different formats of the game. The below computation uses Null Hypothesis testing and p-value to determine if the batsman is in-form or out-of-form. For this 90% of the career runs is chosen as the population and the mean computed. The last 10% is chosen to be the sample set and the sample Mean and the sample Standard Deviation are calculated. Note: The accuracy of the p-value test depends on the size of the population and the size of the sample set. It  may not be very significant for players with a few innings played.

Some of my earlier posts based my R package cricketr are listed below
1. Introducing cricketr!: An R package for analyzing performances of cricketers
2. Taking cricketr for a spin – Part 1
3. cricketr plays the ODIs
4. cricketr adapts to the Twenty20 International
5. cricketr digs the Ashes

Do try out the interactive Sixer Shiny app – Sixer
You can clone the code from Github – Sixer

There is not much in way of explanation. The Shiny app’s use is self-explanatory. You can choose a match type ( Test,ODI or Twenty20), choose a batsman/bowler  from the drop down list and select the plot you would like to seeHere a few sample plots
A. Analyze batsman tab
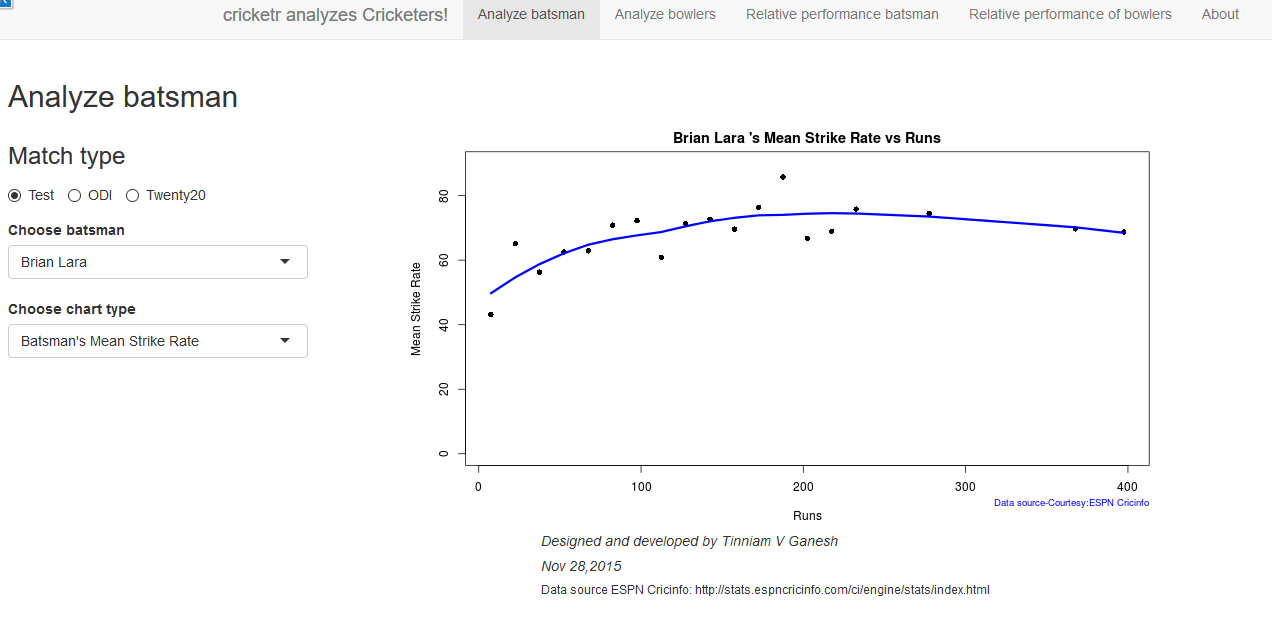
i) Batsman – Brian Lara , Match Type – Test, Function – Mean Strike Rate
sxr-1ii) Batsman – Shahid Afridi, Match Type –  ODI, Function – Runs vs Balls faced
The plot below shows that if Afridi faces around 50 balls he is likely to score around 60 runs in ODIs.
sxr-2iii)   Batsman – Chris Gayle, Match Type – Twenty20  Function – Moving Average
sxr-3B. Analyze bowler tab

i. Bowler – B S Chandrasekhar, Match Type – Test, Function – Wickets vs Runs
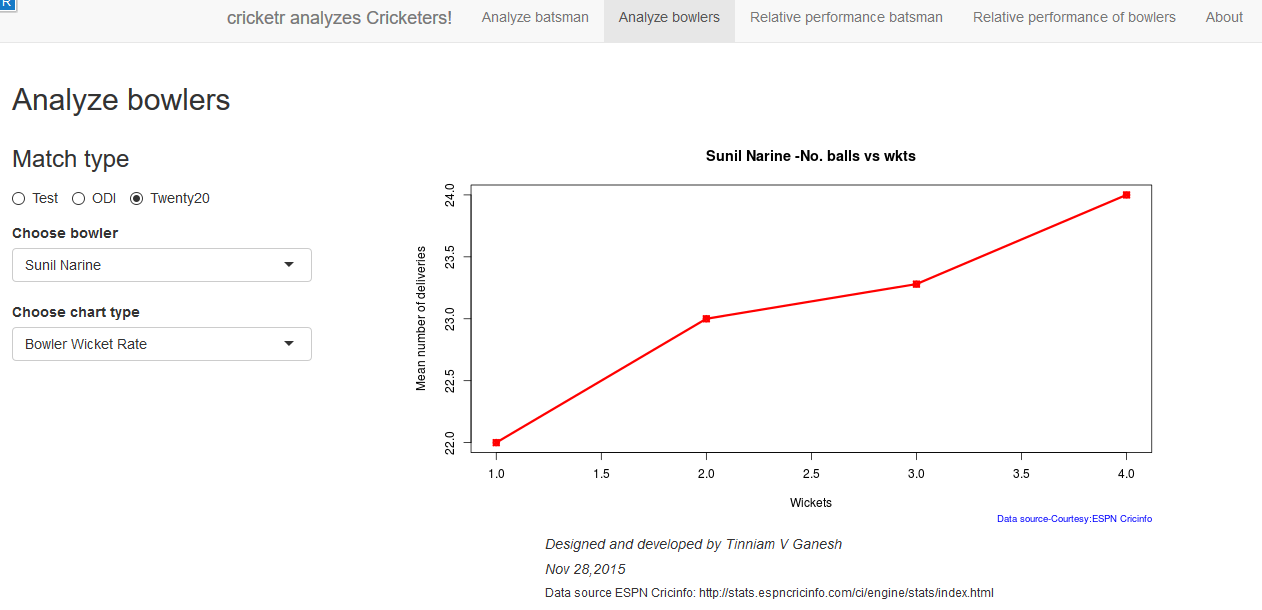
sxr-4ii)  Bowler – Malcolm Marshall, Match Type – Test, Function – Mean Economy Ratesxr-5iii)  Bowler – Sunil Narine, Match Type – Twenty 20, Function – Bowler Wicket Rate
sxr-6
C. Relative performance of batsman (you can select more than 1)
The below plot gives the Mean Strike Rate of batsman. Viv Richards, Brian Lara, Sanath Jayasuriya and David Warner are best strikers of the ball.
sxr-7

Here are some of the great strikers of the ball in ODIs
sxr-8D. Relative performance of bowlers (you can select more than 1)
Finally a look at the famed Indian spin quartet.  From the plot below it can be seen that  B S Bedi  & Venkatraghavan were more economical than Chandrasekhar and Prasanna.
sxr-9

But the latter have a better 4-5 wicket haul than the former two as seen in the plot below

sxr-11Finally a look at the average number of balls to take a wicket by the Top 4 Twenty 20 bowlers.
sxr-10

E. Check for In-form status of players
Note: The accuracy of the p-value depends on the size of the population and the size of the sample set. It  may not be very significant for smaller data sizes

i. Match Type – Test,  Player Type – Batsman  Name – Wickets v
In this plot the in-form status of Viv Richards is checked. This shows that Viv Richards was out-of-form
sxr-12In the plot below the form status of S. Venkataraghavan is shown. According to this at the time of  his retirement S Venkat was still in-form
sxr-13

Do give the Shiny app Sixer a try.

Also see
1. Literacy in India : A deepR dive.
2.  Natural Language Processing: What would Shakespeare say?
3. Revisiting crimes against women in India
4. Informed choices through Machine Learning : Analyzing Kohli, Tendulkar and Dravid
5. Experiments with deblurring using OpenCV
6.  What’s up Watson? Using IBM Watson’s QAAPI with Bluemix, NodeExpress – Part 1
7.  Working with Node.js and PostgreSQL
8. A method for optimal bandwidth usage by auctioning available bandwidth using the OpenFlow Protocol
9.  Latency, throughput implications for the cloud
10.  A closer look at “Robot horse on a Trot! in Android”

Literacy in India – A deepR dive

Published in R-bloggers: Literacy in India – A deepR dive
You can do magic!
You can have anything,
That you desire
Magic…
You can do magic – song by America (1982)

That is exactly how I feel when I write code in R. A few lines of R, lo behold, hundreds of rows and columns are magically transformed into  easily understandable graphs, regression curves or choropleth maps. (By the way, the song is a really cool! Listen to it if you have not heard it before). You really can do magic with R

In this post I do a deep dive into literacy in India The dataset is taken from Open Government Data (OGD) platform India was used for this purpose. This data is based on the 2001 census. Though the data is a little dated, it is extremely rich with literacy details across different age groups, and over all Indian States. The data includes the total number of persons/males/females who are in the primary, middle.matric, college,technical diploma, non-technical diploma and so on. In fact the data also includes the educational background of people in the districts in each state. I slice and dice the data across multiple parameters. I have created an interactive Shiny App which will provide very detailed visualization based on the parameters chosen

Do try out my interactive Shiny app : IndiaLiteracy

The entire code for this app is on GitHub. Feel free to download/clone/fork/modify or enhance the code – IndiaLiteracy

For analyzing   such a rich data set as the Census data of 2001, I create 4 tabs
1) State Literacy
2) Educational Levels vs Age
3) India Literacy and
4) District Literacy

Here are the details of these 4 tabs in my Shiny app

A) State Literacy
This tab provides the age wise distribution of people (Persons/Males/Females) who attend educational institutions. This is shown as a barplot. The plot also includes the national average. In the plot below which is for entire India we see that the national average

1

The distribution of females attending primary school in the state of Haryana is shown. Also included is the national average. As can be seen there are options for (Total/Urban/Rural) against (Persons/Males/Females) and whether these people attend educational institutions are illiterate of literate.

2

I also have another option under “Who’ which is “All” This will plot the age wise distribution of males/females/persons in urban/rural or entire state.

3

B. Educational Institutions vs Age plot

This plot displays the the educational institutions attended by people in a particular age group. So for example in the state of Orissa for the 18 year age group we can see that there persons who are in (Primary, Matric, Higher Secondary, Non-Technical Diploma and Technical Diploma). The bar length for each color is the percentage of the total persons at that level of education

4

C. Literacy across India
This tab plots a chorpleth map for a region(Urban+Rural, Urban, Rural), Who(Persons, Males, Females) and the literacy level (attending educational institutions, primary, higher secondary, Matric etc) across the whole of India.

6

D. Literacy within a state
This tab plots a chorpleth map of literacy in the districts of a state. A sample plot for Karnataka is shown below

7

E. Key observations

There is a wealth of insights you can glean by looking at the various charts. Here a few insights from my initial observations
1) The literacy in Kerala across ages is higher than the national average while in Bihar it is less than the national average

a) Kerala

8b) Bihar

9
2) In Rajasthan The Males Attending education instituions is higher than the national average while for females it less than the national average. However the situation is reverse in Chandigarh where there are the percentage of females attending education instiuons is higher than the national average and the males

a) Rajasthan

10b) Chandigarh

11
3) When we look at the number of persons attending educational institution across India the north-eastern states lead with Manipur, Nagaland and Sikkim in the top 3.

12

We have heard that Kerala is the most literate state. But  it looks like Manipur, Nagaland, Sikkim actually edge Kerala out. If we look at the State literacy chart for Kerala and Manipur this becomes more clear

a) Kerala

13

b) Manipur

14

It can be seen that in Manipur the number of persons attending educational instition in the age range 13-24 years it is much higher than the national average and much higher than Kerala

4) If we take a look at the District wise literacy for the state of Bihar we see that the literacy is lower in the north eastern districts.,

15

5) Here is another interesting observation I made. The top 3 states which are most ‘literate with no education’ are i) Rajasthan ii) Madhya Pradesh iii) Chhattisgarh

16

While I have included several charts with accompanying explanation, this is largely unnecessary as  most of the charts are self-explanatory.

Do try out the Shiny app and see for yourself the literacy in each state/district/age group educational  level etc –IndiaLiteracy

Feel free to clone/fork my code and make your own enhancements –IndiaLiteracy

You may also like
1.  Natural Language Processing: What would Shakespeare say?
2. Introducing cricketr! : An R package to analyze performances of cricketers
3. Revisiting crimes against women in India
4. Informed choices through Machine Learning : Analyzing Kohli, Tendulkar and Dravid
5. Re-working the Lucy-Richardson Algorithm in OpenCV
6.  What’s up Watson? Using IBM Watson’s QAAPI with Bluemix, NodeExpress – Part 1
7.  Bend it like Bluemix, MongoDB with autoscaling – Part 2
8. TWS-4: Gossip protocol: Epidemics and rumors to the rescue
9. Thinking Web Scale (TWS-3): Map-Reduce – Bring compute to data
10.  Simulating an Edge Shape in Android

Revisiting crimes against women in India

Here I go again, raking the muck about crimes against women in India. My earlier post “A crime map of India in R: Crimes against women in India” garnered a lot of responses from readers. In fact one of the readers even volunteered to create the only choropleth map in that post. The data for this post is taken from http://data.gov.in. You can download the data from the link “Crimes against women in India

I was so impressed by the choropleth map that I decided to do that for all crimes against women.(Wikipedia definition: A choropleth map is a thematic map in which areas are shaded or patterned in proportion to the measurement of the statistical variable being displayed on the map). Personally, I think pictures tell the story better. I am sure you will agree!

So here, I have it a Shiny app which will plot choropleth maps for a chosen crime in a given year.

You can try out my interactive Shiny app at  Crimes against women in India

Checkout out my book  on Amazon available in both  Paperback ($9.99) and a Kindle version($6.99/Rs449/). (see ‘Practical Machine Learning with R and Python – Machine Learning in stereo‘)

The following technique can be used to determine the ‘goodness’ of a hypothesis or how well the hypothesis can fit the data and can also generalize to new examples not in the training set.

In the picture below  are the details of  ‘Rape” in the year 2015.
1

Interestingly the ‘Total Crime against women’ in 2001 shows the Top 5 as
1) Uttar Pradresh 2) Andhra Pradesh 3) Madhya Pradesh 4) Maharashtra 5) Rajasthan

2

But in 2015 West Bengal tops the list, as the real heavy weight in crimes against women. The new pecking order in 2015 for ‘Total Crimes against Women’ is

1) West Bengal 2) Andhra Pradesh 3) Uttar Pradesh  4) Rajasthan 5) Maharashtra

3

Similarly for rapes, West Bengal is nowhere in the top 5 list in 2001. In 2015, it is in second only to the national rape leader Madhya Pradesh.  Also in 2001 West Bengal is not in the top 5 for any of 6 crime heads. But in 2015, West Bengal is in the top 5 of 6 crime heads. The emergence of West Bengal as the leader in Crimes against Women is due to the steep increase in crime rate  over the years.Clearly the law and order situation in West Bengal is heading south.

In Dowry Deaths, UP, Bihar, MP, West Bengal lead the pack, and in that order in 2015.

The usual suspects for most crime categories are West Bengal, UP, MP, AP & Maharashtra.

The state-wise crime charts plot the incidence of the crime (rape, dowry death, assault on women etc) over the years. Data for each state and for each crime was available from 2001-2013. The data for period 2014-2018 are projected using linear regression. The shaded portion in the plots indicate the 95% confidence level in the prediction (i.e in other words we can be 95% certain that the true mean of the crime rate in the projected years will lie within the shaded region)

4

Several  interesting requests came from readers to my earlier post. Some of them were to to plot the crimes as function of population and per capita income of the State/Union Territory to see if the plots  throw up new crime leaders. I have not got the relevant state-wise population distribution data yet. I intend to update this when I get my hands on this data.
I have included the crimes.csv which has been used to generate the visualization. However for the Shiny app I save this as .RData for better performance of the app.

You can clone/download  the code for the Shiny app from GitHub at  crimesAgainWomenIndia

Please checkout my Shiny app : Crimes against women

I also intend to add further interactivity to my visualizations in a future version. Watch this space. I’ll be back!

You may like
1. My book ‘Practical Machine Learning with R and Python’ on Amazon
2. Natural Language Processing: What would Shakespeare say?
3. Introducing cricketr! : An R package to analyze performances of cricketers
4. A peek into literacy in India: Statistical Learning with R
5. Informed choices through Machine Learning : Analyzing Kohli, Tendulkar and Dravid
6. Re-working the Lucy-Richardson Algorithm in OpenCV
7.  What’s up Watson? Using IBM Watson’s QAAPI with Bluemix, NodeExpress – Part 1
8.  Bend it like Bluemix, MongoDB with autoscaling – Part 2
9. TWS-4: Gossip protocol: Epidemics and rumors to the rescue
10. Thinking Web Scale (TWS-3): Map-Reduce – Bring compute to data
11.  Simulating an Edge Shape in Android