Optimal Deep Learning model selection using wandb.ai

In this post I use Weights and Biases’ wandb.ai ‘sweep’ feature, to automatically select the best Deep Learning model out of a set of models created through Grid Search. I chanced upon the Weights and Biases site when I was training and fine-tuning the T5 transformer model, on Kaggle, for my post GenerativeAI:Using T5 Transformer model to summarise Indian Philosophy. During this process Kaggle had requested for a token from wandb.ai.

Out of curiosity, I started to explore this Weights and Biases (W&B) machine learning site and was impressed with the visualisation capabilities of this site. So I decided to give weights and biases a try. It is quite interesting to see the live visualisation features of the site and it is becomes very easy to select the optimal model when we are trying to do a Grid search or Random search through a combination of hyper-parameters.

For this purpose, I used my processed T20 match dataset which I had used to compute the Win Probability of T20 teams. For more details please see my post GooglyPlusPlus: Win Probability using Deep Learning and player embeddings

Searching through high dimensional hyperparameter spaces to find the most performant model can quickly get unwieldy. Hyperparameter sweeps provide an organised and efficient way to automatically search through combinations of hyperparameter values (e.g. learning rate, batch size, epochs, dropout, optimizer type) to find the most optimal values.

Here are the steps

a) Install, import

!pip install wandb -qU
import wandb
from wandb.keras import WandbCallback
wandb.login()
import pandas as pd
import numpy as np
from zipfile import ZipFile
import tensorflow as tf
from tensorflow import keras
from tensorflow.keras import layers
from tensorflow.keras import regularizers
from pathlib import Path
import matplotlib.pyplot as plt

b) Load the dataset

import pandas as pd
import numpy as np
from zipfile import ZipFile
import tensorflow as tf
from tensorflow import keras
from tensorflow.keras import layers
from tensorflow.keras import regularizers

df1=pd.read_csv('t20.csv')
print("Shape of dataframe=",df1.shape)

train_dataset = df1.sample(frac=0.8,random_state=0)
test_dataset = df1.drop(train_dataset.index)
train_dataset1 = train_dataset[['batsmanIdx','bowlerIdx','ballNum','ballsRemaining','runs','runRate','numWickets','runsMomentum','perfIndex']]
test_dataset1 = test_dataset[['batsmanIdx','bowlerIdx','ballNum','ballsRemaining','runs','runRate','numWickets','runsMomentum','perfIndex']]
train_dataset1
train_labels = train_dataset.pop('isWinner')
test_labels = test_dataset.pop('isWinner')
train_dataset1

a=train_dataset1.describe()
stats=a.transpose
a

Shape of dataframe= (1359888, 10)
batsmanIdx	bowlerIdx	ballNum	ballsRemaining	runs	runRate	numWickets	runsMomentum	perfIndex
count	1.087910e+06	1.087910e+06	1.087910e+06	1.087910e+06	1.087910e+06	1.087910e+06	1.087910e+06	1.087910e+06	1.087910e+06
mean	2.561058e+03	1.939449e+03	1.185352e+02	6.001942e+01	8.110290e+01	1.611611e+00	2.604912e+00	2.886850e-01	9.619675e+00
std	1.479446e+03	1.095097e+03	6.934078e+01	3.514725e+01	4.977998e+01	2.983874e+00	2.195410e+00	6.066070e-01	4.602859e+00
min	1.000000e+00	1.000000e+00	1.000000e+00	1.000000e+00	-5.000000e+00	-5.000000e+00	0.000000e+00	3.571429e-02	0.000000e+00
25%	1.230000e+03	9.400000e+02	5.900000e+01	3.000000e+01	4.100000e+01	1.043478e+00	1.000000e+00	1.058824e-01	6.539326e+00
50%	2.492000e+03	1.919000e+03	1.170000e+02	5.900000e+01	7.800000e+01	1.300000e+00	2.000000e+00	1.408451e-01	9.246753e+00
75%	3.868000e+03	2.884000e+03	1.770000e+02	9.000000e+01	1.170000e+02	1.590312e+00	4.000000e+00	2.352941e-01	1.218349e+01
max	5.226000e+03	3.848000e+03	2.860000e+02	1.610000e+02	2.780000e+02	2.510000e+02	1.000000e+01	1.100000e+01	6.600000e+01

c) Define the Deep Learning model

import pandas as pd
import numpy as np
from keras.layers import Input, Embedding, Flatten, Dense
from keras.models import Model
from keras.layers import Input, Embedding, Flatten, Dense, Reshape, Concatenate, Dropout
from keras.models import Model

tf.random.set_seed(432)
# create input layers for each of the predictors
batsmanIdx_input = Input(shape=(1,), name='batsmanIdx')
bowlerIdx_input = Input(shape=(1,), name='bowlerIdx')
ballNum_input = Input(shape=(1,), name='ballNum')
ballsRemaining_input = Input(shape=(1,), name='ballsRemaining')
runs_input = Input(shape=(1,), name='runs')
runRate_input = Input(shape=(1,), name='runRate')
numWickets_input = Input(shape=(1,), name='numWickets')
runsMomentum_input = Input(shape=(1,), name='runsMomentum')
perfIndex_input = Input(shape=(1,), name='perfIndex')

# Set the embedding size
no_of_unique_batman=len(df1["batsmanIdx"].unique())
print(no_of_unique_batman)
no_of_unique_bowler=len(df1["bowlerIdx"].unique())
print(no_of_unique_bowler)
embedding_size_bat = no_of_unique_batman ** (1/4)
embedding_size_bwl = no_of_unique_bowler ** (1/4)


# create embedding layer for the categorical predictor
batsmanIdx_embedding = Embedding(input_dim=no_of_unique_batman+1, output_dim=16,input_length=1)(batsmanIdx_input)
batsmanIdx_flatten = Flatten()(batsmanIdx_embedding)
bowlerIdx_embedding = Embedding(input_dim=no_of_unique_bowler+1, output_dim=16,input_length=1)(bowlerIdx_input)
bowlerIdx_flatten = Flatten()(bowlerIdx_embedding)

# concatenate all the predictors
x = keras.layers.concatenate([batsmanIdx_flatten,bowlerIdx_flatten, ballNum_input, ballsRemaining_input, runs_input, runRate_input, numWickets_input, runsMomentum_input, perfIndex_input])

# add hidden layers
x = Dense(64, activation='relu')(x)
x = Dropout(0.1)(x)
x = Dense(32, activation='relu')(x)
x = Dropout(0.1)(x)
x = Dense(16, activation='relu')(x)
x = Dropout(0.1)(x)
x = Dense(8, activation='relu')(x)
x = Dropout(0.1)(x)
# add output layer
output = Dense(1, activation='sigmoid', name='output')(x)
print(output.shape)
# create model

# Initialize a new W&B run
#run = wandb.init(project='t20', group='cricket')

model = Model(inputs=[batsmanIdx_input,bowlerIdx_input, ballNum_input, ballsRemaining_input, runs_input, runRate_input, numWickets_input, runsMomentum_input, perfIndex_input], outputs=output)
model.summary()

# Initialize a new W&B run
run = wandb.init(project='t20', group='cricket')
wandb.init(
    # set the wandb project where this run will be logged
    project="t20",

    # track hyperparameters and run metadata
    config={
    "learning_rate": 0.02,
    "dropout": 0.01,
    "batch_size": 1024,
    "epochs": 5,
    }
)


5226
3848
(None, 1)
Model: "model"
__________________________________________________________________________________________________
 Layer (type)                Output Shape                 Param #   Connected to                  
==================================================================================================
 batsmanIdx (InputLayer)     [(None, 1)]                  0         []                            
                                                                                                  
 bowlerIdx (InputLayer)      [(None, 1)]                  0         []                            
                                                                                                  
 embedding (Embedding)       (None, 1, 16)                83632     ['batsmanIdx[0][0]']          
                                                                                                  
 embedding_1 (Embedding)     (None, 1, 16)                61584     ['bowlerIdx[0][0]']           
                                                                                                  
 flatten (Flatten)           (None, 16)                   0         ['embedding[0][0]']           
                                                                                                  
 flatten_1 (Flatten)         (None, 16)                   0         ['embedding_1[0][0]']         
                                                                                                  
 ballNum (InputLayer)        [(None, 1)]                  0         []                            
                                                                                                  
 ballsRemaining (InputLayer  [(None, 1)]                  0         []                            
 )                                                                                                
                                                                                                  
 runs (InputLayer)           [(None, 1)]                  0         []                            
                                                                                                  
 runRate (InputLayer)        [(None, 1)]                  0         []                            
                                                                                                  
 numWickets (InputLayer)     [(None, 1)]                  0         []                            
                                                                                                  
 runsMomentum (InputLayer)   [(None, 1)]                  0         []                            
                                                                                                  
 perfIndex (InputLayer)      [(None, 1)]                  0         []                            
                                                                                                  
 concatenate (Concatenate)   (None, 39)                   0         ['flatten[0][0]',             
                                                                     'flatten_1[0][0]',           
                                                                     'ballNum[0][0]',             
                                                                     'ballsRemaining[0][0]',      
                                                                     'runs[0][0]',                
                                                                     'runRate[0][0]',             
                                                                     'numWickets[0][0]',          
                                                                     'runsMomentum[0][0]',        
                                                                     'perfIndex[0][0]']           
                                                                                                  
 dense (Dense)               (None, 64)                   2560      ['concatenate[0][0]']         
                                                                                                  
 dropout (Dropout)           (None, 64)                   0         ['dense[0][0]']               
                                                                                                  
 dense_1 (Dense)             (None, 32)                   2080      ['dropout[0][0]']             
                                                                                                  
 dropout_1 (Dropout)         (None, 32)                   0         ['dense_1[0][0]']             
                                                                                                  
 dense_2 (Dense)             (None, 16)                   528       ['dropout_1[0][0]']           
                                                                                                  
 dropout_2 (Dropout)         (None, 16)                   0         ['dense_2[0][0]']             
                                                                                                  
 dense_3 (Dense)             (None, 8)                    136       ['dropout_2[0][0]']           
                                                                                                  
 dropout_3 (Dropout)         (None, 8)                    0         ['dense_3[0][0]']             
                                                                                                  
 output (Dense)              (None, 1)                    9         ['dropout_3[0][0]']           
                                                                                                  
==================================================================================================
Total params: 150529 (588.00 KB)
Trainable params: 150529 (588.00 KB)
Non-trainable params: 0 (0.00 Byte)

d) Create  a Training script

def get_optimizer(lr=1e-2, optimizer="adam"):
    "Select optmizer between adam and sgd with momentum"
    if optimizer.lower() == "adam":
        return tf.keras.optimizers.Adam(learning_rate=lr)
    if optimizer.lower() == "sgd":
        return tf.keras.optimizers.SGD(learning_rate=lr, momentum=0.1)

def train(model, batch_size=1024, epochs=10, lr=1e-2, optimizer='adam', log_freq=10):

    # Compile model like you usually do.
    tf.keras.backend.clear_session()
    model.compile(loss="binary_crossentropy",
                  optimizer=get_optimizer(lr, optimizer),
                  metrics=["accuracy"])

    # callback setup
    cbs = [WandbCallback(data_type='auto', log_batch_frequency=None)]

    # train the model
    history=model.fit([train_dataset1['batsmanIdx'],train_dataset1['bowlerIdx'],train_dataset1['ballNum'],train_dataset1['ballsRemaining'],train_dataset1['runs'],
           train_dataset1['runRate'],train_dataset1['numWickets'],train_dataset1['runsMomentum'],train_dataset1['perfIndex']], train_labels, epochs=epochs, batch_size=batch_size,callbacks=cbs,
          validation_data = ([test_dataset1['batsmanIdx'],test_dataset1['bowlerIdx'],test_dataset1['ballNum'],test_dataset1['ballsRemaining'],test_dataset1['runs'],
           test_dataset1['runRate'],test_dataset1['numWickets'],test_dataset1['runsMomentum'],test_dataset1['perfIndex']],test_labels), verbose=1)

e) Define the sweep for Grid Search

#Grid search
sweep_config = {
    'method': 'grid'
    }

metric = {
    'name': 'val_loss',
    'goal': 'minimize'
    }

sweep_config['metric'] = metric
# Optimizers - Adam, SGD
parameters_dict = {
    'optimizer': {
        'values': ['adam', 'sgd']
        },
    'dropout': {
          'values': [0.1, 0.05]
        },
    }

sweep_config['parameters'] = parameters_dict

parameters_dict.update({
    'epochs': {
        'value': 20}
    })

import math
# Set learning_rate, batch_size
parameters_dict.update({
    'learning_rate': {
         'values': [0.005,0.008,0.01,.03]  
      },
    'batch_size': {
        'values': [1024,2048]
      }
    })

import pprint
pprint.pprint(sweep_config)

'method': 'grid',
 'metric': {'goal': 'minimize', 'name': 'val_loss'},
 'parameters': {'batch_size': {'values': [1024, 2048]},
                'dropout': {'values': [0.1, 0.05]},
                'epochs': {'value': 20},
                'learning_rate': {'values': [0.005, 0.008, 0.01, 0.03]},
                'optimizer': {'values': ['adam', 'sgd']}}}

f) Wrap the Training Loop


def sweep_train(config_defaults=None):
    # Initialize wandb with a sample project name
    with wandb.init(config=config_defaults):  # this gets over-written in the Sweep

        # Specify the other hyperparameters to the configuration, if any
        wandb.config.architecture_name = "DL"
        wandb.config.dataset_name = "T20"
        # initialize model
        #model = T20Net(wandb.config.dropout)

        train(model,
              wandb.config.batch_size,
              wandb.config.epochs,
              wandb.config.learning_rate,
              wandb.config.optimizer)

g) Initialise Sweep and Run Agent

sweep_id = wandb.sweep(sweep_config, project="sweeps-keras-t20")
wandb.agent(sweep_id, sweep_train, count=10)
wandb: WARNING Calling wandb.login() after wandb.init() has no effect.
wandb: Agent Starting Run: zbaaq0bn with config:
wandb: 	batch_size: 1024
wandb: 	dropout: 0.1
wandb: 	epochs: 20
wandb: 	learning_rate: 0.005
wandb: 	optimizer: adam

Epoch 19/20
1061/1063 [============================>.] - ETA: 0s - loss: 0.3073 - accuracy: 0.8490/usr/local/lib/python3.10/dist-packages/keras/src/engine/training.py:3000: UserWarning: You are saving your model as an HDF5 file via `model.save()`. This file format is considered legacy. We recommend using instead the native Keras format, e.g. `model.save('my_model.keras')`.
  saving_api.save_model(
wandb: Adding directory to artifact (/content/wandb/run-20231004_065327-zbaaq0bn/files/model-best)... Done. 0.0s
1063/1063 [==============================] - 15s 14ms/step - loss: 0.3073 - accuracy: 0.8490 - val_loss: 0.3093 - val_accuracy: 0.8479
Epoch 20/20
1062/1063 [============================>.] - ETA: 0s - loss: 0.3052 - accuracy: 0.8502/usr/local/lib/python3.10/dist-packages/keras/src/engine/training.py:3000: UserWarning: You are saving your model as an HDF5 file via `model.save()`. This file format is considered legacy. We recommend using instead the native Keras format, e.g. `model.save('my_model.keras')`.
  saving_api.save_model(
wandb: Adding directory to artifact (/content/wandb/run-20231004_065327-zbaaq0bn/files/model-best)... Done. 0.0s
1063/1063 [==============================] - 18s 17ms/step - loss: 0.3052 - accuracy: 0.8502 - val_loss: 0.3068 - val_accuracy: 0.8490
Waiting for W&B process to finish... (success).
Run history:

accuracy	▁▅▅▆▆▆▇▇▇▇▇▇▇███████
epoch	▁▁▂▂▂▃▃▄▄▄▅▅▅▆▆▇▇▇██
loss	█▅▄▃▃▃▃▂▂▂▂▂▂▂▁▁▁▁▁▁
val_accuracy	▁▂▃▄▄▅▅▅▆▆▆▇▇▇▇▇▇███
val_loss	█▆▅▅▄▄▃▃▃▃▃▂▂▂▂▂▂▁▁▁

Run summary:

accuracy	0.85022
best_epoch	19
best_val_loss	0.30681
epoch	19
loss	0.30521
val_accuracy	0.849
val_loss	0.30681

...
...
wandb: Agent Starting Run: 4qtyxzq9 with config:
wandb: 	batch_size: 1024
wandb: 	dropout: 0.1
wandb: 	epochs: 20
wandb: 	learning_rate: 0.008
wandb: 	optimizer: sgd
...
...

Epoch 18/20
1063/1063 [==============================] - 13s 12ms/step - loss: 0.2672 - accuracy: 0.8697 - val_loss: 0.2819 - val_accuracy: 0.8624
Epoch 19/20
1061/1063 [============================>.] - ETA: 0s - loss: 0.2669 - accuracy: 0.8697/usr/local/lib/python3.10/dist-packages/keras/src/engine/training.py:3000: UserWarning: You are saving your model as an HDF5 file via `model.save()`. This file format is considered legacy. We recommend using instead the native Keras format, e.g. `model.save('my_model.keras')`.
  saving_api.save_model(
wandb: Adding directory to artifact (/content/wandb/run-20231004_070920-4qtyxzq9/files/model-best)... Done. 0.0s
1063/1063 [==============================] - 14s 13ms/step - loss: 0.2669 - accuracy: 0.8697 - val_loss: 0.2813 - val_accuracy: 0.8635
Epoch 20/20
1063/1063 [==============================] - 13s 12ms/step - loss: 0.2650 - accuracy: 0.8707 - val_loss: 0.2957 - val_accuracy: 0.8557
Waiting for W&B process to finish... (success).
6.805 MB of 6.818 MB uploaded (0.108 MB deduped)
Run history:

accuracy	▁▂▃▃▄▄▄▄▄▄▄▄▅▅▄▆▅▆▆█
epoch	▁▁▂▂▂▃▃▄▄▄▅▅▅▆▆▇▇▇██
loss	█▇▆▆▅▅▅▅▅▅▅▄▄▄▄▄▄▃▃▁
val_accuracy	▇▅▅▁█▅▇▆▆▅█▅▅▆▃▇▁▇█▁
val_loss	▃▄▄▅▁▃▂▃▃▃▁▄▄▂▆▂█▁▁█

Run summary:

accuracy	0.87067
best_epoch	18
best_val_loss	0.28127
epoch	19
loss	0.26499
val_accuracy	0.85565
val_loss	0.29573
...
...
wandb: Agent Starting Run: lt2fknva with config:
wandb: 	batch_size: 1024
wandb: 	dropout: 0.1
wandb: 	epochs: 20
wandb: 	learning_rate: 0.01
wandb: 	optimizer: adam
Tracking run with wandb version 0.15.11
Run data is saved locally in /content/wandb/run-20231004_071359-lt2fknva
Syncing run lively-sweep-5 to Weights & Biases (docs)
...
...
Epoch 19/20
1063/1063 [==============================] - 14s 13ms/step - loss: 0.2779 - accuracy: 0.8651 - val_loss: 0.2883 - val_accuracy: 0.8607
Epoch 20/20
1060/1063 [============================>.] - ETA: 0s - loss: 0.2795 - accuracy: 0.8643/usr/local/lib/python3.10/dist-packages/keras/src/engine/training.py:3000: UserWarning: You are saving your model as an HDF5 file via `model.save()`. This file format is considered legacy. We recommend using instead the native Keras format, e.g. `model.save('my_model.keras')`.
  saving_api.save_model(
wandb: Adding directory to artifact (/content/wandb/run-20231004_071359-lt2fknva/files/model-best)... Done. 0.0s
1063/1063 [==============================] - 16s 15ms/step - loss: 0.2795 - accuracy: 0.8643 - val_loss: 0.2831 - val_accuracy: 0.8620
Waiting for W&B process to finish... (success).
Run history:

accuracy	▁▁▁▂▂▃▃▄▅▅▅▆▆▆▆▆▇▇█▇
epoch	▁▁▂▂▂▃▃▄▄▄▅▅▅▆▆▇▇▇██
loss	███▇▇▆▅▆▅▄▄▃▃▃▃▂▂▂▁▂
val_accuracy	▁▅▂▆▆▅▂▆▆▅▇▇▆▇▅▃▃▆▇█
val_loss	▇▆▇▅▃▅█▆▅▄▂▃▄▂▆▆▇▃▃▁

Run summary:

accuracy	0.8643
best_epoch	19
best_val_loss	0.28309
epoch	19
loss	0.27949
val_accuracy	0.86195
val_loss	0.28309
...
...

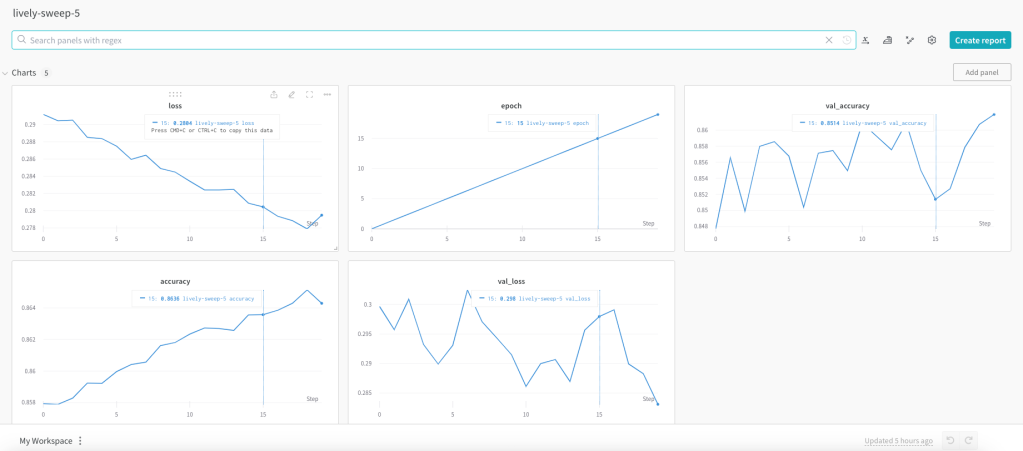
In the W & B site each of the runs or captured very nicely

The best model is ‘lively-sweep-5‘ with the lowest validation loss

The picture below gives the validation loss for various combinations of the hyper-para meters

It is very easy to visually pick the best model with loss as shown below. It is lively-sweep-5. we can see the values of the hyper-parameters for this DL model

Details of optimal Deep Learning model

a. Run – lively-sweep-5

b. optimizer – adam

c. learning_rate – 0.01

d. batch_size – 1024

e. dropout – 0.1

We can see the performance of this model individually by clicking lively-sweep-6 on the left panel
It was good fun to play around with the Weights and Biases in selecting an optimal model

See also

  1. Deconstructing Convolutional Neural Networks with Tensorflow and Keras
  2. Deep Learning from first principles in Python, R and Octave – Part 7
  3. Identifying cricketing shots using AI
  4. Introducing cricket package yorkr: Part 2-Trapped leg before wicket!
  5. Introducing cricpy:A python package to analyze performances of cricketers

To see all posts click Index of posts

T20 Win Probability using CTGANs, synthetic data

This should be my last post on computing T20 Win Probability. In this post I compute Win Probability using Augmented Data with the help of Conditional Tabular Generative Adversarial Networks (CTGANs).

A.Introduction

I started the computation of T20 match Win Probability in my earlier post

a) ‘Computing Win-Probability of T20 matches‘ where I used

  • vanilla Logistic Regression to get an accuracy of 0.67,
  • Random Forest with Tidy models gave me an accuracy of 0.737
  • Deep Learning with Keras also with 0.73.

This was done without player embeddings

b) Next I used player embeddings for batsmen and bowlers in my post Boosting Win Probability accuracy with player embeddings , and my accuracies improved significantly

  • glmnet : accuracy – 0.728 and roc_auc – 0.81
  • random forest : accuracy – 0.927 and roc_auc – 0.98
  • mlp-dnn :accuracy – 0.762 and roc_auc – 0.854

c) Third I tried using Deep Learning with Keras using player embeddings

  • DL network gave an accuracy of 0.8639

This was lightweight and could be easily deployed in my Shiny GooglyPlusPlus app as opposed to the Tidymodel’s Random Forest, which was bulky and slow.

d) Finally I decided to try and improve the accuracy of my Deep Learning Model using Synthetic data. Towards this end, my explorations led me to Conditional Tabular Generative Adversarial Networks (CTGANs). CTGAN are GAN networks that can be used with Tabular data as GAN models are not useful with tabular data. However, the best performance I got for

  • DL Keras Model + Synthetic data : accuracy =0.77

The poorer accuracy was because CTGAN requires enormous computing power (GPUs) and RAM. The free version of Colab, Kaggle kept crashing when I tried with even 0.1 % of my 1.2 million dataset size. Finally, I tried with just 0.05% and was able to generate synthetic data. Most likely, it is the small sample size and the smaller number of epochs could be the reason for the poor result. In any case, it was worth trying and this approach would possibly work with sufficient computing resources.

B.Generative Adversarial Networks (GANs)

Generative Adversarial Networks (GANs) was the brain child of Ian Goodfellow who demonstrated it in 2014. GANs are capable of generating synthetic text, tables, images, videos using available data. In Adversarial nets framework, the generative model is pitted against an adversary: a
discriminative model that learns to determine whether a sample is from the model distribution or the
data distribution.

GANs have 2 Deep Neural Networks , the Generator and Discriminator which compete against other

  • The Generator (Counterfeiter) takes random noise as input and generates fake images, tables, text. The generator learns to generate plausible data. The generated instances become negative training examples for the discriminator.
  • The Discriminator (Police) which tries to distinguish between the real and fake images, text. The discriminator learns to distinguish the generator’s fake data from real data. The discriminator penalises the generator for producing implausible results.

A pictorial representation of the GAN model can be shown below

Theoretically best performance of GANs are supposed to happen when the network reaches the ‘Nash equilibrium‘, i.e. when the Generator produces near fake images and the Discriminator’s loss is f ~0.5 i.e. the discriminator is unable to distinguish between real and fake images.

Note: Though I have mentioned T20 data in the above GAN model, the T20 tabular data is actually used in CTGAN which is slightly different from the above. See Reference 2) below.

C. Conditional Tabular Generative Adversial Networks (CTGANs)

“Modeling the probability distribution of rows in tabular data and generating realistic synthetic data is a non-trivial task. Tabular data usually contains a mix of discrete and continuous columns. Continuous columns may have multiple modes whereas discrete columns are sometimes imbalanced making the modeling difficult.” CTGANs handle these challenges.

I came upon CTGAN after spending some time exploring GANs via blogs, videos etc. For building the model I use real T20 match data. However, CTGAN requires immense raw computing power and a lot of RAM. My initial attempts on Colab, my Mac (12 core, 32GB RAM), took forever before eventually crashing, I switched to Kaggle and used GPUs. Still I was only able to use only a miniscule part of my T20 dataset. My match data has 1.2 million rows, hoanything > 0.05% resulted in Kaggle crashing. Since I was able to use only a fraction, I executed the CTGAN model over several iterations, each iteration with a random 0.05% sample of the dataset. At the end of each iterations I also generate synthetic dataset. Over 12 iterations, I generate close 360K of ‘synthetic‘ T20 match data.

I then augment the 1.2 million rows of ‘real‘ T20 match data with the generated ‘synthetic T20 match data to run my Deep Learning model

D. Executing the CTGAN model

a. Read the real T20 match data

!pip install ctgan
import pandas as pd
import ctgan
from ctgan import CTGAN
from numpy.random import seed

# Read the T20 match data
df = pd.read_csv('/kaggle/input/cricket1/t20.csv')

# Randomly sample 0.05% of the dataset. Note larger datasets cause the algo to crash
train_dataset = df.sample(frac=0.05)

# Print the real T20 match data
print(train_dataset.head(10))
print(train_dataset.shape)

             batsmanIdx  bowlerIdx  ballNum  ballsRemaining  runs   runRate  \
363695         3333        432      134             119   153  1.285714   
1082839        3881       1180      218              30    93  3.100000   
595799         2366        683      187              65   120  1.846154   
737614         4490       1381      148              87   144  1.655172   
410202          934       1003       19             106    35  1.842105   
525627          921       1711      251               1     8  8.000000   
657669         4718       1602      130             115   145  1.260870   
666461         4309       1989       44              87    38  0.863636   
651229         3336        754       30              92    36  1.200000   
709892         3048        421       97              28   119  1.226804   

            numWickets  runsMomentum  perfIndex  isWinner  
363695            0      0.092437  18.333333         1  
1082839           5      0.200000   4.736842         0  
595799            4      0.107692   9.566667         0  
737614            1      0.114943   9.130435         1  
410202            0      0.103774  20.263158         0  
525627            8      3.000000   3.837209         0  
657669            0      0.095652  19.555556         0  
666461            0      0.126437   9.500000         0  
651229            0      0.119565  13.200000         0  
709892            3      0.285714   9.814433         1  
(59956, 10)

b. Run CTGAN model on the real T20 data

import pandas as pd
import ctgan
from ctgan import CTGAN
from numpy.random import seed
from pickle import TRUE

df = pd.read_csv('/kaggle/input/cricket1/t20.csv')

#Specify the categorical features. batsmanIdx & bowlerIdx are player embeddings
categorical_features = ['batsmanIdx','bowlerIdx']

# Create a empty dataframe for synthetic data
df1 = pd.DataFrame()

# Loop for 12 iterations. Minimize generator & discriminator loss
for i in range(12):
    print(i)
    train_dataset = df.sample(frac=0.05)
    seed(33)

    ctgan = CTGAN(epochs=20,verbose=True,generator_lr=.001,discriminator_lr=.001,batch_size=1000)
    ctgan.fit(train_dataset, categorical_features)

    # Generate synthetic data
    samples = ctgan.sample(30000)

   # Concatenate the synthetic data after each iteration
    df1 = pd.concat([df1,samples])
    print(samples.head())
    print(df1.shape)

# Output the synthetic data to file
df1.to_csv("output1.csv",index=False)

0
Epoch 1, Loss G:  8.3825,Loss D: -0.6159
Epoch 2, Loss G:  3.5117,Loss D: -0.3016
Epoch 3, Loss G:  2.1619,Loss D: -0.5713
Epoch 4, Loss G:  0.9847,Loss D:  0.1010
Epoch 5, Loss G:  0.6198,Loss D:  0.0789
Epoch 6, Loss G:  0.1710,Loss D:  0.0959
Epoch 7, Loss G:  0.3236,Loss D: -0.1554
Epoch 8, Loss G:  0.2317,Loss D: -0.0765
Epoch 9, Loss G: -0.0127,Loss D:  0.0275
Epoch 10, Loss G:  0.1477,Loss D: -0.0353
Epoch 11, Loss G:  0.0997,Loss D: -0.0129
Epoch 12, Loss G:  0.0066,Loss D: -0.0486
Epoch 13, Loss G:  0.0351,Loss D: -0.0805
Epoch 14, Loss G: -0.1399,Loss D: -0.0021
Epoch 15, Loss G: -0.1503,Loss D: -0.0518
Epoch 16, Loss G: -0.2306,Loss D: -0.0234
Epoch 17, Loss G: -0.2986,Loss D:  0.0469
Epoch 18, Loss G: -0.1941,Loss D: -0.0560
Epoch 19, Loss G: -0.3794,Loss D:  0.0000
Epoch 20, Loss G: -0.2763,Loss D:  0.0368
   batsmanIdx  bowlerIdx  ballNum  ballsRemaining  runs   runRate  numWickets  \
0         906        224        8              75    81  1.955153           4   
1        4159        433       17              31   126  1.799280           9   
2         229        351      192              66    82  1.608527           5   
3        1926        962       63               0   117  1.658105           0   
4         286        431      128               1    36  1.605079           0   

   runsMomentum  perfIndex  isWinner  
0      0.146670   6.937595         1  
1      0.160534  10.904346         1  
2      0.516010  11.698128         1  
3      0.380986  11.914613         0  
4      0.112255   5.392120         0  
(30000, 10)
1
Epoch 1, Loss G:  7.9977,Loss D: -0.3592
Epoch 2, Loss G:  3.7418,Loss D: -0.3371
Epoch 3, Loss G:  1.6685,Loss D: -0.3211
Epoch 4, Loss G:  1.0539,Loss D: -0.3495
Epoch 5, Loss G:  0.4664,Loss D: -0.0907
Epoch 6, Loss G:  0.4004,Loss D: -0.1208
Epoch 7, Loss G:  0.3250,Loss D: -0.1482
Epoch 8, Loss G:  0.1753,Loss D:  0.0169
Epoch 9, Loss G:  0.1382,Loss D:  0.0661
Epoch 10, Loss G:  0.1509,Loss D: -0.1023
Epoch 11, Loss G: -0.0235,Loss D:  0.0210
Epoch 12, Loss G: -0.1636,Loss D: -0.0124
Epoch 13, Loss G: -0.3370,Loss D: -0.0185
Epoch 14, Loss G: -0.3054,Loss D: -0.0085
Epoch 15, Loss G: -0.5142,Loss D:  0.0121
Epoch 16, Loss G: -0.3813,Loss D: -0.0921
Epoch 17, Loss G: -0.5838,Loss D:  0.0210
Epoch 18, Loss G: -0.4033,Loss D: -0.0181
Epoch 19, Loss G: -0.5711,Loss D:  0.0269
Epoch 20, Loss G: -0.4828,Loss D: -0.0830
   batsmanIdx  bowlerIdx  ballNum  ballsRemaining  runs   runRate  numWickets  \
0        2202        265      223              39    13  0.868927           0   
1        3641        856       35              59    26  2.236160           6   
2         676       2903      218              93    16  0.460693           1   
3        3482       3459       44             117   102  0.851471           8   
4        3046       3076       59               5    84  1.016824           2   

   runsMomentum  perfIndex  isWinner  
0      0.138586   4.733462         0  
1      0.124453   5.146831         1  
2      0.273168  10.106869         0  
3      0.129520   5.361127         0  
4      1.083525  25.677574         1  
(60000, 10)
...
...
11
Epoch 1, Loss G:  8.8362,Loss D: -0.7111
Epoch 2, Loss G:  4.1322,Loss D: -0.8468
Epoch 3, Loss G:  1.2782,Loss D:  0.1245
Epoch 4, Loss G:  1.1135,Loss D: -0.3588
Epoch 5, Loss G:  0.6033,Loss D: -0.1255
Epoch 6, Loss G:  0.6912,Loss D: -0.1906
Epoch 7, Loss G:  0.3340,Loss D: -0.1048
Epoch 8, Loss G:  0.3515,Loss D: -0.0730
Epoch 9, Loss G:  0.1702,Loss D:  0.0237
Epoch 10, Loss G:  0.1064,Loss D:  0.0632
Epoch 11, Loss G:  0.0884,Loss D: -0.0005
Epoch 12, Loss G:  0.0556,Loss D: -0.0607
Epoch 13, Loss G: -0.0917,Loss D: -0.0223
Epoch 14, Loss G: -0.1492,Loss D:  0.0258
Epoch 15, Loss G: -0.0986,Loss D: -0.0112
Epoch 16, Loss G: -0.1428,Loss D: -0.0060
Epoch 17, Loss G: -0.2225,Loss D: -0.0263
Epoch 18, Loss G: -0.2255,Loss D: -0.0328
Epoch 19, Loss G: -0.3482,Loss D:  0.0277
Epoch 20, Loss G: -0.2667,Loss D: -0.0721
   batsmanIdx  bowlerIdx  ballNum  ballsRemaining  runs   runRate  numWickets  \
0         367       1447      129              27    30  1.242120           2   
1        2481       1528      221               4    10  1.344024           2   
2        1034       3116      132              87   153  1.142750           3   
3        1201       2868      151              60   136  1.091638           1   
4        4327       3291      108              89    22  0.842775           2   

   runsMomentum  perfIndex  isWinner  
0      1.978739   6.393691         1  
1      0.539650   6.783990         0  
2      0.107156  12.154197         0  
3      3.193574  11.992059         0  
4      0.127507  12.210876         0  
(360000, 10)

E. Sample of the Synthetic data

synthetic_data = ctgan.sample(20000)
print(synthetic_data.head(100))

    batsmanIdx  bowlerIdx  ballNum  ballsRemaining  runs    runRate  \
0         1073       3059       72              72   149   2.230236   
1         3769       1443      106               7   137   0.881409   
2          448       3048      166               6   220   1.092504   
3         2969       1244      103              82   207  12.314862   
4          180       1372      125             111    14   1.310051   
..         ...        ...      ...             ...   ...        ...   
95        1521       1040      153               6   166   1.097363   
96        2366         62       25             114   119   0.910642   
97        3506       1736      100             118   140   1.640921   
98        3343       2347       47              54    50   0.696462   
99        1957       2888      136              27   153   1.315565   

    numWickets  runsMomentum  perfIndex  isWinner  
0            0      0.111707  17.466925         0  
1            1      0.130352  14.274113         0  
2            1      0.173541  11.076731         1  
3            1      0.218977   6.239951         0  
4            4      2.829380   9.183323         1  
..         ...           ...        ...       ...  
95           0      0.223437   7.011180         0  
96           1      0.451371  16.908120         1  
97           5      0.156936   9.217205         0  
98           6      0.124536   6.273091         0  
99           1      0.249329  14.221554         0  

[100 rows x 10 columns]

F. Evaluating the synthetic T20 match data

Here the quality of the synthetic data set is evaluated.

a) Statistical evaluation

  • Read the real T20 match data
  • Read the generated T20 synthetic match data
import pandas as pd

# Read the T20 match and synthetic match data
df = pd.read_csv('/kaggle/input/cricket1/t20.csv').  #1.2 million rows
synthetic=pd.read_csv('/kaggle/input/synthetic/synthetic.csv')   #300K

# Randomly sample 1000 rows, and generate stats
df1=df.sample(n=1000)
real=df1.describe()
realData_stats=real.transpose
print(realData_stats)

synthetic1=synthetic.sample(n=1000)
synthetic=synthetic1.describe()
syntheticData_stats=synthetic.transpose
syntheticData_stats

a) Stats of real T20 match data

<bound method DataFrame.transpose of         batsmanIdx    bowlerIdx      ballNum  ballsRemaining         runs  \
count  1000.000000  1000.000000  1000.000000     1000.000000  1000.000000   
mean   2323.940000  1776.481000   118.165000       59.236000    77.649000   
std    1329.703046  1011.470703    70.564291       35.312934    49.098763   
min       8.000000    13.000000     1.000000        1.000000    -2.000000   
25%    1134.750000   850.000000    58.000000       28.750000    39.000000   
50%    2265.000000  1781.500000   117.000000       59.000000    72.000000   
75%    3510.000000  2662.250000   178.000000       89.000000   111.000000   
max    4738.000000  3481.000000   265.000000      127.000000   246.000000   

           runRate   numWickets  runsMomentum    perfIndex     isWinner  
count  1000.000000  1000.000000   1000.000000  1000.000000  1000.000000  
mean      1.734979     2.614000      0.310568     9.580386     0.499000  
std       5.698104     2.267189      0.686171     4.530856     0.500249  
min      -2.000000     0.000000      0.071429     0.000000     0.000000  
25%       1.009063     1.000000      0.105769     6.666667     0.000000  
50%       1.272727     2.000000      0.141026     9.236842     0.000000  
75%       1.546891     4.000000      0.250000    12.146735     1.000000  
max     166.000000    10.000000     10.000000    30.800000     1.000000

b) Stats of Synthetic T20 match data

     
           batsmanIdx    bowlerIdx      ballNum  ballsRemaining         runs  \
count  1000.000000  1000.000000  1000.000000     1000.000000  1000.000000   
mean   2304.135000  1760.776000   116.081000       50.102000    74.357000   
std    1342.348684  1003.496003    72.019228       35.795236    48.103446   
min       2.000000    15.000000    -4.000000       -2.000000    -1.000000   
25%    1093.000000   881.000000    46.000000       18.000000    30.000000   
50%    2219.500000  1763.500000   116.000000       45.000000    75.000000   
75%    3496.500000  2644.750000   180.250000       77.000000   112.000000   
max    4718.000000  3481.000000   253.000000      124.000000   222.000000   

           runRate   numWickets  runsMomentum    perfIndex     isWinner  
count  1000.000000  1000.000000   1000.000000  1000.000000  1000.000000  
mean      1.637225     3.096000      0.336540     9.278073     0.507000  
std       1.691060     2.640408      0.502346     4.727677     0.500201  
min      -4.388339     0.000000      0.083351    -0.902991     0.000000  
25%       1.077789     1.000000      0.115770     5.731931     0.000000  
50%       1.369655     2.000000      0.163085     9.104328     1.000000  
75%       1.660477     5.000000      0.311586    12.619318     1.000000  
max      23.757001    10.000000      4.630908    29.829497     1.000000

c) Plotting the Generator and Discriminator loss

import pandas as pd

# CTGAN prints out a new line for each epoch
epochs_output = str(output).split('\n')

# CTGAN separates the values with commas
raw_values = [line.split(',') for line in epochs_output]
loss_values = pd.DataFrame(raw_values)[:-1] # convert to df and delete last row (empty)

# Rename columns
loss_values.columns = ['Epoch', 'Generator Loss', 'Discriminator Loss']

# Extract the numbers from each column 
loss_values['Epoch'] = loss_values['Epoch'].str.extract('(\d+)').astype(int)
loss_values['Generator Loss'] = loss_values['Generator Loss'].str.extract('([-+]?\d*\.\d+|\d+)').astype(float)
loss_values['Discriminator Loss'] = loss_values['Discriminator Loss'].str.extract('([-+]?\d*\.\d+|\d+)').astype(float)

# the result is a row for each epoch that contains the generator and discriminator loss
loss_values.head()

	Epoch	Generator Loss	Discriminator Loss
0	1	8.0158	-0.3840
1	2	4.6748	-0.9589
2	3	1.1503	-0.0066
3	4	1.5593	-0.8148
4	5	0.6734	-0.1425
5	6	0.5342	-0.2202
6	7	0.4539	-0.1462
7	8	0.2907	-0.0155
8	9	0.2399	0.0172
9	10	0.1520	-0.0236
import plotly.graph_objects as go

# Plot loss function
fig = go.Figure(data=[go.Scatter(x=loss_values['Epoch'], y=loss_values['Generator Loss'], name='Generator Loss'),
                      go.Scatter(x=loss_values['Epoch'], y=loss_values['Discriminator Loss'], name='Discriminator Loss')])


# Update the layout for best viewing
fig.update_layout(template='plotly_white',
                    legend_orientation="h",
                    legend=dict(x=0, y=1.1))

title = 'CTGAN loss function for T20 dataset - ' 
fig.update_layout(title=title, xaxis_title='Epoch', yaxis_title='Loss')
fig.show()

G. Qualitative evaluation of Synthetic data

a) Quality of continuous columns in synthetic data

KSComplement -This metric computes the similarity of a real column vs. a synthetic column in terms of the column shapes.The KSComplement uses the Kolmogorov-Smirnov statistic. Closer to 1.0 is good and 0 is worst

from sdmetrics.single_column import KSComplement
numerical_columns=['ballNum','ballsRemaining','runs','runRate','numWickets','runsMomentum','perfIndex']
total_score = 0
for column_name in numerical_columns:
    column_score = KSComplement.compute(df[column_name], synthetic[column_name])
    total_score += column_score
    print('Column:', column_name, ', Score: ', column_score)

print('\nAverage: ', total_score/len(numerical_columns))

Column: ballNum , Score:  0.9502754283367316
Column: ballsRemaining , Score:  0.8770284103276166
Column: runs , Score:  0.9136464248633367
Column: runRate , Score:  0.9183841670732166
Column: numWickets , Score:  0.9016209114638712
Column: runsMomentum , Score:  0.8773491702213716
Column: perfIndex , Score:  0.9173808852778924

Average:  0.9079550567948624

b) Quality of categorical columns

This statistic measures the quality of generated categorical columns. 1 is best and 0 is worst

categorical_columns=['batsmanIdx','bowlerIdx']
from sdmetrics.single_column import TVComplement

total_score = 0
for column_name in categorical_columns:
    column_score = TVComplement.compute(df[column_name], synthetic[column_name])
    total_score += column_score
    print('Column:', column_name, ', Score: ', column_score)

print('\nAverage: ', total_score/len(categorical_columns))

Column: batsmanIdx , Score:  0.8436263499539245
Column: bowlerIdx , Score:  0.7356177407921669

Average:  0.7896220453730457

The performance is decent but not excellent. I was unable to execute more epochs as it it required larger than the memory allowed

c) Correlation similarity

This metric measures the correlation between a pair of numerical columns and computes the similarity between the real and synthetic data – it compares the trends of 2D distributions. Best 1.0 and 0.0 is worst

import itertools
from sdmetrics.column_pairs import CorrelationSimilarity

total_score = 0
total_pairs = 0
for pair in itertools.combinations(numerical_columns,2):
    col_A, col_B = pair
    score = CorrelationSimilarity.compute(df[[col_A, col_B]], synthetic[[col_A, col_B]])
    print('Columns:', pair, ' Score:', score)
    total_score += score
    total_pairs += 1

print('\nAverage: ', total_score/total_pairs)

Columns: ('ballNum', 'ballsRemaining')  Score: 0.7153942317384889
Columns: ('ballNum', 'runs')  Score: 0.8838043045134777
Columns: ('ballNum', 'runRate')  Score: 0.8710243133637056
Columns: ('ballNum', 'numWickets')  Score: 0.7978515509750435
Columns: ('ballNum', 'runsMomentum')  Score: 0.8956281260834316
Columns: ('ballNum', 'perfIndex')  Score: 0.9275145840528048
Columns: ('ballsRemaining', 'runs')  Score: 0.9566928975064546
Columns: ('ballsRemaining', 'runRate')  Score: 0.9127313819127167
Columns: ('ballsRemaining', 'numWickets')  Score: 0.6770737279315224
Columns: ('ballsRemaining', 'runsMomentum')  Score: 0.7939260278412358
Columns: ('ballsRemaining', 'perfIndex')  Score: 0.8694582252638351
Columns: ('runs', 'runRate')  Score: 0.999593795992159
Columns: ('runs', 'numWickets')  Score: 0.9510731832916608
Columns: ('runs', 'runsMomentum')  Score: 0.9956131422133428
Columns: ('runs', 'perfIndex')  Score: 0.9742931845536701
Columns: ('runRate', 'numWickets')  Score: 0.8859830711832263
Columns: ('runRate', 'runsMomentum')  Score: 0.9174744874779561
Columns: ('runRate', 'perfIndex')  Score: 0.9491100087911353
Columns: ('numWickets', 'runsMomentum')  Score: 0.8989709776329797
Columns: ('numWickets', 'perfIndex')  Score: 0.7178946968801441
Columns: ('runsMomentum', 'perfIndex')  Score: 0.9744441623018661

Average:  0.8840738134048025

d) Category coverage

This metric measures whether a synthetic column covers all the possible categories that are present in a real column. 1.0 is best , 0 is worst

from sdmetrics.single_column import CategoryCoverage

total_score = 0
for column_name in categorical_columns:
    column_score = CategoryCoverage.compute(df[column_name], synthetic[column_name])
    total_score += column_score
    print('Column:', column_name, ', Score: ', column_score)

print('\nAverage: ', total_score/len(categorical_columns))

Column: batsmanIdx , Score:  0.9533951919021509
Column: bowlerIdx , Score:  0.9913966160022942

Average:  0.9723959039522225

H. Augmenting the T20 match data set

In this final part I augment my T20 match data set with the generated synthetic T20 data set.

import pandas as pd
from numpy import savetxt
import tensorflow as tf
from tensorflow import keras
import pandas as pd
import numpy as np


from keras.layers import Input, Embedding, Flatten, Dense, Reshape, Concatenate, Dropout
from keras.models import Model
import matplotlib.pyplot as plt

# Read real and synthetic data
df = pd.read_csv('/kaggle/input/cricket1/t20.csv')
synthetic=pd.read_csv('/kaggle/input/synthetic/synthetic.csv')

# Augment the data. Concatenate real & synthetic data
df1=pd.concat([df,synthetic])

# Create training and test samples
print("Shape of dataframe=",df1.shape)
train_dataset = df1.sample(frac=0.8,random_state=0)
test_dataset = df1.drop(train_dataset.index)
train_dataset1 = train_dataset[['batsmanIdx','bowlerIdx','ballNum','ballsRemaining','runs','runRate','numWickets','runsMomentum','perfIndex']]
test_dataset1 = test_dataset[['batsmanIdx','bowlerIdx','ballNum','ballsRemaining','runs','runRate','numWickets','runsMomentum','perfIndex']]
train_dataset1
train_labels = train_dataset.pop('isWinner')
test_labels = test_dataset.pop('isWinner')
print(train_dataset1.shape)

a=train_dataset1.describe()
stats=a.transpose
print(a)

a) Create A Deep Learning Model in Keras

from numpy.random import seed
seed(33)
tf.random.set_seed(432)
# create input layers for each of the predictors
batsmanIdx_input = Input(shape=(1,), name='batsmanIdx')
bowlerIdx_input = Input(shape=(1,), name='bowlerIdx')
ballNum_input = Input(shape=(1,), name='ballNum')
ballsRemaining_input = Input(shape=(1,), name='ballsRemaining')
runs_input = Input(shape=(1,), name='runs')
runRate_input = Input(shape=(1,), name='runRate')
numWickets_input = Input(shape=(1,), name='numWickets')
runsMomentum_input = Input(shape=(1,), name='runsMomentum')
perfIndex_input = Input(shape=(1,), name='perfIndex')

no_of_unique_batman=len(df1["batsmanIdx"].unique()) 
print(no_of_unique_batman)
no_of_unique_bowler=len(df1["bowlerIdx"].unique()) 
print(no_of_unique_bowler)

embedding_size_bat = no_of_unique_batman ** (1/4)
print(embedding_size_bat)
embedding_size_bwl = no_of_unique_bowler ** (1/4)
print(embedding_size_bwl)

# create embedding layer for the categorical predictor
batsmanIdx_embedding = Embedding(input_dim=no_of_unique_batman+1, output_dim=16,input_length=1)(batsmanIdx_input)
print(batsmanIdx_embedding)
batsmanIdx_flatten = Flatten()(batsmanIdx_embedding)
print(batsmanIdx_flatten)
bowlerIdx_embedding = Embedding(input_dim=no_of_unique_bowler+1, output_dim=16,input_length=1)(bowlerIdx_input)
bowlerIdx_flatten = Flatten()(bowlerIdx_embedding)
print(bowlerIdx_flatten)
# concatenate all the predictors
x = keras.layers.concatenate([batsmanIdx_flatten,bowlerIdx_flatten, ballNum_input, ballsRemaining_input, runs_input, runRate_input, numWickets_input, runsMomentum_input, perfIndex_input])
print(x.shape)
# add hidden layers
x = Dense(96, activation='relu')(x)
x = Dropout(0.1)(x)
x = Dense(64, activation='relu')(x)
x = Dropout(0.1)(x)
x = Dense(32, activation='relu')(x)
x = Dropout(0.1)(x)
x = Dense(16, activation='relu')(x)
x = Dropout(0.1)(x)
x = Dense(8, activation='relu')(x)
x = Dropout(0.1)(x)
# add output layer
output = Dense(1, activation='sigmoid', name='output')(x)
print(output.shape)
# create model
model = Model(inputs=[batsmanIdx_input,bowlerIdx_input, ballNum_input, ballsRemaining_input, runs_input, runRate_input, numWickets_input, runsMomentum_input, perfIndex_input], outputs=output)
model.summary()
# compile model
#optimizer=keras.optimizers.Adam(learning_rate=.01, beta_1=0.1, beta_2=0.999, epsilon=None, decay=0.0, amsgrad=True)
#optimizer=keras.optimizers.RMSprop(learning_rate=0.001, rho=0.2, momentum=0.2, epsilon=1e-07)
#optimizer=keras.optimizers.SGD(learning_rate=.01,momentum=0.1) #- Works without dropout
#optimizer = tf.keras.optimizers.RMSprop(0.01)
#optimizer=keras.optimizers.SGD(learning_rate=.01,momentum=0.1)
#optimizer=keras.optimizers.RMSprop(learning_rate=.005, rho=0.1, momentum=0, epsilon=1e-07)

optimizer=keras.optimizers.Adam(learning_rate=.015, beta_1=0.9, beta_2=0.999, epsilon=1e-07, amsgrad=True)

model.compile(optimizer=optimizer, loss='binary_crossentropy', metrics=['accuracy'])

# train the model
history=model.fit([train_dataset1['batsmanIdx'],train_dataset1['bowlerIdx'],train_dataset1['ballNum'],train_dataset1['ballsRemaining'],train_dataset1['runs'],
           train_dataset1['runRate'],train_dataset1['numWickets'],train_dataset1['runsMomentum'],train_dataset1['perfIndex']], train_labels, epochs=20, batch_size=1024,
          validation_data = ([test_dataset1['batsmanIdx'],test_dataset1['bowlerIdx'],test_dataset1['ballNum'],test_dataset1['ballsRemaining'],test_dataset1['runs'],
           test_dataset1['runRate'],test_dataset1['numWickets'],test_dataset1['runsMomentum'],test_dataset1['perfIndex']],test_labels), verbose=1)

plt.plot(history.history["loss"])
plt.plot(history.history["val_loss"])
plt.title("model loss")
plt.ylabel("loss")
plt.xlabel("epoch")
plt.legend(["train", "test"], loc="upper left")
plt.show()

==================================================================================================
Total params: 144,497
Trainable params: 144,497
Non-trainable params: 0
__________________________________________________________________________________________________
Epoch 1/20
1219/1219 [==============================] - 15s 11ms/step - loss: 0.6285 - accuracy: 0.6372 - val_loss: 0.5164 - val_accuracy: 0.7606
Epoch 2/20
1219/1219 [==============================] - 14s 11ms/step - loss: 0.5594 - accuracy: 0.7121 - val_loss: 0.4920 - val_accuracy: 0.7663
Epoch 3/20
1219/1219 [==============================] - 14s 12ms/step - loss: 0.5338 - accuracy: 0.7244 - val_loss: 0.4541 - val_accuracy: 0.7878
Epoch 4/20
1219/1219 [==============================] - 14s 11ms/step - loss: 0.5176 - accuracy: 0.7317 - val_loss: 0.4226 - val_accuracy: 0.7933
Epoch 5/20
1219/1219 [==============================] - 13s 11ms/step - loss: 0.4966 - accuracy: 0.7420 - val_loss: 0.4547 - val_accuracy: 0.7
...
...
poch 18/20
1219/1219 [==============================] - 14s 11ms/step - loss: 0.4300 - accuracy: 0.7747 - val_loss: 0.3536 - val_accuracy: 0.8288
Epoch 19/20
1219/1219 [==============================] - 14s 12ms/step - loss: 0.4269 - accuracy: 0.7766 - val_loss: 0.3565 - val_accuracy: 0.8302
Epoch 20/20
1219/1219 [==============================] - 14s 11ms/step - loss: 0.4259 - accuracy: 0.7775 - val_loss: 0.3498 - val_accuracy: 0.831

As can be seen the accuracy with augmented dataset is around 0.77, while without it I was getting 0.867 with just the real data. This degradation is probably due to the folllowing reasons

  • Only a fraction of the dataset was used for training. This was not representative of the data distribution for CTGAN to correctly synthesise data
  • The number of epochs had to be kept low to prevent Kaggle/Colab from crashing

I. Conclusion

This post shows how we can generate synthetic T20 match data to augment real T20 match data. Assuming we have sufficient processing power we should be able to generate synthetic data for augmenting our data set. This should improve the accuracy of the Win Probabily Deep Learning model.

References

  1. Generative Adversarial Networks – Ian Goodfellow et al.
  2. Modeling Tabular data using Conditional GAN
  3. Introduction to GAN
  4. Ian Goodfellow: Generative Adversarial Networks (GANs) | Lex Fridman Podcast
  5. CTGAN
  6. Tabular Synthetic Data Generation using CTGAN
  7. CTGAN Model
  8. Interpreting the Progress of CTGAN
  9. CTGAN metrics

Also see

  1. Using embeddings, collaborative filtering with Deep Learning to analyse T20 players
  2. Using Reinforcement Learning to solve Gridworld
  3. Deep Learning from first principles in Python, R and Octave – Part 4
  4. Practical Machine Learning with R and Python – Part 5
  5. Cricketr adds team analytics to its repertoire!!!
  6. yorkpy takes a hat-trick, bowls out Intl. T20s, BBL and Natwest T20!!!
  7. Deconstructing Convolutional Neural Networks with Tensorflow and Keras
  8. My TEDx talk on the “Internet of Things”
  9. Introducing QCSimulator: A 5-qubit quantum computing simulator in R
  10. The Anomaly

To see all posts click Index of posts

GooglyPlusPlus: Win Probability using Deep Learning and player embeddings

In my last post ‘GooglyPlusPlus now with Win Probability Analysis for all T20 matches‘ I had discussed the performance of my ML models, created with and without player embeddings, in computing the Win Probability of T20 matches. With batsman & bowler embeddings I got much better performance than without the embeddings

  • glmnet – Accuracy – 0.73
  • Random Forest (RF) – Accuracy – 0.92

While the Random Forest gave excellent accuracy, it was bulky and also took an unusually long time to predict the Win Probability of a single T20 match. The above 2 ML models were built using R’s Tidymodels. glmnet was fast, but I wanted to see if I could create a ML model that was better, lighter and faster. I had initially tried to use Tensorflow, Keras in Python but then abandoned it, since I did not know how to port the Deep Learning model to R and use in my app GooglyPlusPlus.

But later, since I was stuck with a bulky Random Forest model, I decided to again explore options for saving the Keras Deep Learning model and loading it in R. I found out that saving the model as .h5, we can load it in R and use it for predictions. Hence, I rebuilt a Deep Learning model using Keras, Python with player embeddings and I got excellent performance. The DL model was light and had an accuracy 0.8639 with an ROC_AUC of 0.964 which was great!

GooglyPlusPlus uses data from Cricsheet and is based on my R package yorkr

You can try out this latest version of GooglyPlusPlus at gpp2023-1

Here are the steps

A. Build a Keras Deep Learning model

a. Import necessary packages

import pandas as pd
import numpy as np
from zipfile import ZipFile
import tensorflow as tf
from tensorflow import keras
from tensorflow.keras import layers
from tensorflow.keras import regularizers
from pathlib import Path
import matplotlib.pyplot as plt

b, Upload the data of all 9 T20 leagues (BBL, CPL, IPL, T20 (men) , T20(women), NTB, CPL, SSM, WBB)

# Read all T20 leagues 
df1=pd.read_csv('t20.csv')
print("Shape of dataframe=",df1.shape)

# Create training and test data set
train_dataset = df1.sample(frac=0.8,random_state=0)
test_dataset = df1.drop(train_dataset.index)
train_dataset1 = train_dataset[['batsmanIdx','bowlerIdx','ballNum','ballsRemaining','runs','runRate','numWickets','runsMomentum','perfIndex']]
test_dataset1 = test_dataset[['batsmanIdx','bowlerIdx','ballNum','ballsRemaining','runs','runRate','numWickets','runsMomentum','perfIndex']]
train_dataset1

# Set the target data
train_labels = train_dataset.pop('isWinner')
test_labels = test_dataset.pop('isWinner')
train_dataset1

a=train_dataset1.describe()
stats=a.transpose
a

c. Create a Deep Learning ML model using batsman & bowler embeddings

import pandas as pd
import numpy as np
from keras.layers import Input, Embedding, Flatten, Dense
from keras.models import Model
from keras.layers import Input, Embedding, Flatten, Dense, Reshape, Concatenate, Dropout
from keras.models import Model

# Set seed
tf.random.set_seed(432)

# create input layers for each of the predictors
batsmanIdx_input = Input(shape=(1,), name='batsmanIdx')
bowlerIdx_input = Input(shape=(1,), name='bowlerIdx')
ballNum_input = Input(shape=(1,), name='ballNum')
ballsRemaining_input = Input(shape=(1,), name='ballsRemaining')
runs_input = Input(shape=(1,), name='runs')
runRate_input = Input(shape=(1,), name='runRate')
numWickets_input = Input(shape=(1,), name='numWickets')
runsMomentum_input = Input(shape=(1,), name='runsMomentum')
perfIndex_input = Input(shape=(1,), name='perfIndex')

# Set the embedding size as the 4th root of unique batsmen, bowlers
no_of_unique_batman=len(df1["batsmanIdx"].unique()) 
no_of_unique_bowler=len(df1["bowlerIdx"].unique()) 
embedding_size_bat = no_of_unique_batman ** (1/4)
embedding_size_bwl = no_of_unique_bowler ** (1/4)


# create embedding layer for the categorical predictor
batsmanIdx_embedding = Embedding(input_dim=no_of_unique_batman+1, output_dim=16,input_length=1)(batsmanIdx_input)
batsmanIdx_flatten = Flatten()(batsmanIdx_embedding)
bowlerIdx_embedding = Embedding(input_dim=no_of_unique_bowler+1, output_dim=16,input_length=1)(bowlerIdx_input)
bowlerIdx_flatten = Flatten()(bowlerIdx_embedding)

# concatenate all the predictors
x = keras.layers.concatenate([batsmanIdx_flatten,bowlerIdx_flatten, ballNum_input, ballsRemaining_input, runs_input, runRate_input, numWickets_input, runsMomentum_input, perfIndex_input])

# add hidden layers
# Use dropouts for regularisation
x = Dense(64, activation='relu')(x)
x = Dropout(0.1)(x)
x = Dense(32, activation='relu')(x)
x = Dropout(0.1)(x)
x = Dense(16, activation='relu')(x)
x = Dropout(0.1)(x)
x = Dense(8, activation='relu')(x)
x = Dropout(0.1)(x)

# add output layer
output = Dense(1, activation='sigmoid', name='output')(x)
print(output.shape)

# create a DL model
model = Model(inputs=[batsmanIdx_input,bowlerIdx_input, ballNum_input, ballsRemaining_input, runs_input, runRate_input, numWickets_input, runsMomentum_input, perfIndex_input], outputs=output)
model.summary()

# compile model
optimizer=keras.optimizers.Adam(learning_rate=.01, beta_1=0.9, beta_2=0.999, epsilon=1e-07, decay=0.0, amsgrad=True)

model.compile(optimizer=optimizer, loss='binary_crossentropy', metrics=['accuracy'])

# train the model
history=model.fit([train_dataset1['batsmanIdx'],train_dataset1['bowlerIdx'],train_dataset1['ballNum'],train_dataset1['ballsRemaining'],train_dataset1['runs'],
           train_dataset1['runRate'],train_dataset1['numWickets'],train_dataset1['runsMomentum'],train_dataset1['perfIndex']], train_labels, epochs=40, batch_size=1024,
          validation_data = ([test_dataset1['batsmanIdx'],test_dataset1['bowlerIdx'],test_dataset1['ballNum'],test_dataset1['ballsRemaining'],test_dataset1['runs'],
           test_dataset1['runRate'],test_dataset1['numWickets'],test_dataset1['runsMomentum'],test_dataset1['perfIndex']],test_labels), verbose=1)

plt.plot(history.history["loss"])
plt.plot(history.history["val_loss"])
plt.title("model loss")
plt.ylabel("loss")
plt.xlabel("epoch")
plt.legend(["train", "test"], loc="upper left")
plt.show()

Model: "model_5"
__________________________________________________________________________________________________
 Layer (type)                   Output Shape         Param #     Connected to                     
==================================================================================================
 batsmanIdx (InputLayer)        [(None, 1)]          0           []                               
                                                                                                  
 bowlerIdx (InputLayer)         [(None, 1)]          0           []                               
                                                                                                  
 embedding_10 (Embedding)       (None, 1, 16)        75888       ['batsmanIdx[0][0]']             
                                                                                                  
 embedding_11 (Embedding)       (None, 1, 16)        55808       ['bowlerIdx[0][0]']              
                                                                                                  
 flatten_10 (Flatten)           (None, 16)           0           ['embedding_10[0][0]']           
                                                                                                  
 flatten_11 (Flatten)           (None, 16)           0           ['embedding_11[0][0]']           
                                                                                                  
 ballNum (InputLayer)           [(None, 1)]          0           []                               
                                                                                                  
 ballsRemaining (InputLayer)    [(None, 1)]          0           []                               
                                                                                                  
 runs (InputLayer)              [(None, 1)]          0           []                               
                                                                                                  
 runRate (InputLayer)           [(None, 1)]          0           []                               
                                                                                                  
 numWickets (InputLayer)        [(None, 1)]          0           []                               
                                                                                                  
 runsMomentum (InputLayer)      [(None, 1)]          0           []                               
                                                                                                  
 perfIndex (InputLayer)         [(None, 1)]          0           []                               
                                                                                                  
 concatenate_5 (Concatenate)    (None, 39)           0           ['flatten_10[0][0]',             
                                                                  'flatten_11[0][0]',             
                                                                  'ballNum[0][0]',                
                                                                  'ballsRemaining[0][0]',         
                                                                  'runs[0][0]',                   
                                                                  'runRate[0][0]',                
                                                                  'numWickets[0][0]',             
                                                                  'runsMomentum[0][0]',           
                                                                  'perfIndex[0][0]']              
                                                                                                  
 dense_19 (Dense)               (None, 64)           2560        ['concatenate_5[0][0]']          
                                                                                                  
 dropout_19 (Dropout)           (None, 64)           0           ['dense_19[0][0]']               
                                                                                                  
 dense_20 (Dense)               (None, 32)           2080        ['dropout_19[0][0]']             
                                                                                                  
 dropout_20 (Dropout)           (None, 32)           0           ['dense_20[0][0]']               
                                                                                                  
 dense_21 (Dense)               (None, 16)           528         ['dropout_20[0][0]']             
                                                                                                  
 dropout_21 (Dropout)           (None, 16)           0           ['dense_21[0][0]']               
                                                                                                  
 dense_22 (Dense)               (None, 8)            136         ['dropout_21[0][0]']             
                                                                                                  
 dropout_22 (Dropout)           (None, 8)            0           ['dense_22[0][0]']               
                                                                                                  
 output (Dense)                 (None, 1)            9           ['dropout_22[0][0]']             
                                                                                                  
==================================================================================================
Total params: 137,009
Trainable params: 137,009
Non-trainable params: 0
__________________________________________________________________________________________________
Epoch 1/40
937/937 [==============================] - 11s 10ms/step - loss: 0.5683 - accuracy: 0.6968 - val_loss: 0.4480 - val_accuracy: 0.7708
Epoch 2/40
937/937 [==============================] - 9s 10ms/step - loss: 0.4477 - accuracy: 0.7721 - val_loss: 0.4305 - val_accuracy: 0.7833
Epoch 3/40
937/937 [==============================] - 9s 10ms/step - loss: 0.4229 - accuracy: 0.7832 - val_loss: 0.3984 - val_accuracy: 0.7936
...
...
937/937 [==============================] - 10s 10ms/step - loss: 0.2909 - accuracy: 0.8627 - val_loss: 0.2943 - val_accuracy: 0.8613
Epoch 38/40
937/937 [==============================] - 10s 10ms/step - loss: 0.2892 - accuracy: 0.8633 - val_loss: 0.2933 - val_accuracy: 0.8621
Epoch 39/40
937/937 [==============================] - 10s 10ms/step - loss: 0.2889 - accuracy: 0.8638 - val_loss: 0.2941 - val_accuracy: 0.8620
Epoch 40/40
937/937 [==============================] - 10s 11ms/step - loss: 0.2886 - accuracy: 0.8639 - val_loss: 0.2929 - val_accuracy: 0.8621

d. Compute and plot the ROC-AUC for the above model

from sklearn.metrics import roc_curve

# Select a random sample set
tf.random.set_seed(59)
train = df1.sample(frac=0.9,random_state=0)
test = df1.drop(train_dataset.index)
test_dataset1 = test[['batsmanIdx','bowlerIdx','ballNum','ballsRemaining','runs','runRate','numWickets','runsMomentum','perfIndex']]
test_labels = test.pop('isWinner')

# Compute the predicted values
y_pred_keras = model.predict([test_dataset1['batsmanIdx'],test_dataset1['bowlerIdx'],test_dataset1['ballNum'],test_dataset1['ballsRemaining'],test_dataset1['runs'],
           test_dataset1['runRate'],test_dataset1['numWickets'],test_dataset1['runsMomentum'],test_dataset1['perfIndex']]).ravel()

# Compute TPR & FPR
fpr_keras, tpr_keras, thresholds_keras = roc_curve(test_labels, y_pred_keras)

fpr_keras, tpr_keras, thresholds_keras = roc_curve(test_labels, y_pred_keras)
from sklearn.metrics import auc

# Plot the Area Under the Curve (AUC)
auc_keras = auc(fpr_keras, tpr_keras)
plt.figure(1)
plt.plot([0, 1], [0, 1], 'k--')
plt.plot(fpr_keras, tpr_keras, label='Keras (area = {:.3f})'.format(auc_keras))
plt.xlabel('False positive rate')
plt.ylabel('True positive rate')
plt.title('ROC curve')
plt.legend(loc='best')
plt.show()

The ROC_AUC for the Deep Learning Model is 0.946 as seen below

e. Save the Keras model for use in Python

from keras.models import Model
model.save("wpDL.h5")

f. Load the model in R using rhdf5 package for use in GooglyPlusPlus

library(rhdf5)
dl_model <- load_model_hdf5('wpDL.h5')

This was a huge success for me to be able to create the Deep Learning model in Python and use it in my Shiny app GooglyPlusPlus. The Deep Learning Keras model is light-weight and extremely fast.

The Deep Learning model has now been integrated into GooglyPlusPlus. Now you can check the Win Probability using both a) glmnet (Logistic Regression with lasso regularisation) b) Keras Deep Learning model with dropouts as regularisation

In addition I have created 2 features based on Win Probability (WP)

i) Win Probability (Side-by-side – Plot(interactive) : With this functionality the 1st and 2nd innings will be side-by-side. When the 1st innings is played by team 1, the Win Probability of team 2 = 100 – WP (team1). Similarly, when the 2nd innings is being played by team 2, the Win Probability of team1 = 100 – WP (team 2)

ii) Win Probability (Overlapping) – Plot (static): With this functionality the Win Probabilities of both team1(1st innings) & team 2 (2nd innings) are displayed overlapping, so that we can see how the probabilities vary ball-by-ball.

Note: Since the same UI is used for all match functions I had to re-use the Plot(interactive) and Plot(static) radio buttons for Win Probability (Side-by-side) and Win Probability(Overlapping) respectively

Here are screenshots using both ML models with both functionality for some random matches

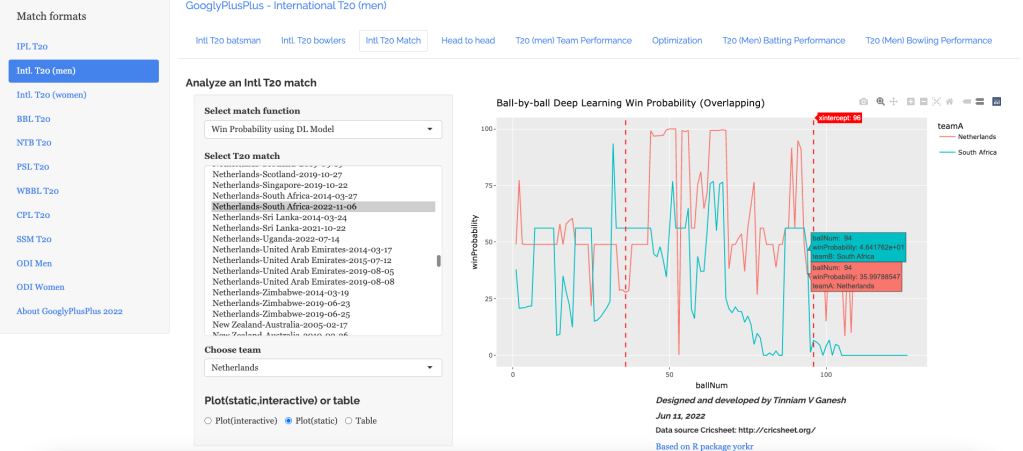
B) ICC T20 Men World Cup – Netherland-South Africa- 2022-11-06

i) Match Worm wicket chart

ii) Win Probability with LR (Side-by-Side- Plot(interactive))

iii) Win Probability LR (Overlapping- Plot(static))

iv) Win Probability Deep Learning (Side-by-side – Plot(interactive)

In the 213th ball of the innings South Africa was slightly ahead of Netherlands. After that they crashed and burned!

v) Win Probability Deep Learning (Overlapping – Plot (static)

It can be seen that in the 94th ball of both innings South Africa was ahead of Netherlands before the eventual slump.

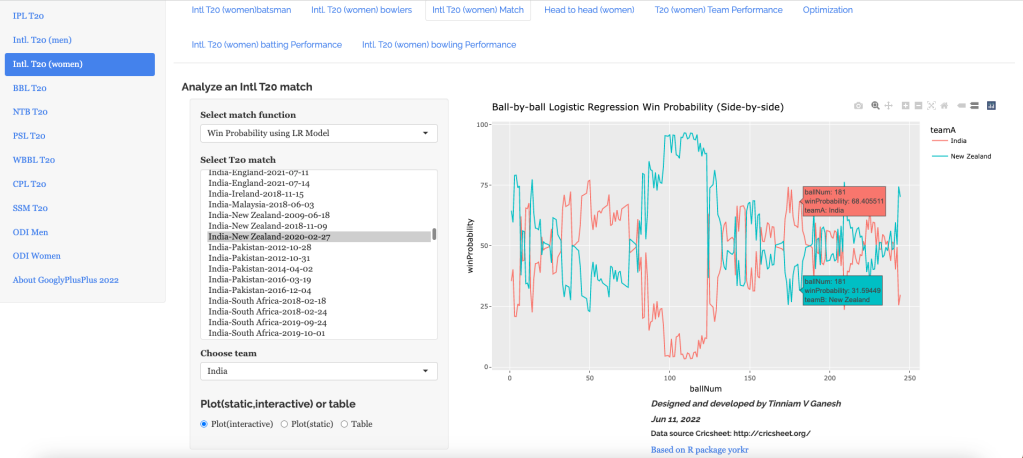
C) Intl. T20 (Women) India – New Zealand – 2020 – 02 – 27

Here is an interesting match between India and New Zealand T20 Women’s teams. NZ successfully chased the India’s total in a wildly swinging fortunes. See the charts below

i) Match Worm Wicket chart

ii) Win Probability with LR (Side-by-side – Plot (interactive)

iii) Win Probability with LR (Overlapping – Plot (static)

iv) Win Probability with DL model (Side-by-side – Plot (interactive))

v) Win Probability with DL model (Overlapping – Plot (static))

The above functionality in plotting the Win Probability using LR or DL with both options (Side-by-side or Overlapping) is available for all 9 T20 leagues currently supported by GooglyPlusPlus.

Go ahead and give gpp2023-1 a try!!!

Do also check out my other posts’

  1. Deep Learning from first principles in Python, R and Octave – Part 7
  2. Big Data 6: The T20 Dance of Apache NiFi and yorkpy
  3. Latency, throughput implications for the Cloud
  4. Design Principles of Scalable, Distributed Systems
  5. Cricpy adds team analytics to its arsenal!!
  6. Analyzing performances of cricketers using cricketr template
  7. Modeling a Car in Android
  8. Using Linear Programming (LP) for optimizing bowling change or batting lineup in T20 cricket
  9. Introducing QCSimulator: A 5-qubit quantum computing simulator in R
  10. Experiments with deblurring using OpenCV
  11. Using embeddings, collaborative filtering with Deep Learning to analyse T20 players

To see all posts click Index of posts

Using embeddings, collaborative filtering with Deep Learning to analyse T20 players

There is a school of thought which considers that total runs scored and strike rate for a batsman, or total wickets taken and economy rate for a bowler, do not tell the whole story. This is true to a fair extent. The runs scored or the wickets taken could have been against weaker teams and hence the runs, strike rate or the wickets and economy rate alone do not capture all the performance details of the batsman or bowler. A technique to determine the performance of batsmen against different bowlers and identify the batsman’s possible performance even against bowlers he/she has not yet faced could be done with collaborative filtering. Collaborative filtering, with embeddings can also be used to group players with similar characteristics. Similarly, we could also identify the performance of bowlers versus different batsmen. Hence we need to look at average runs, SR and total wickets, ER with the lens of batsmen, bowlers against similar opposition. This is where collaborative filtering is useful.

The table below shows the performance of all batsman against all bowlers in the table below. The row in the table below is the batsman and the column is the bowler, with the value in the cell is the total Runs scored by the batsman against the bowler in all matches. Note the values are 0 for batsmen who have not yet faced specific bowlers. The table is fairly sparse.

Table A

Similarly, we can compute the performance of all bowlers against all batsmen as in the table below. Here the row is the bowler, the column batsman and the value in the cell is the number of times the bowler got the batsman’s wicket. As before the data is sparsely populated

This problem of computing batsman’s performance against bowlers or vice versa, is identical to the user vs movie rating problem used in collaborative filtering. For e.g we could consider

This above problem depicted could be computed using collaborative filtering with embeddings. We could assign sequential numbers for the batsmen from 1 to M, and for the bowlers from 1 to N. The total runs scored could be represented only for the rows where there are values. One way to solve this problem in Machine Learning is to use One Hot Encoding (OHE), where we assign values for each row and each column and map the values of the table with values of the cell for each combination. But this would take a enormous computation time and memory. The solution to this is use vector embeddings. Here embeddings could be used for capturing the sparse tensors between the batsmen, bowlers, runs scored or vice versa between bowlers against batsmen and the wickets taken. We only need to consider the cells for which values exist. An embedding is a relatively low-dimensional space, into which you can translate high-dimensional vectors. An embedding captures some of the semantics of the input by placing semantically similar inputs close together in the embedding space.

a) To compute bowler performances and identify similarities between bowlers the following embedding in the Deep Learning Network was used

To compute batsmen similarities a similar Deep Learning network for bowler vs batsmen is used

I had earlier created another post Player Performance Estimation using AI Collaborative Filtering for batsman and bowler recommendation, using R package Recommender Lab. However, I was not too happy with the results I got with this R package. When I searched the net for material on using embeddings for collaborative filtering, most of material on the web on movie lens or word2vec are repetitive and have no new material. Finally, this short video lecture from Developer Google on Embeddings provided the most clarity.

I have created 4 Colab notebooks to identify player similarities (recommendations)

a) Batsman similarities IPL

b) Batsman similarities T20

c) Bowler similarities IPL

d) Bowler similarities T20

For creating the model I have used all the data for T20 and IPL from so that I get the best results. The data is from Cricsheet. I have also used Google’s Embeddings Projector to display batsman and bowler embedding to and to group similar players

All the Colab notebooks and the data associated with the code are available in Github. Feel free to download and execute them. See if you get better performance. I tried a wide variety of hyperparameters – learning rate, width and depth of nodes per layer, number of layers, gradient methods etc.

You can download all the code & data from Github at embeddings

A) Batsman Recommender IPL (BatsmanRecommenderIPLA.ipynb)

Steps for creating the model

a) Upload bowler vs batsmen with times wicket was taken for batsman. This will be a sparse matrix

b) Assign integer indices for bowlers, batsmen

c) Add additional input features balls, runs conceded and Economy rate

d) Minimise loss for wickets taken for the bowler using SGD

e) Display embeddings of similar batsmen using Tensorboard projector

a) Upload data

Upload data file
2. Remove rows where wickets = 0

from google.colab import files
import io
uploaded = files.upload()
df2 = pd.read_csv(io.BytesIO(uploaded['bowlerVsBatsmanIPLE.csv']))
print(df2.shape)
df2 = df2.loc[df2['wicketTaken']!= 0]
print(df2.shape)

uploaded = files.upload()
df6 = pd.read_csv(io.BytesIO(uploaded['bowlerVsBatsmanIPLAll.csv']))
df6


Out[14]:

bowler1batsman1ballsrunsConcededER
0A Ashish ReddyDJG Sammy100.000000
1A Ashish ReddyG Gambhir101710.200000
2A Ashish ReddyJEC Franklin200.000000
3A Ashish ReddyLRPL Taylor567.200000
4A Ashish ReddyMA Agarwal3714.000000
8550Z KhanVishnu Vinod4812.000000
8551Z KhanVS Malik3510.000000
8552Z KhanW Jaffer732.571429
8553Z KhanYK Pathan22359.545455
8554Z KhanYuvraj Singh12126.000000

b) Create integer dictionaries for batsmen & bowlers

bowlers = df3["bowler1"].unique().tolist()
bowlers
# Create dictionary of bowler to index
bowlers2index = {x: i for i, x in enumerate(bowlers)}
bowlers2index
#Create dictionary of index tp bowler
index2bowlers = {i: x for i, x in enumerate(bowlers)}
index2bowlers


batsmen = df3["batsman1"].unique().tolist()
batsmen
# Create dictionary of batsman to index
batsmen2index = {x: i for i, x in enumerate(batsmen)}
batsmen2index
# Create dictionary of index to batsman
index2batsmen = {i: x for i, x in enumerate(batsmen)}
index2batsmen

#Map bowler, batsman to respective indices
df3["bowler"] = df3["bowler1"].map(bowlers2index)
df3["batsman"] = df3["batsman1"].map(batsmen2index)
df3
num_bowlers =len(bowlers2index)
num_batsmen = len(batsmen2index)
df3["wicketTaken"] = df3["wicketTaken"].values.astype(np.float32)
df3
# min and max ratings will be used to normalize the ratings later
min_wicketTaken = min(df3["wicketTaken"])
max_wicketTaken = max(df3["wicketTaken"])

print(
    "Number of bowlers: {}, Number of batsmen: {}, Min wicketsTaken: {}, Max wicketsTaken: {}".format(
        num_bowlers, num_batsmen, min_wicketTaken, max_wicketTaken
    )
)

c) Concatenate additional features

df3
df6
df31=pd.concat([df3,df6],axis=1)
df31

d) Create a Tensorflow/Keras deep learning mode. Minimise using Mean Squared Error using Stochastic Gradient Descent. I used ‘dropouts’ to regularise the model to keep validation loss within limits

tf.random.set_seed(4)
vector_size=len(batsmen2index)

df4=df31[['bowler','batsman','wicketTaken','balls','runsConceded','ER']]
df4
train_dataset = df4.sample(frac=0.9,random_state=0)
test_dataset = df4.drop(train_dataset.index)

train_dataset1 = train_dataset[['bowler','batsman','balls','runsConceded','ER']]
test_dataset1 = test_dataset[['bowler','batsman','balls','runsConceded','ER']]
train_stats = train_dataset1.describe()
train_stats = train_stats.transpose()
#print(train_stats)

train_labels = train_dataset.pop('wicketTaken')
test_labels = test_dataset.pop('wicketTaken')

# Create a Deep Learning model with keras
model = tf.keras.Sequential([
    tf.keras.layers.Embedding(vector_size,16,input_length=5),
    tf.keras.layers.Flatten(),
    keras.layers.Dropout(.2),
    keras.layers.Dense(16),
 
    keras.layers.Dense(8,activation=tf.nn.relu),
    
    keras.layers.Dense(4,activation=tf.nn.relu),
    keras.layers.Dense(1)
  ])

# Print the model summary
#model.summary()
# Use the Adam optimizer with a learning rate of 0.01
#optimizer=keras.optimizers.Adam(learning_rate=.0009, beta_1=0.5, beta_2=0.999, epsilon=None, decay=0.0, amsgrad=True)
#optimizer=keras.optimizers.RMSprop(learning_rate=0.01, rho=0.2, momentum=0.2, epsilon=1e-07)
#optimizer=keras.optimizers.SGD(learning_rate=.009,momentum=0.1) - Works without dropout
optimizer=keras.optimizers.SGD(learning_rate=.01,momentum=0.1)

model.compile(loss='mean_squared_error',
                optimizer=optimizer,
                )

 # Setup the training parameters
#model.compile(loss='binary_crossentropy',optimizer='rmsprop',metrics=['accuracy'])
# Create a model
history=model.fit(
  train_dataset1, train_labels,batch_size=32,
  epochs=40, validation_data = (test_dataset1,test_labels), verbose=1)

e) Plot losses

f) Predict wickets that will be taken by bowlers against random batsmen


df5= df4[['bowler','batsman','balls','runsConceded','ER']]
test1 = df5.sample(n=10)
test1.shape
for i in range(test1.shape[0]):
      print('Bowler :', index2bowlers.get(test1.iloc[i,0]), ", Batsman : ",index2batsmen.get(test1.iloc[i,1]), '- Times wicket Prediction:',model.predict(test1.iloc[[i]]))
1/1 [==============================] - 0s 90ms/step
Bowler : Harbhajan Singh , Batsman :  AM Nayar - Times wicket Prediction: [[1.0114906]]
1/1 [==============================] - 0s 18ms/step
Bowler : T Natarajan , Batsman :  Arshdeep Singh - Times wicket Prediction: [[0.98656166]]
1/1 [==============================] - 0s 19ms/step
Bowler : KK Ahmed , Batsman :  A Mishra - Times wicket Prediction: [[1.0504484]]
1/1 [==============================] - 0s 24ms/step
Bowler : M Muralitharan , Batsman :  F du Plessis - Times wicket Prediction: [[1.0941994]]
1/1 [==============================] - 0s 25ms/step
Bowler : SK Warne , Batsman :  DR Smith - Times wicket Prediction: [[1.0679393]]
1/1 [==============================] - 0s 28ms/step
Bowler : Mohammad Nabi , Batsman :  Ishan Kishan - Times wicket Prediction: [[1.403399]]
1/1 [==============================] - 0s 32ms/step
Bowler : R Bhatia , Batsman :  DJ Thornely - Times wicket Prediction: [[0.89399755]]
1/1 [==============================] - 0s 26ms/step
Bowler : SP Narine , Batsman :  MC Henriques - Times wicket Prediction: [[1.1997008]]
1/1 [==============================] - 0s 19ms/step
Bowler : AS Rajpoot , Batsman :  K Gowtham - Times wicket Prediction: [[0.9911405]]
1/1 [==============================] - 0s 21ms/step
Bowler : K Rabada , Batsman :  P Simran Singh - Times wicket Prediction: [[1.0064855]]

g) The embedding can be visualised using Google’s Embedding Projector, which identifies other batsmen who have similar characteristics. Here Cosine Similarity is used for grouping similar batsmen of IPL

The closest neighbor for AB De Villiers in IPL is SK Raina, then Rohit Sharma as seen in the visualisation below

B. Bowler Recommender T20 (BowlerRecommenderT20M1A.ipynb)

Similar to how batsman was set up,

The steps are

a) Upload data for T20 Batsman vs Bowler with Total runs scored. This will be a sparse matrix

b) Create integer dictionaries for batsman & bowler

c) Add additional features like fours, sixes and strike rate

d) Minimise loss for wicket taken

e) Display embeddings of bowlers using Tensorboard Embeddings Projector

Minimizing the loss for wicket taken using SGD

tf.random.set_seed(4)
vector_size=len(batsman2index)

#Normalize target variable
df4=df31[['bowler','batsman','totalRuns','fours','sixes','ballsFaced']]
df4['normalizedRuns'] = (df4['totalRuns'] -df4['totalRuns'].mean())/df4['totalRuns'].std()
print(df4)
train_dataset = df4.sample(frac=0.8,random_state=0)
test_dataset = df4.drop(train_dataset.index)
train_dataset1 = train_dataset[['batsman','bowler','fours','sixes','ballsFaced']]
test_dataset1 = test_dataset[['batsman','bowler','fours','sixes','ballsFaced']]

train_labels = train_dataset.pop('normalizedRuns')
test_labels = test_dataset.pop('normalizedRuns')
train_labels
print(train_dataset1)

# Create a Deep Learning model with keras
model = tf.keras.Sequential([
    tf.keras.layers.Embedding(vector_size,16,input_length=5),
    tf.keras.layers.Flatten(),
    keras.layers.Dropout(.2),
    keras.layers.Dense(16),
 
    keras.layers.Dense(8,activation=tf.nn.relu),
    
    keras.layers.Dense(4,activation=tf.nn.relu),
    keras.layers.Dense(1)
  ])

# Print the model summary
#model.summary()
# Use the Adam optimizer with a learning rate of 0.01
#optimizer=keras.optimizers.Adam(learning_rate=.0009, beta_1=0.5, beta_2=0.999, epsilon=None, decay=0.0, amsgrad=True)
#optimizer=keras.optimizers.RMSprop(learning_rate=0.001, rho=0.2, momentum=0.2, epsilon=1e-07)
#optimizer=keras.optimizers.SGD(learning_rate=.009,momentum=0.1) - Works without dropout
optimizer=keras.optimizers.SGD(learning_rate=.01,momentum=0.1)

model.compile(loss='mean_squared_error',
                optimizer=optimizer,
                )

 # Setup the training parameters
#model.compile(loss='binary_crossentropy',optimizer='rmsprop',metrics=['accuracy'])
# Create a model
history=model.fit(
  train_dataset1, train_labels,batch_size=32,
  epochs=40, validation_data = (test_dataset1,test_labels), verbose=1)
model.predict(train_dataset1[1:10])
df5= df4[['batsman','bowler','fours','sixes','ballsFaced']]
test1 = df5.sample(n=10)
model.predict(test1)
#(model.predict(test1)* df4['totalRuns'].std()) + df4['totalRuns'].mean()
for i in range(test1.shape[0]):
        print('Batsman :', index2batsman.get(test1.iloc[i,0]), ", Bowler : ",index2bowler.get(test1.iloc[i,1]), '- Total runs Prediction:',(model.predict(test1.iloc[i])* df4['totalRuns'].std()) + df4['totalRuns'].mean())
1/1 [==============================] - 0s 396ms/step
1/1 [==============================] - 0s 112ms/step
1/1 [==============================] - 0s 183ms/step
Batsman : G Chohan , Bowler :  Khawar Ali - Total runs Prediction: [[1.8883028]]
1/1 [==============================] - 0s 56ms/step
Batsman : Umar Akmal , Bowler :  LJ Wright - Total runs Prediction: [[9.305391]]
1/1 [==============================] - 0s 68ms/step
Batsman : M Shumba , Bowler :  Simi Singh - Total runs Prediction: [[19.662743]]
1/1 [==============================] - 0s 30ms/step
Batsman : CH Gayle , Bowler :  RJW Topley - Total runs Prediction: [[16.854687]]
1/1 [==============================] - 0s 39ms/step
Batsman : BA King , Bowler :  Taskin Ahmed - Total runs Prediction: [[3.5154686]]
1/1 [==============================] - 0s 102ms/step
Batsman : KD Shah , Bowler :  Avesh Khan - Total runs Prediction: [[8.411661]]
1/1 [==============================] - 0s 38ms/step
Batsman : ST Jayasuriya , Bowler :  SCJ Broad - Total runs Prediction: [[5.867449]]
1/1 [==============================] - 0s 45ms/step
Batsman : AB de Villiers , Bowler :  Saeed Ajmal - Total runs Prediction: [[15.150892]]
1/1 [==============================] - 0s 46ms/step
Batsman : SV Samson , Bowler :  J Little - Total runs Prediction: [[10.44426]]
1/1 [==============================] - 0s 102ms/step
Batsman : Zawar Farid , Bowler :  GJ Delany - Total runs Prediction: [[1.9770675]]

Identifying similar bowlers using Embeddings Projector for T20

Bhuvaneshwar Kumar’s performance is closest to CR Woakes

Note: Incidentally the accuracy in the above model was not too good. I may work on this again later!

C) Bowler Embeddings IPL – Grouping similar bowlers of IPL with Embeddings Projector (BowlerRecommenderIPLA.ipynb)

D) Batting Embeddings T20 – Grouping similar batsmen of T20 (BatsmanRecommenderT20MA.ipynb)

The Tensorboard Pmbeddings projector is also interesting. There are multiple ways the data can be visualised namely UMAP, T-SNE, PCA(included). You could play with it.

As mentioned above the Colab notebooks and data are available at Github embeddings

The ability to identify batsmen & bowlers who would perform similarly against specific bowling attacks coupled with the average runs & strike rate should give a good measure of a player’s performance.

Take a look at some of my other posts

  1. Using Reinforcement Learning to solve Gridworld
  2. Deep Learning from first principles in Python, R and Octave – Part 4
  3. Big Data 7: yorkr waltzes with Apache NiFi
  4. Programming languages in layman’s language
  5. Pitching yorkpy…swinging away from the leg stump to IPL – Part 3
  6. Re-introducing cricketr! : An R package to analyze performances of cricketers
  7. The making of Total Control Android game
  8. Presentation on “Intelligent Networks, CAMEL protocol, services & applications”
  9. Exploring Quantum Gate operations with QCSimulator

To see all posts click Index of posts
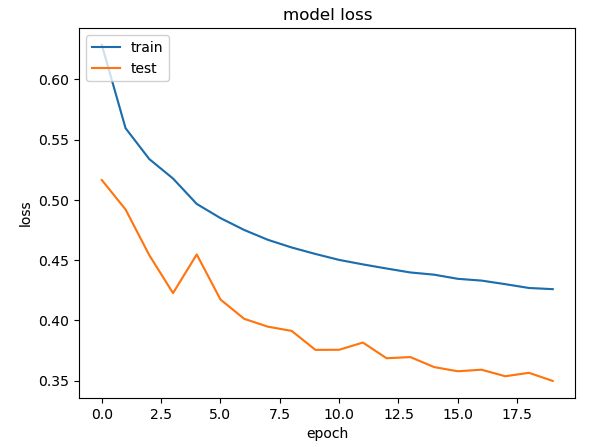
Deconstructing Convolutional Neural Networks with Tensorflow and Keras

I have been very fascinated by how Convolution Neural  Networks have been able to, so efficiently,  do image classification and image recognition CNN’s have been very successful in in both these tasks. A good paper that explores the workings of a CNN Visualizing and Understanding Convolutional Networks  by Matthew D Zeiler and Rob Fergus. They show how through a reverse process of convolution using a deconvnet.

In their paper they show how by passing the feature map through a deconvnet ,which does the reverse process of the convnet, they can reconstruct what input pattern originally caused a given activation in the feature map

In the paper they say “A deconvnet can be thought of as a convnet model that uses the same components (filtering, pooling) but in reverse, so instead of mapping pixels to features, it does the opposite. An input image is presented to the CNN and features  activation computed throughout the layers. To examine a given convnet activation, we set all other activations in the layer to zero and pass the feature maps as input to the attached deconvnet layer. Then we successively (i) unpool, (ii) rectify and (iii) filter to reconstruct the activity in the layer beneath that gave rise to the chosen activation. This is then repeated until input pixel space is reached.”

I started to scout the internet to see how I can implement this reverse process of Convolution to understand what really happens under the hood of a CNN.  There are a lot of good articles and blogs, but I found this post Applied Deep Learning – Part 4: Convolutional Neural Networks take the visualization of the CNN one step further.

This post takes VGG16 as the pre-trained network and then uses this network to display the intermediate visualizations.  While this post was very informative and also the visualizations of the various images were very clear, I wanted to simplify the problem for my own understanding.

Hence I decided to take the MNIST digit classification as my base problem. I created a simple 3 layer CNN which gives close to 99.1% accuracy and decided to see if I could do the visualization.

As mentioned in the above post, there are 3 major visualisations

  1. Feature activations at the layer
  2. Visualisation of the filters
  3. Visualisation of the class outputs

Feature Activation – This visualization the feature activation at the 3 different layers for a given input image. It can be seen that first layer  activates based on the edge of the image. Deeper layers activate in a more abstract way.

Visualization of the filters: This visualization shows what patterns the filters respond maximally to. This is implemented in Keras here

To do this the following is repeated in a loop

  • Choose a loss function that maximizes the value of a convnet filter activation
  • Do gradient ascent (maximization) in input space that increases the filter activation

Visualizing Class Outputs of the MNIST Convnet: This process is similar to determining the filter activation. Here the convnet is made to generate an image that represents the category maximally.

You can access the Google colab notebook here – Deconstructing Convolutional Neural Networks in Tensoflow and Keras

import numpy as np
import pandas as pd
import os
import tensorflow as tf
import matplotlib.pyplot as plt
from keras.layers import Dense, Dropout, Flatten
from keras.layers import Conv2D, MaxPooling2D, Input
from keras.models import Model
from sklearn.model_selection import train_test_split
from keras.utils import np_utils
Using TensorFlow backend.
In [0]:
mnist=tf.keras.datasets.mnist
# Set training and test data and labels
(training_images,training_labels),(test_images,test_labels)=mnist.load_data()
In [0]:
#Normalize training data
X =np.array(training_images).reshape(training_images.shape[0],28,28,1) 
# Normalize the images by dividing by 255.0
X = X/255.0
X.shape
# Use one hot encoding for the labels
Y = np_utils.to_categorical(training_labels, 10)
Y.shape
# Split training data into training and validation data in the ratio of 80:20
X_train, X_validation, y_train, y_validation = train_test_split(X,Y,test_size=0.20, random_state=42)
In [4]:
# Normalize test data
X_test =np.array(test_images).reshape(test_images.shape[0],28,28,1) 
X_test=X_test/255.0
#Use OHE for the test labels
Y_test = np_utils.to_categorical(test_labels, 10)
X_test.shape
Out[4]:
(10000, 28, 28, 1)

Display data

Display the training data and the corresponding labels

In [5]:
print(training_labels[0:10])
f, axes = plt.subplots(1, 10, sharey=True,figsize=(10,10))
for i,ax in enumerate(axes.flat):
    ax.axis('off')
    ax.imshow(X[i,:,:,0],cmap="gray")

Create a Convolutional Neural Network

The CNN consists of 3 layers

  • Conv2D of size 28 x 28 with 24 filters
  • Perform Max pooling
  • Conv2D of size 14 x 14 with 48 filters
  • Perform max pooling
  • Conv2d of size 7 x 7 with 64 filters
  • Flatten
  • Use Dense layer with 128 units
  • Perform 25% dropout
  • Perform categorical cross entropy with softmax activation function
In [0]:
num_classes=10
inputs = Input(shape=(28,28,1))
x = Conv2D(24,kernel_size=(3,3),padding='same',activation="relu")(inputs)
x = MaxPooling2D(pool_size=(2, 2))(x)
x = Conv2D(48, (3, 3), padding='same',activation='relu')(x)
x = MaxPooling2D(pool_size=(2, 2))(x)
x = Conv2D(64, (3, 3), padding='same',activation='relu')(x)
x = MaxPooling2D(pool_size=(2, 2))(x)
x = Flatten()(x)
x = Dense(128, activation='relu')(x)
x = Dropout(0.25)(x)
output = Dense(num_classes,activation="softmax")(x)

model = Model(inputs,output)

model.compile(loss='categorical_crossentropy', 
          optimizer='adam', 
          metrics=['accuracy'])

Summary of CNN

Display the summary of CNN

In [7]:
model.summary()
Model: "model_1"
_________________________________________________________________
Layer (type)                 Output Shape              Param #   
=================================================================
input_1 (InputLayer)         (None, 28, 28, 1)         0         
_________________________________________________________________
conv2d_1 (Conv2D)            (None, 28, 28, 24)        240       
_________________________________________________________________
max_pooling2d_1 (MaxPooling2 (None, 14, 14, 24)        0         
_________________________________________________________________
conv2d_2 (Conv2D)            (None, 14, 14, 48)        10416     
_________________________________________________________________
max_pooling2d_2 (MaxPooling2 (None, 7, 7, 48)          0         
_________________________________________________________________
conv2d_3 (Conv2D)            (None, 7, 7, 64)          27712     
_________________________________________________________________
max_pooling2d_3 (MaxPooling2 (None, 3, 3, 64)          0         
_________________________________________________________________
flatten_1 (Flatten)          (None, 576)               0         
_________________________________________________________________
dense_1 (Dense)              (None, 128)               73856     
_________________________________________________________________
dropout_1 (Dropout)          (None, 128)               0         
_________________________________________________________________
dense_2 (Dense)              (None, 10)                1290      
=================================================================
Total params: 113,514
Trainable params: 113,514
Non-trainable params: 0
_________________________________________________________________

Perform Gradient descent and validate with the validation data

In [8]:
epochs = 20
batch_size=256
history = model.fit(X_train,y_train,
         epochs=epochs,
         batch_size=batch_size,
         validation_data=(X_validation,y_validation))
————————————————
acc = history.history[ ‘accuracy’ ]
val_acc = history.history[ ‘val_accuracy’ ]
loss = history.history[ ‘loss’ ]
val_loss = history.history[‘val_loss’ ]
epochs = range(len(acc)) # Get number of epochs
#————————————————
# Plot training and validation accuracy per epoch
#————————————————
plt.plot ( epochs, acc,label=”training accuracy” )
plt.plot ( epochs, val_acc, label=’validation acuracy’ )
plt.title (‘Training and validation accuracy’)
plt.legend()
plt.figure()
#————————————————
# Plot training and validation loss per epoch
#————————————————
plt.plot ( epochs, loss , label=”training loss”)
plt.plot ( epochs, val_loss,label=”validation loss” )
plt.title (‘Training and validation loss’ )
plt.legend()
Test model on test data
f, axes = plt.subplots(1, 10, sharey=True,figsize=(10,10))
for i,ax in enumerate(axes.flat):
ax.axis(‘off’)
ax.imshow(X_test[i,:,:,0],cmap=”gray”)
l=[]
for i in range(10):
  x=X_test[i].reshape(1,28,28,1)
  y=model.predict(x)
  m = np.argmax(y, axis=1)
  print(m)
[7]
[2]
[1]
[0]
[4]
[1]
[4]
[9]
[5]
[9]

Generate the filter activations at the intermediate CNN layers

In [12]:
img = test_images[51].reshape(1,28,28,1)
fig = plt.figure(figsize=(5,5))
print(img.shape)
plt.imshow(img[0,:,:,0],cmap="gray")
plt.axis('off')

Display the activations at the intermediate layers

This displays the intermediate activations as the image passes through the filters and generates these feature maps

In [13]:
layer_names = ['conv2d_4', 'conv2d_5', 'conv2d_6']

layer_outputs = [layer.output for layer in model.layers if 'conv2d' in layer.name]
activation_model = Model(inputs=model.input,outputs=layer_outputs)
intermediate_activations = activation_model.predict(img)
images_per_row = 8
max_images = 8

for layer_name, layer_activation in zip(layer_names, intermediate_activations):
    print(layer_name,layer_activation.shape)
    n_features = layer_activation.shape[-1]
    print("features=",n_features)
    n_features = min(n_features, max_images)
    print(n_features)

    size = layer_activation.shape[1]
    print("size=",size)
    n_cols = n_features // images_per_row
    display_grid = np.zeros((size * n_cols, images_per_row * size))


    for col in range(n_cols):
      for row in range(images_per_row):
          channel_image = layer_activation[0,:, :, col * images_per_row + row]

          channel_image -= channel_image.mean()
          channel_image /= channel_image.std()
          channel_image *= 64
          channel_image += 128
          channel_image = np.clip(channel_image, 0, 255).astype('uint8')
          display_grid[col * size : (col + 1) * size,
                         row * size : (row + 1) * size] = channel_image
    scale = 2. / size
    plt.figure(figsize=(scale * display_grid.shape[1],
                        scale * display_grid.shape[0]))
    plt.axis('off')
    plt.title(layer_name)
    plt.grid(False)
    plt.imshow(display_grid, aspect='auto', cmap='viridis')
    
plt.show()

It can be seen that at the higher layers only abstract features of the input image are captured
# To fix the ImportError: cannot import name 'imresize' in the next cell. Run this cell. Then comment and restart and run all
#!pip install scipy==1.1.0

Visualize the pattern that the filters respond to maximally

  • Choose a loss function that maximizes the value of the CNN filter in a given layer
  • Start from a blank input image.
  • Do gradient ascent in input space. Modify input values so that the filter activates more
  • Repeat this in a loop.
In [14]:
from vis.visualization import visualize_activation, get_num_filters
from vis.utils import utils
from vis.input_modifiers import Jitter

max_filters = 24
selected_indices = []
vis_images = [[], [], [], [], []]
i = 0
selected_filters = [[0, 3, 11, 15, 16, 17, 18, 22], 
    [8, 21, 23, 25, 31, 32, 35, 41], 
    [2, 7, 11, 14, 19, 26, 35, 48]]

# Set the layers
layer_name = ['conv2d_4', 'conv2d_5', 'conv2d_6']
# Set the layer indices
layer_idx = [1,3,5]
for layer_name,layer_idx in zip(layer_name,layer_idx):


    # Visualize all filters in this layer.
    if selected_filters:
        filters = selected_filters[i]
    else:
        # Randomly select filters
        filters = sorted(np.random.permutation(get_num_filters(model.layers[layer_idx]))[:max_filters])
    selected_indices.append(filters)

    # Generate input image for each filter.
    # Loop through the selected filters in each layer and generate the activation of these filters
    for idx in filters:
        img = visualize_activation(model, layer_idx, filter_indices=idx, tv_weight=0., 
                                   input_modifiers=[Jitter(0.05)], max_iter=300) 
        vis_images[i].append(img)

    # Generate stitched image palette with 4 cols so we get 2 rows.
    stitched = utils.stitch_images(vis_images[i], cols=4)    
    plt.figure(figsize=(20, 30))
    plt.title(layer_name)
    plt.axis('off')
    stitched = stitched.reshape(1,61,127,1)
    plt.imshow(stitched[0,:,:,0])
    plt.show()
    i += 1
from vis.utils import utils
new_vis_images = [[], [], [], [], []]
i = 0
layer_name = ['conv2d_4', 'conv2d_5', 'conv2d_6']
layer_idx = [1,3,5]
for layer_name,layer_idx in zip(layer_name,layer_idx):
   
    # Generate input image for each filter.
    for j, idx in enumerate(selected_indices[i]):
        img = visualize_activation(model, layer_idx, filter_indices=idx, 
                                   seed_input=vis_images[i][j], input_modifiers=[Jitter(0.05)], max_iter=300) 
        #img = utils.draw_text(img, 'Filter {}'.format(idx))  
        new_vis_images[i].append(img)

    stitched = utils.stitch_images(new_vis_images[i], cols=4)   
    plt.figure(figsize=(20, 30))
    plt.title(layer_name)
    plt.axis('off')
    print(stitched.shape)
    stitched = stitched.reshape(1,61,127,1)
    plt.imshow(stitched[0,:,:,0])
    plt.show()
    i += 1

Visualizing Class Outputs

Here the CNN will generate the image that maximally represents the category. Each of the output represents one of the digits as can be seen below

In [16]:
from vis.utils import utils
from keras import activations
codes = '''
zero 0
one 1
two 2
three 3
four 4
five 5
six 6
seven 7
eight 8
nine 9
'''
layer_idx=10
initial = []
images = []
tuples = []
# Swap softmax with linear for better visualization
model.layers[layer_idx].activation = activations.linear
model = utils.apply_modifications(model)
for line in codes.split('\n'):
    if not line:
        continue
    name, idx = line.rsplit(' ', 1)
    idx = int(idx)
    img = visualize_activation(model, layer_idx, filter_indices=idx, 
                               tv_weight=0., max_iter=300, input_modifiers=[Jitter(0.05)])

    initial.append(img)
    tuples.append((name, idx))

i = 0
for name, idx in tuples:
    img = visualize_activation(model, layer_idx, filter_indices=idx,
                               seed_input = initial[i], max_iter=300, input_modifiers=[Jitter(0.05)])
    #img = utils.draw_text(img, name) # Unable to display text on gray scale image
    i += 1
    images.append(img)

stitched = utils.stitch_images(images, cols=4)
plt.figure(figsize=(20, 20))
plt.axis('off')
stitched = stitched.reshape(1,94,127,1)
plt.imshow(stitched[0,:,:,0])

plt.show()

In the grid below the class outputs show the MNIST digits to which output responds to maximally. We can see the ghostly outline
of digits 0 – 9. We can clearly see the outline if 0,1, 2,3,4,5 (yes, it is there!),6,7, 8 and 9. If you look at this from a little distance the digits are clearly visible. Isn’t that really cool!!


Conclusion:


It is really interesting to see the class outputs which show the image to which the class output responds to maximally. In the
post Applied Deep Learning – Part 4: Convolutional Neural Networks the class output show much more complicated images and is worth a look. It is really interesting to note that the model has adjusted the filter values and the weights of the fully connected network to maximally respond to the MNIST digits

References

1. Visualizing and Understanding Convolutional Networks
2. Applied Deep Learning – Part 4: Convolutional Neural Networks
3. Visualizing Intermediate Activations of a CNN trained on the MNIST Dataset
4. How convolutional neural networks see the world
5. Keras – Activation_maximization

Also see

1. Using Reinforcement Learning to solve Gridworld
2. Deep Learning from first principles in Python, R and Octave – Part 8
3. Cricketr learns new tricks : Performs fine-grained analysis of players
4. Video presentation on Machine Learning, Data Science, NLP and Big Data – Part 1
5. Big Data-2: Move into the big league:Graduate from R to SparkR
6. OpenCV: Fun with filters and convolution
7. Powershell GUI – Adding bells and whistles

To see all posts click Index of posts
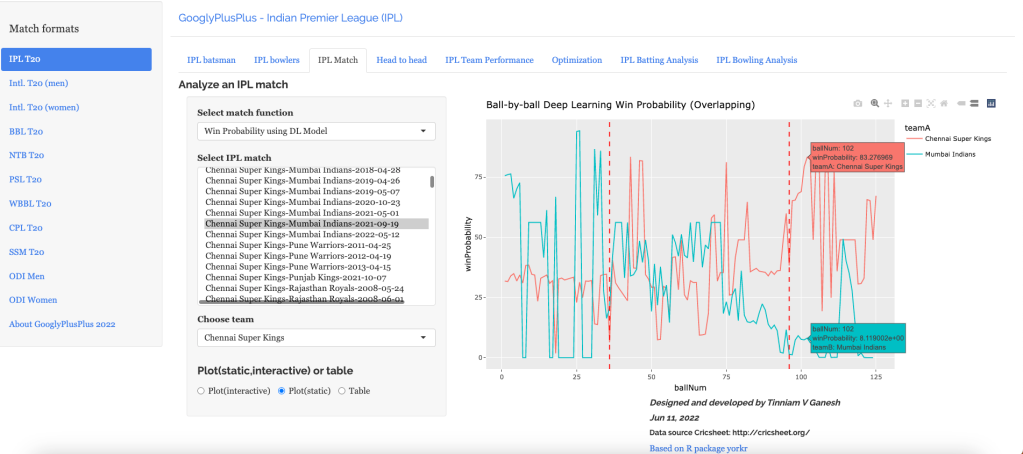
Understanding Neural Style Transfer with Tensorflow and Keras

Neural Style Transfer (NST)  is a fascinating area of Deep Learning and Convolutional Neural Networks. NST is an interesting technique, in which the style from an image, known as the ‘style image’ is transferred to another image ‘content image’ and we get a third a image which is a generated image which has the content of the original image and the style of another image.

NST can be used to reimagine how famous painters like Van Gogh, Claude Monet or a Picasso would have visualised a scenery or architecture. NST uses Convolutional Neural Networks (CNNs) to achieve this artistic style transfer from one image to another. NST was originally implemented by Gati et al., in their paper Neural Algorithm of Artistic Style. Convolutional Neural Networks have been very successful in image classification image recognition et cetera. CNN networks have also been have also generated very interesting pictures using Neural Style Transfer which will be shown in this post. An interesting aspect of CNN’s is that the first couple of layers in the CNN capture basic features of the image like edges and  pixel values. But as we go deeper into the CNN, the network captures higher level features of the input image.

To get started with Neural Style transfer  we will be using the VGG19 pre-trained network. The VGG19 CNN is a compact pre-trained your network which can be used for performing the NST. However, we could have also used Resnet or InceptionV3 networks for this purpose but these are very large networks. The idea of using a network trained on a different task and applying it to a new task is called transfer learning.

What needs to be done to transfer the style from one of the image to another image. This brings us to the question – What is ‘style’? What is it that distinguishes Van Gogh’s painting or Picasso’s cubist art. Convolutional Neural Networks capture basic features in the lower layers and much more complex features in the deeper layers.  Style can be computed by taking the correlation of the feature maps in a layer L. This is my interpretation of how style is captured.  Since style  is intrinsic to  the image, it  implies that the style feature would exist across all the filters in a layer. Hence, to pick up this style we would need to get the correlation of the filters across channels of a lawyer. This is computed mathematically, using the Gram matrix which calculates the correlation of the activation of a the filter by the style image and generated image

To transfer the style from one image to the content image we need to do two parallel operations while doing forward propagation
– Compute the content loss between the source image and the generated image
– Compute the style loss between the style image and the generated image
– Finally we need to compute the total loss

In order to get transfer the style from the ‘style’ image to the ‘content ‘image resulting in a  ‘generated’  image  the total loss has to be minimised. Therefore backward propagation with gradient descent  is done to minimise the total loss comprising of the content and style loss.

Initially we make the Generated Image ‘G’ the same as the source image ‘S’

The content loss at layer ‘l’

L_{content} = 1/2 \sum_{i}^{j} ( F^{l}_{i,j} - P^{l}_{i,j})^{2}

where F^{l}_{i,j} and P^{l}_{i,j} represent the activations at layer ‘l’ in a filter i, at position ‘j’. The intuition is that the activations will be same for similar source and generated image. We need to minimise the content loss so that the generated stylized image is as close to the original image as possible. An intermediate layer of VGG19 block5_conv2 is used

The Style layers that are are used are

style_layers = [‘block1_conv1’,
‘block2_conv1’,
‘block3_conv1’,
‘block4_conv1’,
‘block5_conv1’]
To compute the Style Loss the Gram matrix needs to be computed. The Gram Matrix is computed by unrolling the filters as shown below (source: Convolutional Neural Networks by Prof Andrew Ng, Coursera). The result is a matrix of size n_{c} x n_{c} where n_{c} is the number of channels
The above diagram shows the filters of height n_{H} and width n_{W} with n_{C} channels
The contribution of layer ‘l’ to style loss is given by
L^{'}_{style} = \frac{\sum_{i}^{j} (G^{2}_{i,j} - A^l{i,j})^2}{4N^{2}_{l}M^{2}_{l}}
where G_{i,j}  and A_{i,j} are the Gram matrices of the style and generated images respectively. By minimising the distance in the gram matrices of the style and generated image we can ensure that generated image is a stylized version of the original image similar to the style image
The total loss is given by
L_{total} = \alpha L_{content} + \beta L_{style}
Back propagation with gradient descent works to minimise the content loss between the source and generated image, while the style loss tries to minimise the discrepancies in the style of the style image and generated image. Running through forward and backpropagation through several epochs successfully transfers the style from the style image to the source image.
You can check the Notebook at Neural Style Transfer

Note: The code in this notebook is largely based on the Neural Style Transfer tutorial from Tensorflow, though I may have taken some changes from other blogs. I also made a few changes to the code in this tutorial, like removing the scaling factor, or the class definition (Personally, I belong to the old school (C language) and am not much in love with the ‘self.”..All references are included below

Note: Here is a interesting thought. Could we do a Neural Style Transfer in music? Imagine Carlos Santana playing ‘Hotel California’ or Brian May style in ‘Another brick in the wall’. While our first reaction would be that it may not sound good as we are used to style of these songs, we may be surprised by a possible style transfer. This is definitely music to the ears!


Here are few runs from this

A) Run 1

1. Neural Style Transfer – a) Content Image – My portrait.  b) Style Image – Wassily Kadinsky Oil on canvas, 1913, Vassily Kadinsky’s composition


2. Result of Neural Style Transfer


2) Run 2

a) Content Image – Portrait of my parents b) Style Image –  Vincent Van Gogh’s ,Starry Night Oil on canvas 1889


2. Result of Neural Style Transfer


Run 3

1.  Content Image – Caesar 2 (Masai Mara- 20 Jun 2018).  Style Image – The Great Wave at Kanagawa – Katsushika Hokosai, 1826-1833


Screenshot 2020-04-12 at 12.40.44 PM

2. Result of Neural Style Transfer

lkg


Run 4

1.   Content Image – Junagarh Fort , Rajasthan   Sep 2016              b) Style Image – Le Pont Japonais by Claude Monet, Oil on canvas, 1920


2. Result of Neural Style Transfer


Neural Style Transfer is a very ingenious idea which shows that we can segregate the style of a painting and transfer to another image.

References

1. A Neural Algorithm of Artistic Style, Leon A. Gatys, Alexander S. Ecker, Matthias Bethge
2. Neural style transfer
3. Neural Style Transfer: Creating Art with Deep Learning using tf.keras and eager execution
4. Convolutional Neural Network, DeepLearning.AI Specialization, Prof Andrew Ng
5. Intuitive Guide to Neural Style Transfer

See also

1. Big Data-5: kNiFi-ing through cricket data with yorkpy
2. Cricketr adds team analytics to its repertoire
3. Cricpy performs granular analysis of players
4. My book ‘Deep Learning from first principles:Second Edition’ now on Amazon
5. Programming Zen and now – Some essential tips-2
6. The Anomaly
7. Practical Machine Learning with R and Python – Part 5
8. Literacy in India – A deepR dive
9. “Is it an animal? Is it an insect?” in Android

To see all posts click Index of posts

Big Data-5: kNiFi-ing through cricket data with yorkpy

“The temptation to form premature theories upon insufficient data is the bane of our profession.”

                              Sherlock Holmes in the Valley of fear by Arthur Conan Doyle

“If we have data, let’s look at data. If all we have are opinions, let’s go with mine.”

                              Jim Barksdale, former CEO Netscape 

In this post I use  Apache NiFi Dataflow Pipeline along with my Python package yorkpy to crunch through cricket data from Cricsheet. The Data Pipelne  flows all the way from the source  to target analytics output. Apache NiFi was created to automate the flow of data between systems.  NiFi dataflows enable the automated and managed flow of information between systems. This post automates the flow of data from Cricsheet, from where the zip file it is downloaded, unpacked, processed, transformed and finally T20 players are ranked.

While this is a straight forward example of what can be done, this pattern can be applied to real Big Data systems. For example hypothetically, we could consider that we get several parallel streams of  cricket data or for that matter any sports related data. There could be parallel Data flow pipelines that get the data from the sources. This would then be  followed by data transformation modules and finally a module for generating analytics. At the other end a UI based on AngularJS or ReactJS could display the results in a cool and awesome way.

Incidentally, the NiFi pipeline that I discuss in this post, is a simplistic example, and does not use the Big Data stack like HDFS, Hive, Spark etc. Nevertheless, the pattern used, has all the modules for a Big Data pipeline namely ingestion, unpacking, transformation and finally analytics. This NiF pipeline demonstrates the flow using the regular file system of Mac and my python based package yorkpy. The concepts mentioned could be used in a real Big Data scenario which has much fatter pipes of data coming. If  this was the case the NiFi pipeline would utilize  HDFS/Hive for storing the ingested data and Pyspark/Scala for the transformation and analytics and other related technologies.

A pictorial representation is given below

In the diagram above each of the vertical boxes could be any technology from the ever proliferating Big Data stack namely HDFS, Hive, Spark, Sqoop, Kafka, Impala and so on.  Such a dataflow automation could be created when any big sporting event happens, as long as the data generated large, and there is a need for dynamic and automated reporting. The UI could be based on AngularJS/ReactJS and could display analytical tables and charts.

This post demonstrates one such scenario in which IPL T20 data is downloaded from Cricsheet site, unpacked and stored in a specific directory. This dataflow automation is based on my yorkpy package. To know more about the yorkpy package  see Pitching yorkpy … short of good length to IPL – Part 1  and the associated parts. The zip file, from Cricsheet, contains individual IPL T20 matches in YAML format. The convertYaml2DataframeT20() function is used to convert the YAML files into Pandas dataframes before storing them as CSV files. After this done, the function rankIPLT20batting() function is used to perform the overall ranking of the T20 players. My yorkpy Python package has about ~ 50+ functions that perform various analytics on any T20 data for e.g it has the following classes of functions

  • analyze T20 matches
  • analyze performance of a T20 team in all matches against another T20 team
  • analyze performance of a T20 team against all other T20 teams
  • analyze performance of T20 batsman and bowlers
  • rank T20 batsmen and bowlers

The functions of yorkpy generate tables or charts. While this post demonstrates one scenario, we could use any of the yorkpy T20 functions, generate the output and display on a widget in the UI display, created with cool technologies like AngularJS/ReactJS,  possibly in near real time as data keeps coming in.,

To use yorkpy with NiFI the following packages have to be installed in your environment

-pip install yorkpy
-pip install pyyaml
-pip install pandas
-yum install python-devel (equivalent in Windows)
-pip install matplotlib
-pip install seaborn
-pip install sklearn
-pip install datetime

I have created a video of the NiFi Pipeline with the real dataflow fro source to the ranked IPL T20 batsmen. Take a look at RankingT20PlayersWithNiFiYorkpy

You can clone/fork the NiFi template from rankT20withNiFiYorkpy

The NiFi Data Flow Automation is shown below

1. Overall flow

The overall NiFi flow contains 2 Process Groups a) DownloadAnd Unpack. b) Convert and Rank IPL batsmen. While it appears that the Process Groups are disconnected, they are not. The first process group downloads the T20 zip file, unpacks the. zip file and saves the YAML files in a specific folder. The second process group monitors this folder and starts processing as soon the YAML files are available. It processes the YAML converting it into dataframes before storing it as CSV file. The next  processor then does the actual ranking of the batsmen before writing the output into IPLrank.txt

1.1 DownloadAndUnpack Process Group

This process group is shown below

1.1.1 GetT20Data

The GetT20Data Processor downloads the zip file given the URL

The ${T20data} variable points to the specific T20 format that needs to be downloaded. I have set this to https://cricsheet.org/downloads/ipl.zip. This could be set any other data set. In fact we could have parallel data flows for different T20/ Sports data sets and generate

1.1.2 SaveUnpackedData

This processor stores the YAML files in a predetermined folder, so that the data can be picked up  by the 2nd Process Group for processing

1.2 ProcessAndRankT20Players Process Group

This is the second process group which converts the YAML files to pandas dataframes before storing them as. CSV files. The RankIPLPlayers will then read all the CSV files, stack them and then proceed to rank the IPL players. The Process Group is shown below

1.2.1 ListFile and FetchFile Processors

The left 2 Processors ListFile and FetchFile get all the YAML files from the folder and pass it to the next processor

1.2.2 convertYaml2DataFrame Processor

The convertYaml2DataFrame Processor uses the ExecuteStreamCommand which call a python script. The Python script invoked the yorkpy function convertYaml2Dataframe() as shown below

The ${convertYaml2Dataframe} variable points to the python file below which invoked the yorkpy function yka.convertYaml2PandasDataframeT20()

import yorkpy.analytics as yka
import argparse
parser = argparse.ArgumentParser(description='convert')
parser.add_argument("yamlFile",help="YAML File")
args=parser.parse_args()
yamlFile=args.yamlFile
yka.convertYaml2PandasDataframeT20(yamlFile,"/Users/tvganesh/backup/software/nifi/ipl","/Users/tvganesh/backup/software/nifi/ipldata")

This function takes as input $filename which comes from FetchFile processor which is a FlowFile. So I have added a concurrency of 8  to handle upto 8 Flowfiles at a time. The thumb rule as I read on the internet is 2x, 4x the number of cores of your system. Since I have an 8 core Mac, I could possibly have gone ~ 30 concurrent threads. Also the number of concurrent threads is less when the flow is run in a Oracle Box VirtualMachine. Box since a vCore < actual Core

The scheduling tab is as below

Here are the 8 concurrent Python threads on Mac at bottom right… (pretty cool!)

I have not fully tested how latency vs throughput slider changes, affects the performance.

1.2.3 MergeContent Processor

This processor’s only job is to trigger the rankIPLPlayers when all the FlowFiles have merged into 1 file.

1.2.4 RankT20Players

This processor is an ExecuteStreamCommand Processor that executes a Python script which invokes a yorkpy function rankIPLT20Batting()

import yorkpy.analytics as yka
rank=yka.rankIPLT20Batting("/Users/tvganesh/backup/software/nifi/ipldata")
print(rank.head(15))

1.2.5 OutputRankofT20Player Processor

This processor writes the generated rank to an output file.

1.3 Final Ranking of IPL T20 players

The Nodejs based web server picks up this file and displays on the web page the final ranks (the code is based on a good youtube for reading from file)

2. Final thoughts

As I have mentioned above though the above NiFi Cricket Dataflow automation does not use the Hadoop ecosystem, the pattern used is valid and can be used with some customization in Big Data flows as parallel stream. I could have also done this on Oracle VirtualBox but I thought since the code is based on Python and Pandas there is no real advantage of running on the VirtualBox.  GIve the NiFi flow a shot. Have fun!!!

Also see
1.My book ‘Deep Learning from first Practical Machine Learning with R and Python – Part 5
Edition’ now on Amazon

2. Introducing QCSimulator: A 5-qubit quantum computing simulator in R
3.De-blurring revisited with Wiener filter using OpenCV
4. Practical Machine Learning with R and Python – Part 5
5. Natural language processing: What would Shakespeare say?
6.Getting started with Tensorflow, Keras in Python and R
7.Revisiting World Bank data analysis with WDI and gVisMotionChart

To see all posts click Index of posts

Ranking T20 players in Intl T20, IPL, BBL and Natwest using yorkpy

There is a voice that doesn’t use words, listen.
When someone beats a rug, the blows are not against the rug, but against the dust in it.
I lost my hat while gazing at the moon, and then I lost my mind.
Rumi

Introduction

After a long hiatus, I am back to my big, bad, blogging ways! In this post I rank T20 players from several different leagues namely

  • International T20
  • Indian Premier League (IPL) T20
  • Big Bash League (BBL) T20
  • Natwest Blast (NTB) T20

I have added 8 new functions to my Python Package yorkpy, which will perform the ranking for the above 4 T20 League formats. To know more about my Python package see Pitching yorkpy . short of good length to IPL – Part 1, and the related posts on yorkpy. The code can be easily extended to other leagues which have a the same ‘yaml’ format for the matches. I also fixed some issues which started to crop up, possibly because a few things have changed in the new data.

The new functions are

  1. rankIntlT20Batting()
  2. rankIntlT20Batting()
  3. rankIPLT20Batting()
  4. rankIPLT20Batting
  5. rankBBLT20Batting()
  6. rankBBLT20Batting()
  7. rankNTBT20Batting()
  8. rankNTBT20Batting()

The yorkpy package uses data from Cricsheet

You can clone/fork the code for yorkpy at yorkpy

You can download the PDF of the post from Rank T20

yorkpy can be installed with ‘pip install yorkpy

1. International T20

The steps to do before ranking for International T20 matches are 1. Download International T20 zip file from Cricsheet Intl T20 2. Unzip the file. This will create a folder with yaml files

import yorkpy.analytics as yka
#yka.convertAllYaml2PandasDataframesT20("../t20s","../data")

This above step will convert the yaml files into CSV files. Now do the ranking as below

1a. Ranking of International T20 batsmen

import yorkpy.analytics as yka
intlT20RankBatting=yka.rankIntlT20Batting("C:\\software\\cricket-package\\yorkpyPkg\\data\\data")
intlT20RankBatting.head(15)
##                      matches  runs_mean     SR_mean
## batsman                                            
## V Kohli                   58  38.672414  125.212402
## KS Williamson             42  32.595238  122.884631
## Mohammad Shahzad          52  31.942308  118.212288
## CH Gayle                  50  31.140000  111.869984
## BB McCullum               69  29.492754  117.011666
## MM Lanning                48  28.812500   98.582663
## SJ Taylor                 44  28.659091   98.684856
## MJ Guptill                68  28.573529  117.673702
## DA Warner                 71  28.507042  121.142746
## DPMD Jayawardene          53  27.584906  107.787092
## KC Sangakkara             54  26.407407  106.039838
## JP Duminy                 68  26.294118  114.606717
## TM Dilshan                78  26.243590   97.910384
## RG Sharma                 65  25.907692  113.056548
## H Masakadza               53  25.566038   99.453880

1b. Ranking of International T20 bowlers

import yorkpy.analytics as yka
intlT20RankBowling=yka.rankIntlT20Bowling("C:\\software\\cricket-package\\yorkpyPkg\\data\\data")
intlT20RankBowling.head(15)
##                       matches  wicket_mean  econrate_mean
## bowler                                                   
## Umar Gul                   58     1.603448       7.637931
## SL Malinga                 78     1.500000       7.409188
## Saeed Ajmal                63     1.492063       6.451058
## DW Steyn                   46     1.478261       7.014855
## A Shrubsole                45     1.422222       6.294444
## M Morkel                   41     1.292683       7.680894
## KMDN Kulasekara            57     1.280702       7.476608
## TG Southee                 51     1.274510       8.759804
## SCJ Broad                  53     1.264151            inf
## Shakib Al Hasan            58     1.241379       6.836207
## R Ashwin                   44     1.204545       7.162879
## Nida Dar                   44     1.204545       6.083333
## KH Brunt                   44     1.204545       5.982955
## KD Mills                   42     1.166667       8.289683
## SR Watson                  46     1.152174       8.246377

2. Indian Premier League (IPL) T20

The steps to do before ranking for IPL T20 matches are 1. Download IPL T20 zip file from Cricsheet IPL T20 2. Unzip the file. This will create a folder with yaml files

import yorkpy.analytics as yka
#yka.convertAllYaml2PandasDataframesT20("../ipl","../ipldata")

This above step will convert the yaml files into CSV files in the /ipldata folder. Now do the ranking as below

2a. Ranking of batsmen in IPL T20

import yorkpy.analytics as yka
IPLT20RankBatting=yka.rankIPLT20Batting("C:\\software\\cricket-package\\yorkpyPkg\\data\\ipldata")
IPLT20RankBatting.head(15)
##                    matches  runs_mean     SR_mean
## batsman                                          
## DA Warner              129  37.589147  119.917864
## CH Gayle               123  36.723577  125.256818
## SE Marsh                70  36.314286  114.707578
## KL Rahul                59  33.542373  123.424971
## MEK Hussey              60  33.400000  100.439187
## V Kohli                174  32.413793  115.830849
## KS Williamson           42  31.690476  120.443172
## AB de Villiers         143  30.923077  128.967081
## JC Buttler              45  30.800000  132.561154
## AM Rahane              118  30.330508  102.240398
## SR Tendulkar            79  29.949367  101.651959
## F du Plessis            65  29.415385  112.462114
## Q de Kock               51  29.333333  110.973836
## SS Iyer                 47  29.170213  102.144222
## G Gambhir              155  28.741935  103.997558

2b. Ranking of bowlers in IPL T20

import yorkpy.analytics as yka
IPLT20RankBowling=yka.rankIPLT20Bowling("C:\\software\\cricket-package\\yorkpyPkg\\data\\ipldata")
IPLT20RankBowling.head(15)
##                      matches  wicket_mean  econrate_mean
## bowler                                                  
## SL Malinga               122     1.540984       7.173361
## Imran Tahir               43     1.465116       8.155039
## A Nehra                   88     1.375000       7.923295
## MJ McClenaghan            56     1.339286       8.638393
## Rashid Khan               46     1.304348       6.543478
## Sandeep Sharma            79     1.303797       7.860759
## MM Patel                  63     1.301587       7.530423
## DJ Bravo                 131     1.282443       8.458333
## M Morkel                  70     1.257143       7.760714
## SP Narine                109     1.256881       6.747706
## YS Chahal                 83     1.228916       8.103659
## R Vinay Kumar            104     1.221154       8.556090
## RP Singh                  82     1.219512       8.149390
## CH Morris                 52     1.211538       7.854167
## B Kumar                  117     1.205128       7.536325

3. Natwest T20

The steps to do before ranking for Natwest T20 matches are 1. Download Natwest T20 zip file from Cricsheet NTB T20 2. Unzip the file. This will create a folder with yaml files

import yorkpy.analytics as yka
#yka.convertAllYaml2PandasDataframesT20("../ntb","../ntbdata")

This above step will convert the yaml files into CSV files in the /ntbdata folder. Now do the ranking as below

3a. Ranking of NTB batsmen

import yorkpy.analytics as yka
NTBT20RankBatting=yka.rankNTBT20Batting("C:\\software\\cricket-package\\yorkpyPkg\\data\\ntbdata")
NTBT20RankBatting.head(15)
##                      matches  runs_mean     SR_mean
## batsman                                            
## Babar Azam                13  44.461538  121.268809
## T Banton                  13  42.230769  139.376274
## JJ Roy                    12  41.250000  142.182147
## DJM Short                 12  40.250000  131.182294
## AN Petersen               12  37.916667  132.522727
## IR Bell                   13  37.615385  130.104721
## M Klinger                 26  35.346154  112.682922
## EJG Morgan                16  35.062500  129.817650
## AJ Finch                  19  34.578947  137.093465
## MH Wessels                26  33.884615  116.300969
## S Steel                   11  33.545455  140.118207
## DJ Bell-Drummond          21  33.142857  108.566309
## Ashar Zaidi               11  33.000000  178.553331
## DJ Malan                  26  33.000000  120.127202
## T Kohler-Cadmore          23  32.956522  112.493019

3b. Ranking of NTB bowlers

import yorkpy.analytics as yka
NTBT20RankBowling=yka.rankNTBT20Bowling("C:\\software\\cricket-package\\yorkpyPkg\\data\\ntbdata")
NTBT20RankBowling.head(15)
##                        matches  wicket_mean  econrate_mean
## bowler                                                    
## MW Parkinson                11     2.000000       7.628788
## HF Gurney                   23     1.956522       8.831884
## GR Napier                   12     1.916667       8.694444
## R Rampaul                   19     1.736842       7.131579
## P Coughlin                  11     1.727273       8.909091
## AJ Tye                      26     1.692308       8.227564
## GC Viljoen                  12     1.666667       7.708333
## BAC Howell                  21     1.666667       6.857143
## BW Sanderson                12     1.583333       7.902778
## KJ Abbott                   14     1.571429       9.398810
## JE Taylor                   13     1.538462       9.839744
## JDS Neesham                 12     1.500000      10.812500
## MJ Potts                    12     1.500000       8.486111
## TT Bresnan                  21     1.476190       8.817460
## T van der Gugten            13     1.461538       7.211538

4. Big Bash Leagure (BBL) T20

The steps to do before ranking for BBL T20 matches are 1. Download BBL T20 zip file from Cricsheet BBL T20 2. Unzip the file. This will create a folder with yaml files

import yorkpy.analytics as yka
#yka.convertAllYaml2PandasDataframesT20("../bbl","../bbldata")

This above step will convert the yaml files into CSV files in the /bbldata folder. Now do the ranking as below

4a. Ranking of BBL batsmen

import yorkpy.analytics as yka
BBLT20RankBatting=yka.rankBBLT20Batting("C:\\software\\cricket-package\\yorkpyPkg\\data\\bbldata")
BBLT20RankBatting.head(15)
##                 matches  runs_mean     SR_mean
## batsman                                       
## DJM Short            43  40.883721  118.773047
## SE Marsh             47  39.148936  113.616053
## AJ Finch             62  36.306452  120.271231
## AT Carey             37  34.945946  120.125341
## UT Khawaja           41  31.268293  107.355655
## CA Lynn              74  31.162162  121.746578
## MS Wade              46  30.782609  120.310081
## TM Head              45  30.000000  126.769564
## MEK Hussey           23  29.173913  109.492934
## BJ Hodge             29  29.000000  124.438040
## BR Dunk              39  28.230769  106.149913
## AD Hales             31  27.161290  117.678008
## BB McCullum          34  27.058824  115.486392
## GJ Bailey            57  27.000000  121.159220
## MR Marsh             47  26.510638  114.994909

4b. Ranking of BBL bowlers

import yorkpy.analytics as yka
BBLT20RankBowling=yka.rankBBLT20Bowling("C:\\software\\cricket-package\\yorkpyPkg\\data\\bbldata")
BBLT20RankBowling.head(15)
##                    matches  wicket_mean  econrate_mean
## bowler                                                
## Yasir Arafat            15     2.000000       7.587778
## CH Morris               15     1.733333       8.572222
## TK Curran               27     1.629630       8.716049
## TT Bresnan              13     1.615385       8.775641
## JR Hazlewood            18     1.555556       7.361111
## CJ McKay                15     1.533333       8.555556
## DR Sams                 36     1.527778       8.581019
## AC McDermott            14     1.500000       9.166667
## JP Faulkner             20     1.500000       8.345833
## SP Narine               12     1.500000       7.395833
## AJ Tye                  51     1.490196       8.101307
## M Kelly                 21     1.476190       8.908730
## SA Abbott               73     1.438356       8.737443
## B Laughlin              82     1.426829       8.332317
## SW Tait                 31     1.419355       8.895161

Conclusion

You should be able to now rank players in the above formats as new data is added to Cricsheet. yorkpy can also be used for other leagues which follow the Cricsheet format.

Also see
1. Deep Learning from first principles in Python, R and Octave – Part 5
2. Using Linear Programming (LP) for optimizing bowling change or batting lineup in T20 cricket
3. Using Reinforcement Learning to solve Gridworld
4. Big Data-4: Webserver log analysis with RDDs, Pyspark, SparkR and SparklyR
5. My book ‘Practical Machine Learning in R and Python: Third edition’ on Amazon
6. Deblurring with OpenCV: Weiner filter reloaded
7. Rock N’ Roll with Bluemix, Cloudant & NodeExpress
8. Modeling a Car in Android

To see all posts click Index of posts

Cricpy performs granular analysis of players

“Gold medals aren’t really made of gold. They’re made of sweat, determination, & a hard-to-find alloy called guts.” Dan Gable

“It doesn’t matter whether you are pursuing success in business, sports, the arts, or life in general: The bridge between wishing and accomplishing is discipline” Harvey Mackay

“I won’t predict anything historic. But nothing is impossible.” Michael Phelps

Introduction

In this post, I introduce 2 new functions in my Python package ‘cricpy’ (cricpy v0.20) see Introducing cricpy:A python package to analyze performances of cricketers which enable granular analysis of batsmen and bowlers. They are

  1. Step 1: getPlayerDataHA – This function is a wrapper around getPlayerData(), getPlayerDataOD() and getPlayerDataTT(), and adds an extra column ‘homeOrAway’ which says whether the match was played at home/away/neutral venues. A CSV file is created with this new column.
  2. Step 2: getPlayerDataOppnHA – This function allows you to slice & dice the data for batsmen and bowlers against specific oppositions, at home/away/neutral venues and between certain periods. This reducedsubset of data can be used to perform analyses. A CSV file is created as an output based on the parameters of opposition, home or away and the interval of time

Note All the existing cricpy functions can be used on this smaller fine-grained data set for a closer analysis of players

This post has been published in Rpubs and can be accessed at Cricpy performs granular analysis of players

You can download a PDF version of this post at Cricpy performs granular analysis of players

I have also updated the cricpy template with these lastest changes. See cricpy-template

You can download the latest PDF version of the book  at  ‘Cricket analytics with cricketr and cricpy: Analytics harmony with R and Python-6th edition

1. Analyzing Rahul Dravid at 3 different stages of his career

The following functions analyze Rahul Dravid during 3 different periods of his illustrious career. a) 1st Jan 2001-1st Jan 2002 b) 1st Jan 2004-1st Jan 2005 c) 1st Jan 2009-1st Jan 2010

import cricpy.analytics as ca
# Get the homeOrAway dataset for Dravid in matches
# Note:Since I have already got the data I reuse the CSV file
#df=ca.getPlayerDataHA(28114,tfile="dravidTestHA.csv",matchType="Test")

# Get Dravid's data for 2001-02
df1=ca.getPlayerDataOppnHA(infile="dravidTestHA.csv",outfile="dravidTest2001.csv",startDate="2001-01-01",endDate="2002-01-01")

# Get Dravid's data for 2004-05
df2=ca.getPlayerDataOppnHA(infile="dravidTestHA.csv",outfile="dravidTest2004.csv", startDate="2004-01-01",endDate="2005-01-01")

# Get Dravid's data for 2009-10
df3=ca.getPlayerDataOppnHA(infile="dravidTestHA.csv",outfile="dravidTest2009.csv",startDate="2009-01-01",endDate="2010-01-01")

1a. Plot the performance of Dravid at venues during 2001,2004,2009

Note: Any of the cricpy functions can be used on the fine-grained subset of data as below.

import cricpy.analytics as ca
ca.batsmanAvgRunsGround("dravidTest2001.csv","Dravid-2001")

ca.batsmanAvgRunsGround("dravidTest2004.csv","Dravid-2004")

ca.batsmanAvgRunsGround("dravidTest2009.csv","Dravid-2009")


1b. Plot the performance of Dravid against different oppositions during 2001,2004,2009

import cricpy.analytics as ca
ca.batsmanAvgRunsOpposition("dravidTest2001.csv","Dravid-2001")

ca.batsmanAvgRunsOpposition("dravidTest2004.csv","Dravid-2004")


ca.batsmanAvgRunsOpposition("dravidTest2009.csv","Dravid-2009")


1c. Plot the relative cumulative average and relative strike rate of Dravid in 2001,2004,2009

The plot below compares Dravid’s cumulative strike rate and cumulative average during 3 different stages of his career

import cricpy.analytics as ca
frames=["dravidTest2001.csv","dravidTest2004.csv","dravidTest2009.csv"]
names=["Dravid-2001","Dravid-2004","Dravid-2009"]
ca.relativeBatsmanCumulativeAvgRuns(frames,names)

ca.relativeBatsmanCumulativeStrikeRate(frames,names)

2. Analyzing Virat Kohli’s performance against England in England in 2014 and 2018

The analysis below looks at Kohli’s performance against England in ‘away’ venues (England) in 2014 and 2018

import cricpy.analytics as ca
# Get the homeOrAway data for Kohli in Test matches
#df=ca.getPlayerDataHA(253802,tfile="kohliTestHA.csv",type="batting",matchType="Test")

# Get the homeOrAway data for Kohli in Test matches
df=ca.getPlayerDataHA(253802,tfile="kohliTestHA.csv",type="batting",matchType="Test")

# Get the subset if data of Kohli's performance against England in England in 2014
df=ca.getPlayerDataOppnHA(infile="kohliTestHA.csv",outfile="kohliTestEng2014.csv",  opposition=["England"],homeOrAway=["away"],startDate="2014-01-01",endDate="2015-01-01")

# Get the subset if data of Kohli's performance against England in England in 2018
df1=ca.getPlayerDataOppnHA(infile="kohliTestHA.csv",outfile="kohliTestEng2018.csv",
   opposition=["England"],homeOrAway=["away"],startDate="2018-01-01",endDate="2019-01-01")

2a. Kohli’s performance at England grounds in 2014 & 2018

Kohli had a miserable outing to England in 2014 with a string of low scores. In 2018 Kohli pulls himself out of the morass

import cricpy.analytics as ca
ca.batsmanAvgRunsGround("kohliTestEng2014.csv","Kohli-Eng-2014")
ca.batsmanAvgRunsGround("kohliTestEng2018.csv","Kohli-Eng-2018")


2a. Kohli’s cumulative average runs in 2014 & 2018

Kohli’s cumulative average runs in 2014 is in the low 15s, while in 2018 it is 70+. Kohli stamps his class back again and undoes the bad memories of 2014

import cricpy.analytics as ca
ca.batsmanCumulativeAverageRuns("kohliTestEng2014.csv", "Kohli-Eng-2014")

ca.batsmanCumulativeAverageRuns("kohliTestEng2018.csv", "Kohli-Eng-2018")

3a. Compare the performances of Ganguly, Dravid and VVS Laxman against opposition in ‘away’ matches in Tests

The analyses below compares the performances of Sourav Ganguly, Rahul Dravid and VVS Laxman against Australia, South Africa, and England in ‘away’ venues between 01 Jan 2002 to 01 Jan 2008

import cricpy.analytics as ca
#Get the HA data for Ganguly, Dravid and Laxman
#df=ca.getPlayerDataHA(28779,tfile="gangulyTestHA.csv",type="batting",matchType="Test")
#df=ca.getPlayerDataHA(28114,tfile="dravidTestHA.csv",type="batting",matchType="Test")
#df=ca.getPlayerDataHA(30750,tfile="laxmanTestHA.csv",type="batting",matchType="Test")

# Slice the data 
df=ca.getPlayerDataOppnHA(infile="gangulyTestHA.csv",outfile="gangulyTestAES2002-08.csv" ,opposition=["Australia", "England", "South Africa"],                        homeOrAway=["away"],startDate="2002-01-01",endDate="2008-01-01")
df=ca.getPlayerDataOppnHA(infile="dravidTestHA.csv",outfile="dravidTestAES2002-08.csv" ,opposition=["Australia", "England", "South Africa"],                        homeOrAway=["away"],startDate="2002-01-01",endDate="2008-01-01")
df=ca.getPlayerDataOppnHA(infile="laxmanTestHA.csv",outfile="laxmanTestAES2002-08.csv",opposition=["Australia", "England", "South Africa"],                       homeOrAway=["away"],startDate="2002-01-01",endDate="2008-01-01")

3b Plot the relative cumulative average runs and relative cumative strike rate

Plot the relative cumulative average runs and relative cumative strike rate of Ganguly, Dravid and Laxman

-Dravid towers over Laxman and Ganguly with respect to cumulative average runs. – Ganguly has a superior strike rate followed by Laxman and then Dravid

import cricpy.analytics as ca
frames=["gangulyTestAES2002-08.csv","dravidTestAES2002-08.csv","laxmanTestAES2002-08.csv"]
names=["GangulyAusEngSA2002-08","DravidAusEngSA2002-08","LaxmanAusEngSA2002-08"]
ca.relativeBatsmanCumulativeAvgRuns(frames,names)

ca.relativeBatsmanCumulativeStrikeRate(frames,names)

4. Compare the ODI performances of Rohit Sharma, Joe Root and Kane Williamson against opposition

Compare the performances of Rohit Sharma, Joe Root and Kane williamson in away & neutral venues against Australia, West Indies and Soouth Africa

  • Joe Root piles us the runs in about 15 matches. Rohit has played far more ODIs than the other two and averages a steady 35+
import cricpy.analytics as ca
# Get the ODI HA data for Rohit, Root and Williamson
#df=ca.getPlayerDataHA(34102,tfile="rohitODIHA.csv",type="batting",matchType="ODI")
#df=ca.getPlayerDataHA(303669,tfile="joerootODIHA.csv",type="batting",matchType="ODI")
#df=ca.getPlayerDataHA(277906,tfile="williamsonODIHA.csv",type="batting",matchType="ODI")

# Subset the data for specific opposition in away and neutral venues
## C:\Users\Ganesh\ANACON~1\lib\site-packages\statsmodels\compat\pandas.py:56: FutureWarning: The pandas.core.datetools module is deprecated and will be removed in a future version. Please use the pandas.tseries module instead.
##   from pandas.core import datetools
df=ca.getPlayerDataOppnHA(infile="rohitODIHA.csv",outfile="rohitODIAusWISA.csv"
                       ,opposition=["Australia", "West Indies", "South Africa"],
                      homeOrAway=["away","neutral"])
df=ca.getPlayerDataOppnHA(infile="joerootODIHA.csv",outfile="joerootODIAusWISA.csv"
                       ,opposition=["Australia", "West Indies", "South Africa"],
                       homeOrAway=["away","neutral"])
df=ca.getPlayerDataOppnHA(infile="williamsonODIHA.csv",outfile="williamsonODIAusWiSA.csv",opposition=["Australia", "West Indies", "South Africa"],                    homeOrAway=["away","neutral"])

4a. Compare cumulative strike rates and cumulative average runs of Rohit, Root and Williamson

The relative cumulative strike rate of all 3 are comparable

import cricpy.analytics as ca
frames=["rohitODIAusWISA.csv","joerootODIAusWISA.csv","williamsonODIAusWiSA.csv"]
names=["Rohit-ODI-AusWISA","Joe Root-ODI-AusWISA","Williamson-ODI-AusWISA"]
ca.relativeBatsmanCumulativeAvgRuns(frames,names)

ca.relativeBatsmanCumulativeStrikeRate(frames,names)

5. Plot the performance of Dhoni in T20s against specific opposition at all venues

Plot the performances of Dhoni against Australia, West Indies, South Africa and England

import cricpy.analytics as ca
# Get the HA T20 data for Dhoni
#df=ca.getPlayerDataHA(28081,tfile="dhoniT20HA.csv",type="batting",matchType="T20")
#Subset the data
df=ca.getPlayerDataOppnHA(infile="dhoniT20HA.csv",outfile="dhoniT20AusWISAEng.csv",opposition=["Australia", "West Indies", "South Africa","England"],                homeOrAway=["all"])

5a. Plot Dhoni’s performances in T20

Note You can use any of cricpy’s functions against the fine grained data

import cricpy.analytics as ca
ca.batsmanAvgRunsOpposition("dhoniT20AusWISAEng.csv","Dhoni")

ca.batsmanAvgRunsGround("dhoniT20AusWISAEng.csv","Dhoni")

ca.batsmanCumulativeStrikeRate("dhoniT20AusWISAEng.csv","Dhoni")

ca.batsmanCumulativeAverageRuns("dhoniT20AusWISAEng.csv","Dhoni")

6. Compute and performances of Anil Kumble, Muralitharan and Warne in ‘away’ test matches

Compute the performances of Kumble, Warne and Maralitharan against New Zealand, West Indies, South Africa and England in pitches that are not ‘home’ pithes

import cricpy.analytics as ca
# Get the bowling data for Kumble, Warne and Muralitharan in Test matches
#df=ca.getPlayerDataHA(30176,tfile="kumbleTestHA.csv",type="bowling",matchType="Test")
#df=ca.getPlayerDataHA(8166,tfile="warneTestHA.csv",type="bowling",matchType="Test")
#df=ca.getPlayerDataHA(49636,tfile="muraliTestHA.csv",type="bowling",matchType="Test")

# Subset the data
df=ca.getPlayerDataOppnHA(infile="kumbleTestHA.csv",outfile="kumbleTest-NZWISAEng.csv",opposition=["New Zealand", "West Indies", "South Africa","England"],
                       homeOrAway=["away"])

df=ca.getPlayerDataOppnHA(infile="warneTestHA.csv",outfile="warneTest-NZWISAEng.csv"
                       ,opposition=["New Zealand", "West Indies", "South Africa","England"], homeOrAway=["away"])

df=ca.getPlayerDataOppnHA(infile="muraliTestHA.csv",outfile="muraliTest-NZWISAEng.csv"
                       ,opposition=["New Zealand", "West Indies", "South Africa","England"], homeOrAway=["away"])

6a. Plot the average wickets of Kumble, Warne and Murali

import cricpy.analytics as ca
ca.bowlerAvgWktsOpposition("kumbleTest-NZWISAEng.csv","Kumble-NZWISAEng-AN")

ca.bowlerAvgWktsOpposition("warneTest-NZWISAEng.csv","Warne-NZWISAEng-AN")

ca.bowlerAvgWktsOpposition("muraliTest-NZWISAEng.csv","Murali-NZWISAEng-AN")

6b. Plot the average wickets in different grounds of Kumble, Warne and Murali

import cricpy.analytics as ca
ca.bowlerAvgWktsGround("kumbleTest-NZWISAEng.csv","Kumble")

ca.bowlerAvgWktsGround("warneTest-NZWISAEng.csv","Warne")

ca.bowlerAvgWktsGround("muraliTest-NZWISAEng.csv","Murali")

6c. Plot the cumulative average wickets and cumulative economy rate of Kumble, Warne and Murali

  • Murali has the best economy rate followed by Kumble and then Warne
  • Again Murali has the best cumulative average wickets followed by Warne and then Kumble
import cricpy.analytics as ca
frames=["kumbleTest-NZWISAEng.csv","warneTest-NZWISAEng.csv","muraliTest-NZWISAEng.csv"]
names=["Kumble","Warne","Murali"]
ca.relativeBowlerCumulativeAvgEconRate(frames,names)

ca.relativeBowlerCumulativeAvgWickets(frames,names)

7. Compute and plot the performances of Bumrah in 2016, 2017 and 2018 in ODIs

import cricpy.analytics as ca
# Get the HA data for Bumrah in ODI in bowling
#df=ca.getPlayerDataHA(625383,tfile="bumrahODIHA.csv",type="bowling",matchType="ODI")

# Slice the data for periods 2016, 2017 and 2018
df=ca.getPlayerDataOppnHA(infile="bumrahODIHA.csv",outfile="bumrahODI2016.csv",
                       startDate="2016-01-01",endDate="2017-01-01")

df=ca.getPlayerDataOppnHA(infile="bumrahODIHA.csv",outfile="bumrahODI2017.csv",
                       startDate="2017-01-01",endDate="2018-01-01")

df=ca.getPlayerDataOppnHA(infile="bumrahODIHA.csv",outfile="bumrahODI2018.csv",
                       startDate="2018-01-01",endDate="2019-01-01")

7a. Compute the performances of Bumrah in 2016, 2017 and 2018

  • Very clearly Bumrah is getting better at his art. His economy rate in 2018 is the best!!!
  • Bumrah has had a very prolific year in 2017. However all the years he seems to be quite effective
import cricpy.analytics as ca
frames=["bumrahODI2016.csv","bumrahODI2017.csv","bumrahODI2018.csv"]
names=["Bumrah-2016","Bumrah-2017","Bumrah-2018"]
ca.relativeBowlerCumulativeAvgEconRate(frames,names)

ca.relativeBowlerCumulativeAvgWickets(frames,names)

8. Compute and plot the performances of Shakib, Bumrah and Jadeja in T20 matches for bowling

import cricpy.analytics as ca
# Get the HA bowling data for Shakib, Bumrah and Jadeja
#df=ca.getPlayerDataHA(56143,tfile="shakibT20HA.csv",type="bowling",matchType="T20")
#df=ca.getPlayerDataHA(625383,tfile="bumrahT20HA.csv",type="bowling",matchType="T20")
#df=ca.getPlayerDataHA(234675,tfile="jadejaT20HA.csv",type="bowling",matchType="T20")

# Slice the data for performances against Sri Lanka, Australia, South Africa and England
df=ca.getPlayerDataOppnHA(infile="shakibT20HA.csv",outfile="shakibT20-SLAusSAEng.csv" ,opposition=["Sri Lanka","Australia", "South Africa","England"],
                       homeOrAway=["all"])
df=ca.getPlayerDataOppnHA(infile="bumrahT20HA.csv",outfile="bumrahT20-SLAusSAEng.csv",opposition=["Sri Lanka","Australia", "South Africa","England"],
                       homeOrAway=["all"])

df=ca.getPlayerDataOppnHA(infile="jadejaT20HA.csv",outfile="jadejaT20-SLAusSAEng.csv"                      ,opposition=["Sri Lanka","Australia", "South Africa","England"],   homeOrAway=["all"])

8a. Compare the relative performances of Shakib, Bumrah and Jadeja

  • Jadeja and Bumrah have comparable economy rates. Shakib is more expensive
  • Shakib pips Bumrah in number of cumulative wickets, though Bumrah is close behind
import cricpy.analytics as ca
frames=["shakibT20-SLAusSAEng.csv","bumrahT20-SLAusSAEng.csv","jadejaT20-SLAusSAEng.csv"]
names=["Shakib-SLAusSAEng","Bumrah-SLAusSAEng","Jadeja-SLAusSAEng"]
ca.relativeBowlerCumulativeAvgEconRate(frames,names)

ca.relativeBowlerCumulativeAvgWickets(frames,names)

Conclusion

By getting the homeOrAway data for players using the profileNo, you can slice and dice the data based on your choice of opposition, whether you want matches that were played at home/away/neutral venues. Finally by specifying the period for which the data has to be subsetted you can create fine grained analysis.

Hope you have a great time with cricpy!!!

Also see
1. My book ‘Cricket analytics with cricketr and cricpy’ is now on Amazon
2. The 3rd paperback & kindle editions of my books on Cricket, now on Amazon
3. Exploring Quantum Gate operations with QCSimulator
4. Deep Learning from first principles in Python, R and Octave – Part 6
5. Natural selection of database technology through the years
6. Pitching yorkpy … short of good length to IPL – Part 1
7. Using Linear Programming (LP) for optimizing bowling change or batting lineup in T20 cricket
8. Practical Machine Learning with R and Python – Part 3

To see all posts click Index of posts

Getting started with Tensorflow, Keras in Python and R

The Pale Blue Dot

“From this distant vantage point, the Earth might not seem of any particular interest. But for us, it’s different. Consider again that dot. That’s here, that’s home, that’s us. On it everyone you love, everyone you know, everyone you ever heard of, every human being who ever was, lived out their lives. The aggregate of our joy and suffering, thousands of confident religions, ideologies, and economic doctrines, every hunter and forager, every hero and coward, every creator and destroyer of civilization, every king and peasant, every young couple in love, every mother and father, hopeful child, inventor and explorer, every teacher of morals, every corrupt politician, every “superstar,” every “supreme leader,” every saint and sinner in the history of our species lived there—on the mote of dust suspended in a sunbeam.”

Carl Sagan

Tensorflow and Keras are Deep Learning frameworks that really simplify a lot of things to the user. If you are familiar with Machine Learning and Deep Learning concepts then Tensorflow and Keras are really a playground to realize your ideas.  In this post I show how you can get started with Tensorflow in both Python and R


Tensorflow in Python

For tensorflow in Python, I found Google’s Colab an ideal environment for running your Deep Learning code. This is an Google’s research project  where you can execute your code  on GPUs, TPUs etc

Tensorflow in R (RStudio)

To execute tensorflow in R (RStudio) you need to install tensorflow and keras as shown below
In this post I show how to get started with Tensorflow and Keras in R.

# Install Tensorflow in RStudio
#install_tensorflow()
# Install Keras
#install_packages("keras")
library(tensorflow)
libary(keras)

This post takes 3 different Machine Learning problems and uses the
Tensorflow/Keras framework to solve it

Note:
You can view the Google Colab notebook at Tensorflow in Python
The RMarkdown file has been published at RPubs and can be accessed
at Getting started with Tensorflow in R

Checkout my book ‘Deep Learning from first principles: Second Edition – In vectorized Python, R and Octave’. My book starts with the implementation of a simple 2-layer Neural Network and works its way to a generic L-Layer Deep Learning Network, with all the bells and whistles. The derivations have been discussed in detail. The code has been extensively commented and included in its entirety in the Appendix sections. My book is available on Amazon as paperback ($14.99) and in kindle version($9.99/Rs449).

1. Multivariate regression with Tensorflow – Python

This code performs multivariate regression using Tensorflow and keras on the advent of Parkinson disease through sound recordings see Parkinson Speech Dataset with Multiple Types of Sound Recordings Data Set . The clinician’s motorUPDRS score has to be predicted from the set of features

In [0]:
# Import tensorflow
import tensorflow as tf
from tensorflow import keras
In [2]:
#Get the data rom the UCI Machine Learning repository
dataset = keras.utils.get_file("parkinsons_updrs.data", "https://archive.ics.uci.edu/ml/machine-learning-databases/parkinsons/telemonitoring/parkinsons_updrs.data")
Downloading data from https://archive.ics.uci.edu/ml/machine-learning-databases/parkinsons/telemonitoring/parkinsons_updrs.data
917504/911261 [==============================] - 0s 0us/step
In [3]:
# Read the CSV file 
import pandas as pd
parkinsons = pd.read_csv(dataset, na_values = "?", comment='\t',
                      sep=",", skipinitialspace=True)
print(parkinsons.shape)
print(parkinsons.columns)
#Check if there are any NAs in the rows
parkinsons.isna().sum()
(5875, 22)
Index(['subject#', 'age', 'sex', 'test_time', 'motor_UPDRS', 'total_UPDRS',
       'Jitter(%)', 'Jitter(Abs)', 'Jitter:RAP', 'Jitter:PPQ5', 'Jitter:DDP',
       'Shimmer', 'Shimmer(dB)', 'Shimmer:APQ3', 'Shimmer:APQ5',
       'Shimmer:APQ11', 'Shimmer:DDA', 'NHR', 'HNR', 'RPDE', 'DFA', 'PPE'],
      dtype='object')
Out[3]:
subject#         0
age              0
sex              0
test_time        0
motor_UPDRS      0
total_UPDRS      0
Jitter(%)        0
Jitter(Abs)      0
Jitter:RAP       0
Jitter:PPQ5      0
Jitter:DDP       0
Shimmer          0
Shimmer(dB)      0
Shimmer:APQ3     0
Shimmer:APQ5     0
Shimmer:APQ11    0
Shimmer:DDA      0
NHR              0
HNR              0
RPDE             0
DFA              0
PPE              0
dtype: int64
Note: To see how to create dummy variables see my post Practical Machine Learning with R and Python – Part 2
In [4]:
# Drop the columns subject number as it is not relevant
parkinsons1=parkinsons.drop(['subject#'],axis=1)

# Create dummy variables for sex (M/F)
parkinsons2=pd.get_dummies(parkinsons1,columns=['sex'])
parkinsons2.head()

Out[4]
age test_time motor_UPDRS total_UPDRS Jitter(%) Jitter(Abs) Jitter:RAP Jitter:PPQ5 Jitter:DDP Shimmer Shimmer(dB) Shimmer:APQ3 Shimmer:APQ5 Shimmer:APQ11 Shimmer:DDA NHR HNR RPDE DFA PPE sex_0 sex_1
0 72 5.6431 28.199 34.398 0.00662 0.000034 0.00401 0.00317 0.01204 0.02565 0.230 0.01438 0.01309 0.01662 0.04314 0.014290 21.640 0.41888 0.54842 0.16006 1 0
1 72 12.6660 28.447 34.894 0.00300 0.000017 0.00132 0.00150 0.00395 0.02024 0.179 0.00994 0.01072 0.01689 0.02982 0.011112 27.183 0.43493 0.56477 0.10810 1 0
2 72 19.6810 28.695 35.389 0.00481 0.000025 0.00205 0.00208 0.00616 0.01675 0.181 0.00734 0.00844 0.01458 0.02202 0.020220 23.047 0.46222 0.54405 0.21014 1 0
3 72 25.6470 28.905 35.810 0.00528 0.000027 0.00191 0.00264 0.00573 0.02309 0.327 0.01106 0.01265 0.01963 0.03317 0.027837 24.445 0.48730 0.57794 0.33277 1 0
4 72 33.6420 29.187 36.375 0.00335 0.000020 0.00093 0.00130 0.00278 0.01703 0.176 0.00679 0.00929 0.01819 0.02036 0.011625 26.126 0.47188 0.56122 0.19361 1 0

# Create a training and test data set with 80%/20%
train_dataset = parkinsons2.sample(frac=0.8,random_state=0)
test_dataset = parkinsons2.drop(train_dataset.index)

# Select columns
train_dataset1= train_dataset[['age', 'test_time', 'Jitter(%)', 'Jitter(Abs)',
       'Jitter:RAP', 'Jitter:PPQ5', 'Jitter:DDP', 'Shimmer', 'Shimmer(dB)',
       'Shimmer:APQ3', 'Shimmer:APQ5', 'Shimmer:APQ11', 'Shimmer:DDA', 'NHR',
       'HNR', 'RPDE', 'DFA', 'PPE', 'sex_0', 'sex_1']]
test_dataset1= test_dataset[['age','test_time', 'Jitter(%)', 'Jitter(Abs)',
       'Jitter:RAP', 'Jitter:PPQ5', 'Jitter:DDP', 'Shimmer', 'Shimmer(dB)',
       'Shimmer:APQ3', 'Shimmer:APQ5', 'Shimmer:APQ11', 'Shimmer:DDA', 'NHR',
       'HNR', 'RPDE', 'DFA', 'PPE', 'sex_0', 'sex_1']]
In [7]:
# Generate the statistics of the columns for use in normalization of the data
train_stats = train_dataset1.describe()
train_stats = train_stats.transpose()
train_stats
Out[7]:
count mean std min 25% 50% 75% max
age 4700.0 64.792766 8.870401 36.000000 58.000000 65.000000 72.000000 85.000000
test_time 4700.0 93.399490 53.630411 -4.262500 46.852250 93.405000 139.367500 215.490000
Jitter(%) 4700.0 0.006136 0.005612 0.000830 0.003560 0.004900 0.006770 0.099990
Jitter(Abs) 4700.0 0.000044 0.000036 0.000002 0.000022 0.000034 0.000053 0.000396
Jitter:RAP 4700.0 0.002969 0.003089 0.000330 0.001570 0.002235 0.003260 0.057540
Jitter:PPQ5 4700.0 0.003271 0.003760 0.000430 0.001810 0.002480 0.003460 0.069560
Jitter:DDP 4700.0 0.008908 0.009267 0.000980 0.004710 0.006705 0.009790 0.172630
Shimmer 4700.0 0.033992 0.025922 0.003060 0.019020 0.027385 0.039810 0.268630
Shimmer(dB) 4700.0 0.310487 0.231016 0.026000 0.175000 0.251000 0.363250 2.107000
Shimmer:APQ3 4700.0 0.017125 0.013275 0.001610 0.009190 0.013615 0.020562 0.162670
Shimmer:APQ5 4700.0 0.020151 0.016848 0.001940 0.010750 0.015785 0.023733 0.167020
Shimmer:APQ11 4700.0 0.027508 0.020270 0.002490 0.015630 0.022685 0.032713 0.275460
Shimmer:DDA 4700.0 0.051375 0.039826 0.004840 0.027567 0.040845 0.061683 0.488020
NHR 4700.0 0.032116 0.060206 0.000304 0.010827 0.018403 0.031452 0.748260
HNR 4700.0 21.704631 4.288853 1.659000 19.447750 21.973000 24.445250 37.187000
RPDE 4700.0 0.542549 0.100212 0.151020 0.471235 0.543490 0.614335 0.966080
DFA 4700.0 0.653015 0.070446 0.514040 0.596470 0.643285 0.710618 0.865600
PPE 4700.0 0.219559 0.091506 0.021983 0.156470 0.205340 0.264017 0.731730
sex_0 4700.0 0.681489 0.465948 0.000000 0.000000 1.000000 1.000000 1.000000
sex_1 4700.0 0.318511 0.465948 0.000000 0.000000 0.000000 1.000000 1.000000
In [0]:
# Create the target variable
train_labels = train_dataset.pop('motor_UPDRS')
test_labels = test_dataset.pop('motor_UPDRS')
In [0]:
# Normalize the data by subtracting the mean and dividing by the standard deviation
def normalize(x):
  return (x - train_stats['mean']) / train_stats['std']

# Create normalized training and test data
normalized_train_data = normalize(train_dataset1)
normalized_test_data = normalize(test_dataset1)
In [0]:
# Create a Deep Learning model with keras
model = tf.keras.Sequential([
    keras.layers.Dense(6, activation=tf.nn.relu, input_shape=[len(train_dataset1.keys())]),
    keras.layers.Dense(9, activation=tf.nn.relu),
    keras.layers.Dense(6,activation=tf.nn.relu),
    keras.layers.Dense(1)
  ])

# Use the Adam optimizer with a learning rate of 0.01
optimizer=keras.optimizers.Adam(lr=.01, beta_1=0.9, beta_2=0.999, epsilon=None, decay=0.0, amsgrad=False)

# Set the metrics required to be Mean Absolute Error and Mean Squared Error.For regression, the loss is mean_squared_error
model.compile(loss='mean_squared_error',
                optimizer=optimizer,
                metrics=['mean_absolute_error', 'mean_squared_error'])
In [0]:
# Create a model
history=model.fit(
  normalized_train_data, train_labels,
  epochs=1000, validation_data = (normalized_test_data,test_labels), verbose=0)
In [26]:
hist = pd.DataFrame(history.history)
hist['epoch'] = history.epoch
hist.tail()
Out[26]:
loss mean_absolute_error mean_squared_error val_loss val_mean_absolute_error val_mean_squared_error epoch
995 15.773989 2.936990 15.773988 16.980803 3.028168 16.980803 995
996 15.238623 2.873420 15.238622 17.458752 3.101033 17.458752 996
997 15.437594 2.895500 15.437593 16.926016 2.971508 16.926018 997
998 15.867891 2.943521 15.867892 16.950249 2.985036 16.950249 998
999 15.846878 2.938914 15.846880 17.095623 3.014504 17.095625 999
In [30]:
def plot_history(history):
  hist = pd.DataFrame(history.history)
  hist['epoch'] = history.epoch

  plt.figure()
  plt.xlabel('Epoch')
  plt.ylabel('Mean Abs Error')
  plt.plot(hist['epoch'], hist['mean_absolute_error'],
           label='Train Error')
  plt.plot(hist['epoch'], hist['val_mean_absolute_error'],
           label = 'Val Error')
  plt.ylim([2,5])
  plt.legend()

  plt.figure()
  plt.xlabel('Epoch')
  plt.ylabel('Mean Square Error ')
  plt.plot(hist['epoch'], hist['mean_squared_error'],
           label='Train Error')
  plt.plot(hist['epoch'], hist['val_mean_squared_error'],
           label = 'Val Error')
  plt.ylim([10,40])
  plt.legend()
  plt.show()


plot_history(history)

Observation

It can be seen that the mean absolute error is on an average about +/- 4.0. The validation error also is about the same. This can be reduced by playing around with the hyperparamaters and increasing the number of iterations

1a. Multivariate Regression in Tensorflow – R

# Install Tensorflow in RStudio
#install_tensorflow()
# Install Keras
#install_packages("keras")
library(tensorflow)
library(keras)
library(dplyr)
library(dummies)
## dummies-1.5.6 provided by Decision Patterns
library(tensorflow)
library(keras)

Multivariate regression

This code performs multivariate regression using Tensorflow and keras on the advent of Parkinson disease through sound recordings see Parkinson Speech Dataset with Multiple Types of Sound Recordings Data Set. The clinician’s motorUPDRS score has to be predicted from the set of features.

Read the data

# Download the Parkinson's data from UCI Machine Learning repository
dataset <- read.csv("https://archive.ics.uci.edu/ml/machine-learning-databases/parkinsons/telemonitoring/parkinsons_updrs.data")

# Set the column names
names(dataset) <- c("subject","age", "sex", "test_time","motor_UPDRS","total_UPDRS","Jitter","Jitter.Abs",
                 "Jitter.RAP","Jitter.PPQ5","Jitter.DDP","Shimmer", "Shimmer.dB", "Shimmer.APQ3",
                 "Shimmer.APQ5","Shimmer.APQ11","Shimmer.DDA", "NHR","HNR", "RPDE", "DFA","PPE")

# Remove the column 'subject' as it is not relevant to analysis
dataset1 <- subset(dataset, select = -c(subject))

# Make the column 'sex' as a factor for using dummies
dataset1$sex=as.factor(dataset1$sex)
# Add dummy variables for categorical cariable 'sex'
dataset2 <- dummy.data.frame(dataset1, sep = ".")
## Warning in model.matrix.default(~x - 1, model.frame(~x - 1), contrasts =
## FALSE): non-list contrasts argument ignored
dataset3 <- na.omit(dataset2)

Split the data as training and test in 80/20

## Split data 80% training and 20% test
sample_size <- floor(0.8 * nrow(dataset3))

## set the seed to make your partition reproducible
set.seed(12)
train_index <- sample(seq_len(nrow(dataset3)), size = sample_size)

train_dataset <- dataset3[train_index, ]
test_dataset <- dataset3[-train_index, ]

train_data <- train_dataset %>% select(sex.0,sex.1,age, test_time,Jitter,Jitter.Abs,Jitter.PPQ5,Jitter.DDP,
                              Shimmer, Shimmer.dB,Shimmer.APQ3,Shimmer.APQ11,
                              Shimmer.DDA,NHR,HNR,RPDE,DFA,PPE)

train_labels <- select(train_dataset,motor_UPDRS)
test_data <- test_dataset %>% select(sex.0,sex.1,age, test_time,Jitter,Jitter.Abs,Jitter.PPQ5,Jitter.DDP,
                              Shimmer, Shimmer.dB,Shimmer.APQ3,Shimmer.APQ11,
                              Shimmer.DDA,NHR,HNR,RPDE,DFA,PPE)
test_labels <- select(test_dataset,motor_UPDRS)

Normalize the data

 # Normalize the data by subtracting the mean and dividing by the standard deviation
normalize<-function(x) {
  y<-(x - mean(x)) / sd(x)
  return(y)
}

normalized_train_data <-apply(train_data,2,normalize)
# Convert to matrix
train_labels <- as.matrix(train_labels)
normalized_test_data <- apply(test_data,2,normalize)
test_labels <- as.matrix(test_labels)

Create the Deep Learning Model

model <- keras_model_sequential()
model %>% 
  layer_dense(units = 6, activation = 'relu', input_shape = dim(normalized_train_data)[2]) %>% 
  layer_dense(units = 9, activation = 'relu') %>%
  layer_dense(units = 6, activation = 'relu') %>%
  layer_dense(units = 1)

# Set the metrics required to be Mean Absolute Error and Mean Squared Error.For regression, the loss is 
# mean_squared_error
model %>% compile(
  loss = 'mean_squared_error',
  optimizer = optimizer_rmsprop(),
  metrics = c('mean_absolute_error','mean_squared_error')
)

# Fit the model
# Use the test data for validation
history <- model %>% fit(
  normalized_train_data, train_labels, 
  epochs = 30, batch_size = 128, 
  validation_data = list(normalized_test_data,test_labels)
)

Plot mean squared error, mean absolute error and loss for training data and test data

plot(history)

Fig1

2. Binary classification in Tensorflow – Python

This is a simple binary classification problem from UCI Machine Learning repository and deals with data on Breast cancer from the Univ. of Wisconsin Breast Cancer Wisconsin (Diagnostic) Data Set bold text

In [31]:
import tensorflow as tf
from tensorflow import keras
import pandas as pd
# Read the data set from UCI ML site
dataset_path = keras.utils.get_file("breast-cancer-wisconsin.data", "https://archive.ics.uci.edu/ml/machine-learning-databases/breast-cancer-wisconsin/breast-cancer-wisconsin.data")
raw_dataset = pd.read_csv(dataset_path, sep=",", na_values = "?", skipinitialspace=True,)
dataset = raw_dataset.copy()

#Check for Null and drop
dataset.isna().sum()
dataset = dataset.dropna()
dataset.isna().sum()

# Set the column names
dataset.columns = ["id","thickness",	"cellsize",	"cellshape","adhesion","epicellsize",
                    "barenuclei","chromatin","normalnucleoli","mitoses","class"]
dataset.head()
Downloading data from https://archive.ics.uci.edu/ml/machine-learning-databases/breast-cancer-wisconsin/breast-cancer-wisconsin.data
24576/19889 [=====================================] - 0s 1us/step
id	thickness	cellsize	cellshape	adhesion	epicellsize	barenuclei	chromatin	normalnucleoli	mitoses	class
0	1002945	5	4	4	5	7	10.0	3	2	1	2
1	1015425	3	1	1	1	2	2.0	3	1	1	2
2	1016277	6	8	8	1	3	4.0	3	7	1	2
3	1017023	4	1	1	3	2	1.0	3	1	1	2
4	1017122	8	10	10	8	7	10.0	9	7	1	4
# Create a training/test set in the ratio 80/20
train_dataset = dataset.sample(frac=0.8,random_state=0)
test_dataset = dataset.drop(train_dataset.index)

# Set the training and test set
train_dataset1= train_dataset[['thickness','cellsize','cellshape','adhesion',
                'epicellsize', 'barenuclei', 'chromatin', 'normalnucleoli','mitoses']]
test_dataset1=test_dataset[['thickness','cellsize','cellshape','adhesion',
                'epicellsize', 'barenuclei', 'chromatin', 'normalnucleoli','mitoses']]
In [34]:
# Generate the stats for each column to be used for normalization
train_stats = train_dataset1.describe()
train_stats = train_stats.transpose()
train_stats
Out[34]:
count mean std min 25% 50% 75% max
thickness 546.0 4.430403 2.812768 1.0 2.0 4.0 6.0 10.0
cellsize 546.0 3.179487 3.083668 1.0 1.0 1.0 5.0 10.0
cellshape 546.0 3.225275 3.005588 1.0 1.0 1.0 5.0 10.0
adhesion 546.0 2.921245 2.937144 1.0 1.0 1.0 4.0 10.0
epicellsize 546.0 3.261905 2.252643 1.0 2.0 2.0 4.0 10.0
barenuclei 546.0 3.560440 3.651946 1.0 1.0 1.0 7.0 10.0
chromatin 546.0 3.483516 2.492687 1.0 2.0 3.0 5.0 10.0
normalnucleoli 546.0 2.875458 3.064305 1.0 1.0 1.0 4.0 10.0
mitoses 546.0 1.609890 1.736762 1.0 1.0 1.0 1.0 10.0
In [0]:
# Create target variables
train_labels = train_dataset.pop('class')
test_labels = test_dataset.pop('class')
In [0]:
# Set the target variables as 0 or 1
train_labels[train_labels==2] =0 # benign
train_labels[train_labels==4] =1 # malignant

test_labels[test_labels==2] =0 # benign
test_labels[test_labels==4] =1 # malignant
In [0]:
# Normalize by subtracting mean and dividing by standard deviation
def normalize(x):
  return (x - train_stats['mean']) / train_stats['std']

# Convert columns to numeric
train_dataset1 = train_dataset1.apply(pd.to_numeric)
test_dataset1 = test_dataset1.apply(pd.to_numeric)

# Normalize
normalized_train_data = normalize(train_dataset1)
normalized_test_data = normalize(test_dataset1)
In [0]:
# Create a model
model = tf.keras.Sequential([
    keras.layers.Dense(6, activation=tf.nn.relu, input_shape=[len(train_dataset1.keys())]),
    keras.layers.Dense(9, activation=tf.nn.relu),
    keras.layers.Dense(6,activation=tf.nn.relu),
    keras.layers.Dense(1)
  ])

# Use the RMSProp optimizer
optimizer = tf.keras.optimizers.RMSprop(0.01)

# Since this is binary classification use binary_crossentropy
model.compile(loss='binary_crossentropy',
                optimizer=optimizer,
                metrics=['acc'])


# Fit a model
history=model.fit(
  normalized_train_data, train_labels,
  epochs=1000, validation_data=(normalized_test_data,test_labels), verbose=0)
In [55]:
hist = pd.DataFrame(history.history)
hist['epoch'] = history.epoch
hist.tail()
loss acc val_loss val_acc epoch
995 0.112499 0.992674 0.454739 0.970588 995
996 0.112499 0.992674 0.454739 0.970588 996
997 0.112499 0.992674 0.454739 0.970588 997
998 0.112499 0.992674 0.454739 0.970588 998
999 0.112499 0.992674 0.454739 0.970588 999
In [58]:
# Plot training and test accuracy 
plt.plot(history.history['acc'])
plt.plot(history.history['val_acc'])
plt.title('model accuracy')
plt.ylabel('accuracy')
plt.xlabel('epoch')
plt.legend(['train', 'test'], loc='upper left')
plt.ylim([0.9,1])
plt.show()


# Plot training and test loss
plt.plot(history.history['loss'])
plt.plot(history.history['val_loss'])
plt.title('model loss')
plt.ylabel('loss')
plt.xlabel('epoch')
plt.legend(['train', 'test'], loc='upper left')
plt.ylim([0,0.5])
plt.show()


2a. Binary classification in Tensorflow -R

This is a simple binary classification problem from UCI Machine Learning repository and deals with data on Breast cancer from the Univ. of Wisconsin Breast Cancer Wisconsin (Diagnostic) Data Set

# Read the data for Breast cancer (Wisconsin)
dataset <- read.csv("https://archive.ics.uci.edu/ml/machine-learning-databases/breast-cancer-wisconsin/breast-cancer-wisconsin.data")

# Rename the columns
names(dataset) <- c("id","thickness",   "cellsize", "cellshape","adhesion","epicellsize",
                    "barenuclei","chromatin","normalnucleoli","mitoses","class")

# Remove the columns id and class
dataset1 <- subset(dataset, select = -c(id, class))
dataset2 <- na.omit(dataset1)

# Convert the column to numeric
dataset2$barenuclei <- as.numeric(dataset2$barenuclei)

Normalize the data

train_data <-apply(dataset2,2,normalize)
train_labels <- as.matrix(select(dataset,class))

# Set the target variables as 0 or 1 as it binary classification
train_labels[train_labels==2,]=0
train_labels[train_labels==4,]=1

Create the Deep Learning model

model <- keras_model_sequential()
model %>% 
  layer_dense(units = 6, activation = 'relu', input_shape = dim(train_data)[2]) %>% 
  layer_dense(units = 9, activation = 'relu') %>%
  layer_dense(units = 6, activation = 'relu') %>%
  layer_dense(units = 1)

# Since this is a binary classification we use binary cross entropy
model %>% compile(
  loss = 'binary_crossentropy',
  optimizer = optimizer_rmsprop(),
  metrics = c('accuracy')  # Metrics is accuracy
)

Fit the model. Use 20% of data for validation

history <- model %>% fit(
  train_data, train_labels, 
  epochs = 30, batch_size = 128, 
  validation_split = 0.2
)

Plot the accuracy and loss for training and validation data

plot(history)

3. MNIST in Tensorflow – Python

This takes the famous MNIST handwritten digits . It ca be seen that Tensorflow and Keras make short work of this famous problem of the late 1980s

# Download MNIST data
mnist=tf.keras.datasets.mnist
# Set training and test data and labels
(training_images,training_labels),(test_images,test_labels)=mnist.load_data()

print(training_images.shape)
print(test_images.shape)
(60000, 28, 28)
(10000, 28, 28)
In [61]:
# Plot a sample image from MNIST and show contents
import matplotlib.pyplot as plt
plt.imshow(training_images[1])
print(training_images[1])
[[ 0 0 0 0 0 0 0 0 0 0 0 0 0 0 0 0 0 0
0 0 0 0 0 0 0 0 0 0]
[ 0 0 0 0 0 0 0 0 0 0 0 0 0 0 0 0 0 0
0 0 0 0 0 0 0 0 0 0]
[ 0 0 0 0 0 0 0 0 0 0 0 0 0 0 0 0 0 0
0 0 0 0 0 0 0 0 0 0]
[ 0 0 0 0 0 0 0 0 0 0 0 0 0 0 0 0 0 0
0 0 0 0 0 0 0 0 0 0]
[ 0 0 0 0 0 0 0 0 0 0 0 0 0 0 0 51 159 253
159 50 0 0 0 0 0 0 0 0]
[ 0 0 0 0 0 0 0 0 0 0 0 0 0 0 48 238 252 252
252 237 0 0 0 0 0 0 0 0]
[ 0 0 0 0 0 0 0 0 0 0 0 0 0 54 227 253 252 239
233 252 57 6 0 0 0 0 0 0]
[ 0 0 0 0 0 0 0 0 0 0 0 10 60 224 252 253 252 202
84 252 253 122 0 0 0 0 0 0]
[ 0 0 0 0 0 0 0 0 0 0 0 163 252 252 252 253 252 252
96 189 253 167 0 0 0 0 0 0]
[ 0 0 0 0 0 0 0 0 0 0 51 238 253 253 190 114 253 228
47 79 255 168 0 0 0 0 0 0]
[ 0 0 0 0 0 0 0 0 0 48 238 252 252 179 12 75 121 21
0 0 253 243 50 0 0 0 0 0]
[ 0 0 0 0 0 0 0 0 38 165 253 233 208 84 0 0 0 0
0 0 253 252 165 0 0 0 0 0]
[ 0 0 0 0 0 0 0 7 178 252 240 71 19 28 0 0 0 0
0 0 253 252 195 0 0 0 0 0]
[ 0 0 0 0 0 0 0 57 252 252 63 0 0 0 0 0 0 0
0 0 253 252 195 0 0 0 0 0]
[ 0 0 0 0 0 0 0 198 253 190 0 0 0 0 0 0 0 0
0 0 255 253 196 0 0 0 0 0]
[ 0 0 0 0 0 0 76 246 252 112 0 0 0 0 0 0 0 0
0 0 253 252 148 0 0 0 0 0]
[ 0 0 0 0 0 0 85 252 230 25 0 0 0 0 0 0 0 0
7 135 253 186 12 0 0 0 0 0]
[ 0 0 0 0 0 0 85 252 223 0 0 0 0 0 0 0 0 7
131 252 225 71 0 0 0 0 0 0]
[ 0 0 0 0 0 0 85 252 145 0 0 0 0 0 0 0 48 165
252 173 0 0 0 0 0 0 0 0]
[ 0 0 0 0 0 0 86 253 225 0 0 0 0 0 0 114 238 253
162 0 0 0 0 0 0 0 0 0]
[ 0 0 0 0 0 0 85 252 249 146 48 29 85 178 225 253 223 167
56 0 0 0 0 0 0 0 0 0]
[ 0 0 0 0 0 0 85 252 252 252 229 215 252 252 252 196 130 0
0 0 0 0 0 0 0 0 0 0]
[ 0 0 0 0 0 0 28 199 252 252 253 252 252 233 145 0 0 0
0 0 0 0 0 0 0 0 0 0]
[ 0 0 0 0 0 0 0 25 128 252 253 252 141 37 0 0 0 0
0 0 0 0 0 0 0 0 0 0]
[ 0 0 0 0 0 0 0 0 0 0 0 0 0 0 0 0 0 0
0 0 0 0 0 0 0 0 0 0]
[ 0 0 0 0 0 0 0 0 0 0 0 0 0 0 0 0 0 0
0 0 0 0 0 0 0 0 0 0]
[ 0 0 0 0 0 0 0 0 0 0 0 0 0 0 0 0 0 0
0 0 0 0 0 0 0 0 0 0]
[ 0 0 0 0 0 0 0 0 0 0 0 0 0 0 0 0 0 0
0 0 0 0 0 0 0 0 0 0]]


# Normalize the images by dividing by 255.0
training_images = training_images/255.0
test_images = test_images/255.0

# Create a Sequential Keras model
model = tf.keras.models.Sequential([tf.keras.layers.Flatten(),
                                   tf.keras.layers.Dense(1024,activation=tf.nn.relu),
                                   tf.keras.layers.Dense(10,activation=tf.nn.softmax)])
model.compile(optimizer='adam',loss='sparse_categorical_crossentropy',metrics=['accuracy'])
In [68]:
history=model.fit(training_images,training_labels,validation_data=(test_images, test_labels), epochs=5, verbose=1)
Train on 60000 samples, validate on 10000 samples
Epoch 1/5
60000/60000 [==============================] - 17s 291us/sample - loss: 0.0020 - acc: 0.9999 - val_loss: 0.0719 - val_acc: 0.9810
Epoch 2/5
60000/60000 [==============================] - 17s 284us/sample - loss: 0.0021 - acc: 0.9998 - val_loss: 0.0705 - val_acc: 0.9821
Epoch 3/5
60000/60000 [==============================] - 17s 286us/sample - loss: 0.0017 - acc: 0.9999 - val_loss: 0.0729 - val_acc: 0.9805
Epoch 4/5
60000/60000 [==============================] - 17s 284us/sample - loss: 0.0014 - acc: 0.9999 - val_loss: 0.0762 - val_acc: 0.9804
Epoch 5/5
60000/60000 [==============================] - 17s 280us/sample - loss: 0.0015 - acc: 0.9999 - val_loss: 0.0735 - val_acc: 0.9812

Fig 1

Fig 2


MNIST in Tensorflow – R

The following code uses Tensorflow to learn MNIST’s handwritten digits ### Load MNIST data

mnist <- dataset_mnist()
x_train <- mnist$train$x
y_train <- mnist$train$y
x_test <- mnist$test$x
y_test <- mnist$test$y

Reshape and rescale

# Reshape the array
x_train <- array_reshape(x_train, c(nrow(x_train), 784))
x_test <- array_reshape(x_test, c(nrow(x_test), 784))
# Rescale
x_train <- x_train / 255
x_test <- x_test / 255

Convert out put to One Hot encoded format

y_train <- to_categorical(y_train, 10)
y_test <- to_categorical(y_test, 10)

Fit the model

Use the softmax activation for recognizing 10 digits and categorical cross entropy for loss

model <- keras_model_sequential() 
model %>% 
  layer_dense(units = 256, activation = 'relu', input_shape = c(784)) %>% 
  layer_dense(units = 128, activation = 'relu') %>%
  layer_dense(units = 10, activation = 'softmax') # Use softmax

model %>% compile(
  loss = 'categorical_crossentropy',
  optimizer = optimizer_rmsprop(),
  metrics = c('accuracy')
)

Fit the model

Note: A smaller number of epochs has been used. For better performance increase number of epochs

history <- model %>% fit(
  x_train, y_train, 
  epochs = 5, batch_size = 128, 
  validation_data = list(x_test,y_test)
)